Reactive Power Disturbances by Distributed
Generation in the Distribution Network
Vaibhav Koshta1, Tikeshwar Gajpal2
PG Student [Power Electronics], Dept. of EE, Raipur Institute of Technology, Raipur, Chhattisgarh, India1
Assistant Professor, Dept. of ECE, Raipur Institute of Technology, Raipur, Chhattisgarh, India2
ABSTRACT: With the increasing demand of power generation, the traditional costly methods of power generation require consumption of less abundantly non-renewable energy sources like coal, oil, etc. available in nature. A new technology has been developed to overcome this problem which is called as distributed generation (DG). A distributed generation utilizes renewable energy sources viz. solar, tidal, wind etc. for power generation to provide generated power into the distribution network (DN). There is a need to study and analyse the impacts of connecting DG to the DN. Simulation results for an IEEE-14 bus network were obtained with the help of PSAT 2.1.7 simulation software.
KEYWORDS: Distributed Generation, Distribution network, non-renewable energy sources, renewable energy sources etc..
I.INTRODUCTION
With the increasing demand of power, the traditional methods are very costly and utilize scarcely available non-renewable energy sources like oil, coal, etc. in nature for power generation. Although, with the utility like the power generated from these non-renewable sources is in thousands of megawatt (MW) while on the other hand, the cost of installation is very high and covers a large area for installation, emission of green house gases, toxic by-products such as lead, mercury, sulphur etc. and water contamination harmful to living organism are the main drawbacks of the conventional methods of power generation.
These problems may be solved up to the extent of utilizing renewable energy sources (viz. solar, tidal, wind etc.). A distributed generation is a technology which utilizes renewable energy sources for the production of electricity. Its capacity can be varied from few kW (kilowatt) to MW (megawatt) depending upon the power requirement at the site of installation. Various authors defined distributed generation (DG) as follows:
1. The Electric Power Research Institute defines distributed generation as generation from ‘a few kilowatts upto 50 MW’ [7].
2. According to the Gas Research Institute, distributed generation is ‘typically between 2 and 25 MW’ [7].
3. Cardell defines distributed generation as generation ‘between 500 kW and 1MW’ [1].
4. The International Conference on Large High Voltage Electric Systems (CIGRE) defines DG as ‘smaller than 50-100 MW’ [7].
A distributed generation posses several advantages over the conventional methods of power generation such as:
1. Produces no toxic by-product,
2. Economical installation,
3. Eco-friendly environment,
4. Small area of installation,
5. Varying production capabilities,
6. Free from green house gases etc.
The work undertaken is to find out the effects of DG on the distribution network when it is interfaced to the grid. An IEEE-14 bus network is simulated using PSAT 2.1.7. The results showed that DG disturbs the reactive power balance thereby more losses were observed in the network.
II.LITERATURE SURVEY
Authors [1] had studied the impact of Distributed Generation on 38kV distribution system and observed the disturbances in the voltage profile if large distributed generation is connected. To overcome the voltage drop, authors had suggested several methods like using shunt reactance, line voltage regulator, reduced voltage at feeding substation. Authors [2] had suggested to minimize the losses, an algorithm for finding the optimal location and size of distributed generation. Authors [3] had studied the losses for the optimal location of DG on the distribution network. It was suggested that the optimal location for DG connection is the bus with the largest amount of voltage drop indicated is the most preferred location for DG connection.
Authors [4] had tried to summarize the main driver behind the integration of DG. Drivers were classified into three
categories i.e. environmental, commercial, and a national/regulatory driver, which affects the penetration of DG into the network particularly on services provided by the DG such as frequency response, reactive power, voltage and power flow management services etc.
Authors [5] studied the different DG technologies and compared the cost of generation of energy from these non
renewable and renewable sources of energy.
Authors [6] had proposed the Monte Carlo Simulation method which incorporates the Newton Raphson method equations for the simulation and analysing the main sources of uncertainties considering three cases namely unbounded DG operation, constrained DG export power, and combined DG power constraints. The authors had noticed that with the penetration level of DG with respect to 15%, 25% and 35%, the power reduction is 167.04, 241.366 and 270.799 MW/day respectively. Authors [7] had defined DG differently on the basis of production capability and various other aspects such as location, purpose, rating, power delivery area etc.
Authors [8] proposed an algorithm which incorporates genetic algorithm implementation with Tabu search algorithm for the expansion of DG and is able to expand the network up to 72 bus network. Author [9] studied the voltage profile, line loss reduction, reduction of environmental impacts and observed an improvement in the voltage profile from 0.4% to 1.5% and reduction in line loss up to 46%.
Author [10] proposed to utilize a particle swarm optimization algorithm for the precise identity of the location and size of distributed generation.
III.METHODOLOGY
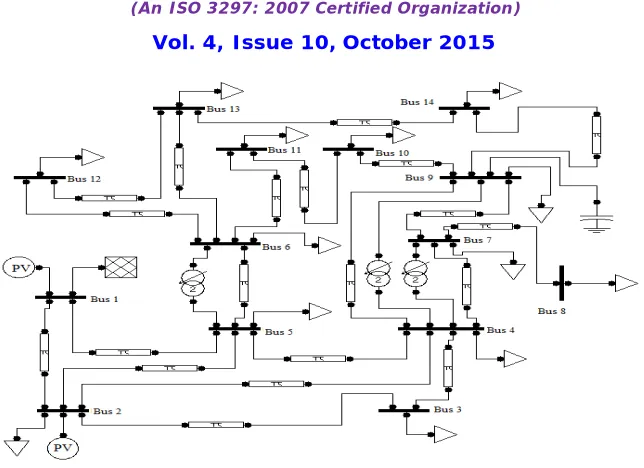
Fig. 1 IEEE-14 bus network without DG connection
An IEEE-14 bus network with DG connection is shown in Fig. 2
Fig. 2 IEEE-14 bus network with DG connection
IV.LOCATION OF DISTRIBUTED GENERATION
The optimal location of DG has been find out by identifying the weakest bus i.e. the bus with the smallest voltage magnitude indicated the most preferred location for installing a DG [3].
A wind based distributed generation of 50MVA and 11kV had been connected under the study. Simulation results were obtained with and without DG showed that the bus no. 12, 13 and 14 were the weakest buses wherein the location of bus no.14 was the weakest and most preferred for installation of DG.
V.RESULT AND DISCUSSION
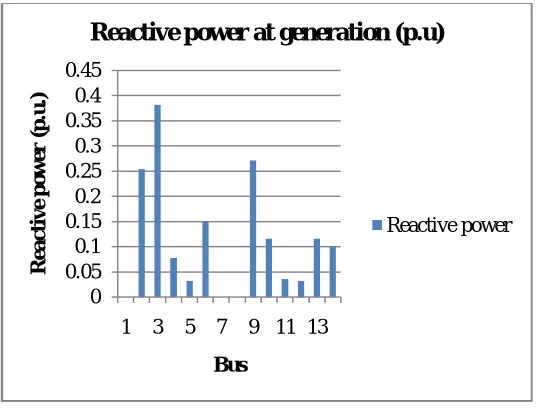
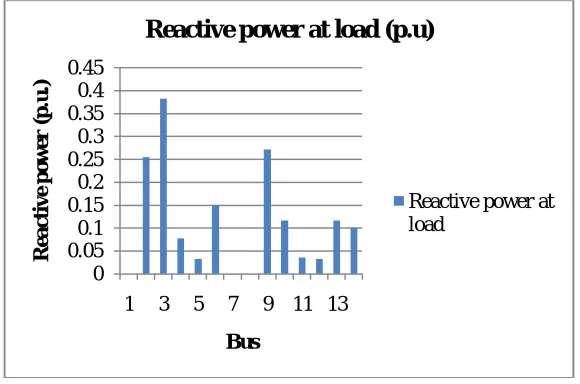
generation of electricity was observed at bus no.2 with DG connection, respectively (Table-1 and Table-2). Graphs of the reactive power profile with and without DG connection are shown in Fig. 3 and Fig. 4 respectively.
Simulation results of an IEEE-14 bus network with DG connection showed reactive power loss at generating station and reactive power loss at the load (Table-1).
Table-1: Reactive power at electricity generation and load with DG connection
Bus Q. gen (p.u) Q. load (p.u)
Bus 1 0.38329 0
Bus 2 6.5306 0.25445
Bus 3 0 0.38268
Bus 4 0 0.07814
Bus 5 0 0.03206
Bus 6 0 0.15027
Bus 7 0 0
Bus 8 0 0
Bus 9 0 0.27176
Bus 10 0 0.11621
Bus 11 0 0.03606
Bus 12 0 0.03206
Bus 13 0 0.11621
Bus 14 0 0.10018
The simulation result of an IEEE-14 bus network without DG connection showed the reactive power loss occurring at the generation station and at the load side (Table-2).
From the comparative analysis of the simulation results obtained optimal location for DG connection was found. It was shown that the preferred location for DG connection was bus no. 14 whereas DGs’ can also be connected at bus no. 12 and 13 as and when needed.
Table-2: Reactive power at electricity generation and load without DG connection
Bus Q. gen (p.u) Q. load (p.u)
Bus 1 0.3894 0
Bus 2 6.5577 0.25444
Bus 3 0 0.38267
Bus 4 0 0.07814
Bus 5 0 0.03206
Bus 6 0 0.15026
Bus 7 0 0
Bus 8 0 0
Bus 9 0 0.27224
Bus 10 0 0.1162
Bus 11 0 0.03606
Bus 12 0 0.03206
Bus 13 0 0.1162
The variation in the reactive power at generation with DG connection is shown in Fig. 3
Fig. 3 Reactive power at generation with DG connection
The graph shows the variation of reactive power at load w.r.t bus (Fig. 4).
Fig. 4 Reactive power at load with DG connection 0
0.05 0.1 0.15 0.2 0.25 0.3 0.35 0.4 0.45
1 3 5 7 9 11 13
R
e
ac
ti
v
e
p
o
w
e
r
(p
.u
.)
Bus
Reactive power at generation (p.u)
Reactive power
0 0.05 0.1 0.15 0.2 0.25 0.3 0.35 0.4 0.45
1 3 5 7 9 11 13
R
e
ac
ti
v
e
p
o
w
e
r
(p
.u
.)
Bus
Reactive power at load (p.u)
The graph shows the variation in the reactive power at generation without DG connection (Fig. 5).
Fig. 5 Reactive power at generation without DG connection
The graph shows the variation in the reactive power at load without DG connection (Fig. 6).
Fig. 6 Reactive power at load without DG connection
VI. CONCLUSION
On the basis of above analysis it has been concluded that a distributed generation has several advantages whereas on the other hand it disturbs the reactive power balance into the distribution network if not interfaced at the optimal location. It reflects that optimal location is the basic necessity for DG connection in order to minimize the losses. Simulation of an IEEE-14 bus network with and without DG connection had been studied and results were compared accordingly. It was observed that the bus no.9 showed an improvement in the reactive power loss at load from 0.27224 p.u. to 0.27176 p.u. whereas the bus no. 2 showed an improvement in reactive power loss at generation from 6.5577p.u. to 6.5306 p.u. with DG connection, respectively (Table-1 and Table-2).
0 0.1 0.2 0.3 0.4 0.5
1 3 5 7 9 11 13
R e ac ti v e p o w e r (p .u .) Bus
Reactive power at generation (p.u)
Reactive power 0 0.05 0.1 0.15 0.2 0.25 0.3 0.35 0.4 0.45
1 3 5 7 9 11 13
R e ac ti v e p o w e r (p .u .) Bus
Reactive power at load (p.u)
REFERENCES
[1] Caples Donal, Boljevic Sreto, and F. Conlon Michael, “Impact of Distributed Generation on Voltage Profile in 38kV Distribution System”, Proc. 8th International Conference on the European Energy Market, Zagreb, Croatia, pp. 532-536, 2011.
[2] Acharya Naresh, Mahat Pukar, and Mithulananthan N., “An analytical approach for DG allocation in primary distribution network”, ELSEVIER Electrical Power and Energy Syst., vol. 28, pp. 669-678, 2006.
[3] Rajaram S. P., Rajasekaran V., and Sivakumar V., “Optimal Placement of Distributed Generation for Voltage Stability Improvement and Loss Reduction in Distribu-tion Network”, International Journal of Innovative Research in Science Engineering and Technology, vol. 3, no. 3, pp.529-543, 2014.
[4] Pecas Lopes J. A., Hatziargyriou N., Mutale J., Djapic P., and Jenkins N., “Integrating Distributed Generation into electric power systems: A review of drivers, challenges and opportunities”, ELSEVIER Electric Power System Research, vol. 77, pp. 1189-1203, 2006.
[5] Banerjee Rangan, “Comparision of options for distributed generation in India”, ELSEVIER Energy Policy, vol. 34, pp. 101-111, 2004.
[6] El-Khattam Walid, Hegazy Y. G., and Salama M. M. A., “Investigating Distributed Generation Systems Performance Using Monte Carlo Simulation”, IEEE Transaction on Power System, vol. 21, no. 2, pp.524-532, 2006.
[7] Ackermann Thomas, Andersson Goran, and Soder Lennart, “Distributed Generation: a definition”, ELSEVIER Electric Power Systems Research, vol. 57, pp.195-204, 2000.
[8] Gandomkar M., and Shooshtary P., “A Genetic Based Tabu Search Algorithm to Distribution Network Expansion Planning with Distributed Generation”, IEEE 2011.
[9] Chiradeja Pathomthat, and Ramakumar R., “An Approach to Quantify the Technical Benefits of Distributed Generation”, IEEE Transaction on Energy Conversion, vol. 19, no. 4, pp. 764-773, 2004.
[10] Alhajri M. F., AlRashidi M. R., and El-Hawary M. E., “Hybrid Particle Swarm Optimization Approach for Optimal Distribution Generation Sizing and Allocation in Distribution Systems”, IEEE, pp. 1290-1293, 2007
BIOGRAPHY
Mr. Vaibhav Koshta is M.Tech scholar in Raipur Institute of Technology, Raipur, India. His current area of specialization is Power Electronics. He has completed his Bachelors degree from Chhattisgarh Swami Vivekanand Technical University, Raipur, India in 2011 from Electronics and Telecommunication branch of Engineering.