TECHNICAL EFFICIENCY OF TECHNICAL, VOCATIONAL AND ENTREPRENEURSHIP TRAINING INSTITUTIONS IN KENYA
PAUL WANJORA KARIUKI
C50/CE/1126112004
A RESEARCH PROJECT SUBMITTED TO- THE DEPARTMENT OF APPLIED ECONOMICS AS A REQUIREMENT IN PARTIAL FULFILLMENT FOR THE AWARD OF MASTER OF ARTS (ECONOMICS) DEGREE OF I"ENYATTA UNIVERSITY
DECLARA TION
This research is my original work and has not been presented for a degree award in any other university.
Signature ~ Date
?I
.
\
.
'
.
~
.
..
\
I.j
'
.
Paul Wanjora Kariuki
C50/CE11126112004
This project issubmitted with our approval as supervisors:
Signature .'~ Date
~t.
l.~JI.I
.
!
.
«:f
.
Dr. Dianah Muchai
Department of Econometrics and Statistics Kenyatta University
Dr. Aflonia Mbuthia
DEDICATION
ACKNOWLEDGEMENT
Life and its successes are only possible if the commodity health is in plentiful supply. 1 would like to thank the Lord almighty for providing good health which enabled me to invest in this masters program. I would like to express my profound gratitude to my supervisors, Dr Diana Ngui Muchai and Dr Aflonia Mbuthia, for their invaluable contribution to this work. Their understanding and generosity in keeping their door open all the time went a long way making this research possible.
r
would like to extend my gratitude to Dr. Gachanja, Dr.Muthoga, Mr. Mdoe and the entire staff in the School of Economics for the support they rendered during the proposal stage of this study. I would like to recognize my fellow postgraduate students in Economics for their constructive critique and recommendations for this study.Special thanks go to the management and staff of Mornbasa Technical and Training Institute and Kenya Institute of Management (KIM) for allowing me to use their library resources. Iwill eternally be indebted to you.
Finally, my special gratitude goes to my family for the sacrifice you made during my study. To my Lovely wife Anne, thank you for encouraging me to go on during those difficult and frustrating moments, your words provided motivation and inspiration to a discouraged heart.
TABLE OF CONTENTS
DECLARA TION ii
DEDICATION iii
ACKNOWLEDGEMEN1' iv
TABLE OF CONTEN1'S v
LIST OF TABLES vii
LIST OF FIGURES viii
ACCRONYMS AND ABBREVIATIONS ix
OPERATIONAL DEFINITION OF TERMS xi
ABSTRACT xii
CHAPTER ONE 1
INTRODUCTION 1
1.1 Background of the study I
1.1.1 Education and Training I
1.1.2 Vocational Education and Training in Kenya 5
1.1.3 Performance of TVET in Kenya 6
1.2 Statement of the Problem 8
1.3 Objectives of the study 9
1.4 Significance of the study 10
1.5 Scope and Limitation of the study 10
CHAPTER TWO 1t
LITERATURE REVIEW 11
2.1 Introduction 11
2.2 Theoretical Literature II
2.2.1 Production frontiers II
2.2.2 Production Possibility set and distance functions 12
2.2.3 Efficiency 13
2.2.4 Measurement of technical efficiency 14 2.2.5 Stochastic frontier function approach (SF A) 14
2.2.6 Data envelopment analysis (DEA) 15
2.3 Empirical Literature 18
2.4 Determinants of Efficiency 21
CHAPTER THREE 25
RESEARCH METI-IODOLOGY 25
3.0 Introduction 25
3.1 Research design 25
3.2 Theoretical Model 25
3.3 Empirical model 27
3.3.1DEA model 27
3.3.2 The Tobit model! efficiency Determinants model 30 3.6Definition and Measurement of the variables 31
3.7 Data Collection 32
CHAPTER FOUR 33
RESULTS AND DISCUSSION 33
4 2 D
..
S
.
.
'l'l. escnptrve tatistics ))
4.2.1 Inputs and Outputs 33
4.2.2 Efficiency Determinants 35
4.3Empirical Results 39
4.3.1 Efficiency Scores 39
4.3.2 Malmquist Analysis 41
4.3.3 Determinants of Technical Efficiency 43
CHAPTER FIVE 47
SUMMARY, CONCLUSION AND POLICY RECOMMENDATIONS 47
5.1 Introduction 47
5.2 Summary and Conclusion 47
5.3Policy Recommendations 48
5.4 Suggestion for further study 50
REFERENCES 51
LIST OF TABLES
Table 1.1 Budget allocations to TVET Subsector 3
Table 1.2 World Bank SDr Statics 4
Table 4.1 Descriptive statistics: Inputs and Outputs 34
Table 4.2 Location ofTVET : 35
Table 4.3 Boarding Facility and services offered by TVET 36
Table 4.4 Proportion of Engineering/Science in relation toArt-bases courses 37
Table 4.5 Flexibility of the mode of study 38
Table 4.6 Mean efficiency in the years 2009, 2010 and 2011 40
Table 4.7 Malmquist Index Summary of Annual means 42
Table 4.8 Correlation Matrix 43
LIST OF FIGURES
Figure 4.1 Teaching staff academic Qualifications 39
ACCRONYMS AND ABBREVIATIONS TVET DEA SFA DMU BCC CCR TTI IT YP CRS VRS IRS UNESCO
Technical, Vocational and Entrepreneurship Training
Data Envelopment Analysis
Stochastic Frontier Analysis
Decision Making Unit
Banker, Charnes, and Cooper model
Charnes, Cooper and Rhodes model
Technical Training Institutes
Institute of Technology
Youth Polytechnics
Constant Returns to Scale
Variable Returns to Scale
Increasing Returns to Scale
United Nation Education scientific and Cultural Organization
Kenya National Examination Council KNEC
JICA
CHE
FPE
EFA
Japan International Cooperation Agency
Commission for Higher Education
PU Production Unit
TFP Total Factor Productivity
SE Scale Efficiency
LP
Linear ProgrammingOPERATIONAL
DEFINITION OF T
E
RMS
Efficiency
School
measure of how well the schools are using inputs to produce output
test scores obtained by students at the end of education cycle marked by national examination
institutions offering all forms of' education at all levels ie primary, secondary and tertiary levels
resources required in schools so as to provide educational Performance
Inputs
services
ABSTRACT
CHAPTER ONE
INTRODUCTION
1.1 Background of the study
1.1.1 Education and Training
Globally it is recognized that political, social and economic growth of any country IS largely a result of the transformation of knowledge, science and technology into goods
and services (Tzeng, 2004). The role of education has also been emphasized in
contributing to the human resource development in todays globalizing context.
Empirical evidence, based on endogenous growth models, shows that human capital is a
key determinant of economic growth (Glewwe, 2002). Furthermore rapid technological
changes and globalization have made training of the workforce and especially post
-primary training is critical prerequisite in any nation that wishes to survive (Mureithi,
2008).
The demand of education for economic purposes due to the pressure of technological
progress and modernization has been constantly on the rise in most countries during the
21 st century (UNESCO, 2008). The link between the rate of technical progress and the
quality of human intervention has become increasingly evident as has the need for those
active in the economy to be trained to use the new technologies to innovate. New skills
are needed and educational institutions are required to meet the need by providing not
only the minimum of schooling or vocational training, but also training for scientists,
The role of Technical, Vocational education and Training (TV ET) as an effective means of empowering society to engage in productive and sustainable livelihoods cannot be
overemphasized. TVET plays an important role in supplying skills requisite for improved
workers' productivity, economic competitiveness, occupational integration, raising income levels
and expanding opportunities for employment (Budria and Telhado-Pereira, 2009). Statistics
suggests that there is high correlation between country's GDP and the percentage vocational education and training enrolment. For example, countries such as Australia,
Belgium and the UK , which have very high percentage s of technical and vocational
secondary school enrolment also have very high GDP per capita: whereas countries in
Africa like Eritrea, Malawi and Niger that have very low percentage
or
secondaryschool enrolment have correspondingly very low GDP per capita (UNESCO, 2008).
Generally, TVET in Africa has been left to the periphery and its significance has not
really been embraced. Palmer, (2007), observed that Sub-Saharan Africa has little room
for TVET at the post-primary school level. This fact partially explains why Africa lags
behind the rest of the world in technology. In Kenya, Nyerere (2009) observed that TVET is accorded limited importance in government and donor financing schemes. The funding
towards TVET considered ad hoc and arbitral, leading to year after year variations and
uncertainty (Mureithi, 2008; Ziderman, 2002).This has resulted to poor quality of training
due to lack of appropriate (qualitatively and quantitatively) tools and equipment
(Mureithi, 2008).Under investment in TVET sector is made worse by the emphasis
Table 1.1 Expenditure for Ministry of Education III TVET Sub-sector III Kenya Shillings (Millions)
2004/05 2005/06 2006/07 2007/08 2008/09 2009/10 201 Dill 2011/12
Development 4.19 185.00 72.00 1415.93 4795.00 2580.83 5097.80. 5158.70
1--- ----
-_
.._
-
~---.--Recurrent 1637.41 1291.00 2625.00 3382.36 5087.90 4175.42 2414.40 4756.60Total 1641.60 1436.00 2697.00 4798.29 9882.90 6756.25 7512.~0 C)C) 15.30
Source: Economic Survey, 2008a, 2010
A careful analysis of budgetary allocation for the Ministry of Education (MoE) in Table 1.1 reflects an erratic expenditure on TVET. The matter is made worse by the fact that a
huge share of the ministry's allocation goes to recurrent expenditure. Development
expenditure which would see acquisition of best technology and modern equipment for
teaching and learning is overlooked.
Itis evident that some developed and developing countries, such as Italy, Brazil, China, Sweden and Japan, fund TVET programs sufficiently and, as a result, primary and secondary students are
exposed to vocational training and to a culture of scientific investigation and application at an
early age (UNESCO, 2008). In Europe at least 50 per cent of the students in upper secondary
education pursue some form of technical or vocational education; in China, India and South East
Asia the figure is 35-40 per cent; however in Africa it is less than 20 per cent (in Kenya, the figure is two per cent) (African Union, 2007).
According to World Bank (2013), Service Delivery Indicators (SDI) for Kenya show that urgent improvements are needed in the quality of education in the country for this
economic opportunities and seek better jobs. The report shows a weak link between
resources and service delivery outcomes in Kenya education.
Table 1.2 Service Delivery Indicators (SDI) for Education in Kenya
PUBLIC PRIVATE RURAL
PUBLIC ---
---ALL URBAN
PU
BL
I
C
Teachers absence from 15.5% 16.4% 13.7% 17.2% 13.7% school
Teachers absence from 42.2% 47.3% 30.7% 48.8% 42.6% class
Time spent teaching 2h 2h 3h 28min 2h 37min 2h 13min
40min 19min
Teachers rmrurnum 39.4% 35.1% 49.1% 35.8% 32.9(% knowledge
Test score on English, 57.2% 56.2% 59.2% 54.4% 56.7% Maths, pedagogy
Students per textbook 3.1 3.5 2.2 3.8 2.5
Teaching equipment 95.0% 93.6% 98.2% 93.5% 93.7% availability
Infrastructure 58.8% 58.5% 59.3% 58.7(% 58.0(Yc)
availability
._--Source: World Bank, 2013
Table 1.2 reveals suboptimal management of human resources as reflected by the rate of
absence from school or classroom. Although in both private and public schools the
absence from school is roughly equal, about 50% in public school are less likely to be in
class teaching. Also a student in public school receives 1hour 9 minutes less than his
public teachers is competent. Kenya public schools do relatively well on the availability
ofinputs. Availability of text books exceeds the target of three books per student.
1.1.2 Vocational Education and Training in Kenya
Vocational education and training in Kenya is referred to as Technical, vocational, and
entrepreneurship training (TVET). It is a comprehensive term referring to pragmatically
important components of a national training system that entails those aspects of
educational process involving, in addition to general education, the study of technologies
and related sciences, and the acquisition of knowledge, practical skills, and attitudes
relating to occupations in various sectors of economic and social life (UNESCO, 2008).
The vocational education in can be traced back to colonial era when vocational and
technical courses were reserved for Africans in preparation for servitude. Post colonial
Kenya introduced a relevant vocational educational program to its primary and secondary
school students in order to equip them with vital skills and transform the vocational
courses' image (Mwiria, 2001). The education system which followed British 7-4-2-3
was changed to 8-4-4 system. Under 8-4-4 system, the curriculum was expanded to
include vocational and technical courses, with the aim of enhancing the transition of
secondary graduates into the world of work, as well as giving them opportunities for
further training in relevant post secondary institutions (M wiria,200 1). However between
2002 and 2005 vocational subjects were removed from regular primary and secondary
schools following a review of the curricular, only to be re introduced in 2007. Currently,
most secondary schools offer applied education subjects of agriculture, business, home
Alongside the 8-4-4 system, technical and vocational courses are offered in TVET institutions including; Youth Polytechnics (YP), Technical Training Institutes (TTls); Institutes of Technology (ITs), National Polytechnics and Technical UllIversltles.
I
here are also other institutions that offer TVET programs spread across government ministries as well as private institutions (R.o.K, 2008b). The country has 2 national polytechnics, 17 Institutes of Technology, I Technical Teachers' Training College and 21 Technical Training Institutes. In addition, there are over 600 youth polytechnics distributed throughout the country but only 350 of the youth polytechnics receive governmentassistance. The private sector operates close to 1,000 commercial colleges that offer courses in computers and non-technical areas of training (Kerre, 2010).
1.1.3 Performance of TVET inKenya
The TVET sub-sector in Kenya has experienced moderate growth over the last 40 years. The sub-sector continues to produce the needed middle level human resource for the national economy. The Vision 2030 has however placed special demands on TVET as the leading engine that the economy must essentially rely upon to produce adequate levels of middle level manpower that will be needed to drive the economy towards the attainment of the vision (R.o.K, 2012). The existing public TVET system in Kenya, however, suffers
from critical problems including the decline of quality; lack of relevance to occupational and social realities; under-enrolment; and under-funding (Johanson and Adams 2004). The lower quality can attributed to outdated equipment and low teachers' qualifications
budget and although this was improvement from previous years, the funds are still
inadequate (OEeD, 2008).
A study by Word Bank, (1996) revealed that there was inefficient mix of inputs such instructional materials and staff in Kenya education system. R.o.K (2005a) noted that
pursuit to internal efficiency in Kenya, education system required policy attention. As a
consequence the performance in national examination especially in practical and
engineering subjects was poor. The overall performance revealed that less than 1%
obtained distinction score and more than 30% recorded failures and referrals. This
translates to high levels of wastage in the system (Amuka, Olel and Gravenir, 2011).
In an effort to improve performance ofTVET sub sector, the government carne up with a
national TVET strategy in the year 2005 to revitalized TVET with the objective of
developing a national training strategy for TVET and ensure that the TVET institutions
are appropriately funded and equipped (R.o.K, 2005b). In this respect, Kenyan
government signed an agreement with Netherlands government to have eight technical
institutions rehabilitated, upgraded and equipped with modern equipments. Instructors
and trainers would undergo rigorous training in Netherlands to enhance their skills in the
use of new equipments (R.o.K, 2005b).
The government has committed itself to provide resources for scientific research, enhance
of technical capabilities of the workforce and raise of the qual ity of teaching science and
well-harmonized, flexible and demand driven TVET system 10 ensure that the graduates
contribute meaningfully to national development (R.o.K, 2007). In 2008 the government
spent Kenya shillings 3.4 billion on issues of transition from primary, development of
skills strategy and enhancement of leT within the TVET sector among others (R.o.K,
2010). Financial assistance and bursaries to the needy and female students undertaking
engineering courses was introduced to enhance enrolment in TVET programmes.
Regulatory framework was enhanced by the passing of TVET bill into law which will
ensure among other things establishment of TVET authority to oversee all operations of
TVET institutions (R.o.K, 2012).
1.2Statement of the Problem
Kenya's Vision 2030, makes particular reference to good education. This vision cannot
be a reality without skilled artisans, craftsmen, technicians and technologists. These
skilled personnel are drawn from the TVET sub-sector (R.o.K, 2007). A cursory look at
the national budget shows a fair volume of money already flowing into TVET. Taxpayers
in Kenya and donors have paid to build, renovate and equip public learning institutions
(R.o.K, 2012). Kenya has done relatively well on making textbooks, equipments, and
basic infrastructure available in learning facilities (World Bank, 2013). The report
however noted that the country is still far from achieving optimal performance by these
TVET institutions. As a result, there is a worrying gap between the money and materials
that go into learning facilities on the one hand and the results that emerge on the other.
The service delivery indicators show a weak link between resources and service delivery
outcomes. These service delivery failures translate to poor student performance. In 2008,
contributed a great deal to the poor curriculum delivery and the production of graduates who are insufficiently equipped for the labour market (R.o.K, 2008b). To correct this
situation, the government published the National TVET Strategy (R.o.K, 2008b), which identified four impact indicators of relevance, efficiency, effectiveness and sustainability that would be measured during monitoring and evaluation.
An earlier study by Word Bank, (1996) had revealed that there was inefficient mix of inputs such instructional materials and staff in Kenya education system. Despite the
several studies (for instance, Abagi and Odipo, 1997; Ngware, 2002; Nyerere, 2009) having looked into educational efficiency in Kenya, efficiency gaps are yet to be fully addressed. This study therefore is critical in the understanding of how best TVET inputs can be utilized to achieve the maximum output. The study seeks to answer the following
questions:
1. What is the technical efficiency level ofTVET institutions in Kenya?
11. What are the determinants of technical efficiency 111 TVET institutions 111 Kenya?
1.3 Objectives of the study
The general objective of this study is to investigate the technical efficiency of -rVET
education in Kenya. The specific objectives are;
1. To estimate Technical efficiency level of TVET institutions in Kenya.
1.4 Significance of the study
Kenya is among the countries that are geared towards Education for All (EFA). a process
that will lead to vastly increased numbers of young people completing primary and
secondary education in the coming years. Correspondingly, TVET institutions must
determine ways of increasing enrolments in their programmes. Understanding efficiency
and determinants of efficiency will allow TVET institutions to explore ways of making
better use their resources. This will also enable them reaching out to many identify causes
of inefficiencies that may hinder the realization of their mission. The study will yield
findings that can be used as examples of good practice for improving the attractiveness of
TVET institutions.
1.5 Scope and Limitation of the study
The study focused on technical efficiency of TVET institutions under the Ministry of
education. These include Technical training institutes (TTls) and institutes of technology
(ITs). These category of TVET has so many similarities and therefore easy to compare.
The Technical efficiency of these TVET was measured over the period 2009-2011. This
CHAPTER TWO
LITERATURE REVIEW
2.1 Introduction
This chapter reviews articles literature on efficiency. Specifically, this chapter presents a
review of theoretical literature, empirical literature, determinants of efficiency and
overview of literature.
2.2 Theoretical Literature
This section discusses the concept of production frontier, production possibility set,
distance functions, efficiency and its measurement.
2.2.1 Production frontiers
To illustrate the concept of production frontier, one can Llse an important class of
technologies having a single output y and an N-dimensional vector of input x. suppose
the production possibility set satisfies T(x, y) ~ O.A general representation of the frontier
technology is given as;
y
=
I(x) 2.1The function 1(.) is the production frontier and equation 2.1 gives the upper boundary of
T. Given input
x,
the maximum producible output y=
I(x) can be achieved. In the formof maximization, the production frontier is expressed by;
I(x)
=
max{y' :T(x,y'}~ 0 2.2The production frontier serves as the standard against which to measure technical
property of scale economies: constant returns to scale (CRS), decreasing returns to scale
(DRS) and increasing returns to scale (IRS).
A frontier exhibits CRS iff (tx) =tf(x)'\It>O; DRS iff (tx) <tf(x) vt>], and IRS if
f(tx)> tf(x)
vt
>1and an arbitrary input vector x (Coeli et aI, 2005).The assumption on scale is often required in production frontier estimation and efficiency
analysis, especially in non parametric frontier methods.
2.2.2 Production Possibility set and distance functions
To illustrate production possibility set suppose a producer uses a vector of inputs,
x
=
(xi' .... ,xn) E~
n
:
to produce non-negative vector of outputs, Y=
(YI ,....,Y,n) E9\';'The production possibility set of a production unit is a subset T of the space ~H1:1+11. A
firm may select any input-output configuration (x, y) ETas its production plan. The
production possibility set is the selection of all feasible input and output vectors. It is
represented as;
T - {(- y,x ). - d } IJ'111+11 2 -,
.xcanpro ucey c .1+ ...•...•....•... J
Furthermore, production possibility set can be represented by an input requirement set
L(y) or output producible set P(x) (Fare, Grosskopf and Lovell, 1994). The input
requirement set represents the collection of all input vectors x =(xi' ....,x,J E~l\':that
yields at least output vector Y =(YI ,.... , Ym) E 91:' . It can be represented as;
L(Y)={x: (x,y) is feasible} 2.4
The output producible set is the collection of all output vectors Y =(YI ,...., y",) E9\';' that
P(x)={y: (x,y) is feasible} 2.5
Equation 2.5 can also be defined as output distance function. The output distance
function is defined on the is defined on the output set, P(x) and is minimum scaling of
the outputs, 0, such that expanded output, y
16
remain a member of the output set P(x)as well technology set S i.e.
do(x,y)
=
min{O': (yl 0'EP(X)} 2.6Therefore if y E P(x), then do (x,y):::; 1and ify is on the upper boundary (frontier) of the
output set, thendo(x,y)
=
lThis is possible since P(x) is closed (Coeli et aI, 2005)On the other hand input distance function is defined on the input set L(y) and IS
maximum scaling of the inputs, p, such that contracted input,
(xl
p), remains a memberof the input set L(y) as well as technology set S i.e.
d,
=
(x,y)max{p: (xl p) EL(y) .Therefore, if xE L(y) then d,(x,y) ~ I; and ify is on the lower boundary (the frontier) of
the input set, then d,
=
(x,y) =1. This is possible since the set L(y) is closed (Coelli et aI,2005).
2.2.3 Efficiency
Productive efficiency has two components: technical (or physical) efficiency and
allocative (or price) efficiency. The purely technical, or physical, component refers to the
ability to avoid waste by producing as much output usage allows, or by using as little
input as output production allows. Thus, the analysis of technical efficiency can have an
output augmenting orientation or an input-conserving orientation. The allocative, or price
light of prevailing prices (Lovell, 1993). The absence of information on input pnces
makes the evaluation of allocative efficiency impossible. In this study therefore, only
technical efficiency will be estimated.
A firm with input output configuration (x, y) E T is efficient if there is no (x, y') ET for
(x',y') oj; (x,y) with x· ~ x and y' ::::y.
Farrel (1957 introduced a measure of technical efficiency defined by one minus the
maximum equiproportionate reduction in all inputs that still allows continued production
of outputs. A score of unity indicates technical efficiency because no equiproportionate
input reduction is feasible, and a score less than unity indicate technical inefficiency.
2.2.4 Measurement of technical efficiency
The two main approaches used are; the econometric methods such as Stochastic frontier
Analysis (SFA) and the non-parametric Data Envelopment Analysis (DEA) methods.
2.2.5 Stochastic frontier function approach (SFA)
SF A acknowledges the random noise around the estimated production frontier. In a
simple case of a single output and multiple inputs, the approach predicts the outputs from
inputs by the functional relationship;
y;
=
ft», (3)+
e
,
Where
i
denote the PU being evaluated and (3's are the parameters to be estimated. Theresidual [;; is composed by a random error Vi and an efficiency component
u..
Therandom error Vi is added to the non negative random variable Ui to provide the following
In(Yi) =xd]
+
v i-Uii
=
1,2, N 2.2Where i= 1,2, ...,N refers to the individual unit.
The random error Vi accounts for measurement error and other random factors together
with the combined effects ofunspecifted input variables in the production function.
The model is called the stochastic frontier production function because the output val ues
are bounded above by the stochastic (random variable), expressed as (xJi +Vi)' The
random error, Vi can be positive or negative and so the stochastic frontier outputs vary
about the deterministic part of the frontier model, expressed as (xJi) (Coelli et al, 1998).
The main disadvantage of this approach is the imposition of an explicit functional form
and distribution assumption of the error term. Therefore, stochastic frontier method IS
sensitive the parametric form chosen (Lewin and Lovell J990).
2.2.6 Data envelopment analysis (DEA)
Data Envelopment Analysis (DEA) is a linear programming technique for measuring
relative efficiency of a set of homogeneous decision-making units (DMUs) where the
presence of multiple inputs and outputs makes comparisons difficult (Charnes et aI,
1978). DEA uses the data from all DMUs to construct a "best production frontier" and
simultaneously calculates the distance to that frontier for the unit. DEA assesses the
performance of the DMU relative to the production frontier. Unlike SFA,
D
E
A
does nothave to assume a particular functional form making it less prone to misspeciftcation
DEA models can be input and output oriented and can be specified as constant returns to
scale (CRS) or variable returns to scale (VRS) (Banker, Charnes and Cooper, 1984).
Coeli et al (2005), states that the two orientations give similar results under CRS
assumptions but different results under VRS assumptions and the choice of orientation is
influenced by the characteristic of the DMU under study. An output-oriented DE/\ uses
the distance to the frontier as ameasure of efficiency
The DEA linear programming model used to measure the output- oriented technical
efficiency for each DMU is expressed as follows(Coeli et al ,2005);
s.t - y,
+
YA2::0H.»,
=
XA 2::0
,
Z
'
A
=1
,
A
2:: 0, 2.3where f) is a scalar that measures technical efficiency of the ith DMU: Y is P x n matrix
of output produced by the n DMUs; Yi is a P x 1quantities of output produced by DMU
i
;
X
is m x n matrix of m inputs used by the n DMUs, and Xi is the vector of theseinputs for DMU i. A is n x 1vector of the weights attached to the n DMUs Cor the
construction of the virtual comparison unit for DMU i. The unit sum of the weights (
Z'A
=
1) ensures the variable returns to scale condition, by folding a convex frontieraround the observations. Thus the output oriented DEA problem finds the maximum
input and output combination. The possible set of input and output combinations i.e. the
production possibility set, is given by all convex combinations of the observed input and
output values.
The efficiency of
n
DMUs is assessed by solvingn
LP models, in which the vectors Yiand x.are adopted each time for the DMU i considered. It is important to note that when
one has a few observations and many inputs and outputs most of the DMUs will appear
on the DEA frontier. That is to increase the technical efficiency scores an investigator
needs to reduce the sample size and increase the number of inputs and outputs (Zhang,
1998). Therefore, it is conventional that the minimum number of DMUs is greater than
three times the number of inputs plus outputs (Raab and Lichty, 2002).
To measure the change in efficiency score, the Malmquist index approach is used to
decompose the determinants of efficiency changes (Johnes, 2004). Equation (2.4) shows
the output-oriented Malmquist productivity index (Fare et ai, 1994):
1 D'+I (/+1 1+1) [DI (/+1 1+1 D' (' 1)]2 M (x'+\ 1+\ x' ')
=
0 x ,Y*
0 x ,Y*
0 x ,Yo ,Y, ,Y D~(XI,y') D~+\(XI+\,y'+\ D~+I(XI,y')
... 2.4
Where
Mo
is the Malmquist index,Do
the distance function, x represent input, y representoutput,
t
the period of benchmark technology,t
+
1the next period technology. Theratio outside the brackets measures the change in relative efficiency between year t and
t
+
1. The geometric mean of the ratios inside the brackets captures the shift intechnology between two periods analyzed at
x'
and xt+l. Mo represents the Malmquistproductivity index that measures the change over time of input- output mixes
Productivity growth is the geometric mean of the two output based Malmquist indices of
distance functions from period t to period t
+
1in
a given output(y) and input ex).According to Coeli,( 1996) five Malmquist indices can be derived: technical
efficiency(TE), technological change(TC), total factor productivity changc(TFP), pure
efficiency change(PE) and scale change(SE). TE and TC are components of TfP, while
PE and SE are components of TE.
2.3 Empirical Literature
Bradley et al, (1999) estimated technical efficiency schools in England. In the first stage,
DEA efficiencies were estimated, while in the second stage the efficiencies were
explained in a regression analysis. In the specification of the model two outputs i.e
examination grades and attendance rate were included. The inputs used were; the
proportion of pupils ineligible for free school meals and the proportion of qualified
teachers.
In
the tobit analysis, factors identified as having effects on school efficiencyincluded; type of school, proximity of school, composition of the school, local
environment of the school, resource variables, size of class. The study findings indicated
that there were efficiency differences among various schools in England. Resource
availability and the school environment had significant impact on school's performance.
Proximity of school and gender of the student were not statistically significant. The major
drawback was failure to specifically state the resource variables considered. The
aggregation of all resources into one may have resulted to misclassification problems.
The study also omitted number and quality of pupils which is considered to be very
important input in school and hence the efficiency score estimated excluding such an
Jeon and Shields (2003) measured efficiency of public education in Michigan. The inputs
included in the production function were; teacher to student ratio, the average teacher
salary, the foundation allowance per student, and the proportion of students not qualified
for free or subsidized school lunches. The outputs were; the graduation rate and the
results of a proficiency test for mathematics, science, reading and wri ting. Socio
-economic variables expected to affect school's efficiency were; value of housing,
household income and percentage of population living in urban areas. The results of the
analysis showed that most schools were fairly efficient but with big variations among
them. Socio-economic factors such as, household income and poverty levels were
positively related to educational efficiency. Variables such percentage of urban
population and housing value reduced the efficiency of school. Failure to include the
students as input variable as a major drawback of this study.
In the estimation of departmental efficiency in Greek university, Kounetas et of (2011),
used the total expenditures, the number of academic staff, the total number of
undergraduate students and the total number of postgraduate students as inputs in the
DEA model. On the other hand, three output dimensions used in the assessment of
production efficiency were: the number of conference papers and presentations, the
number of publications and the number of monographs and translations of a
book/chapter. Environmental variables deemed to influence efficiency score included:
departmental infrastructure, age of the department and behavior of school personnel.
The results showed high efficiency for the departments sampled. The second stage
influence on departmental efficiency. The main limitation of' this study was that it was
carried in the same university which could possibly be sharing certain resources making
it difficult to distinguish inputs and outputs of each department. It is also possible that is
interdepartmental influence which is not factored in the analysis. The results of the
analysis are not representative and hence may not be generalized for all universities.
In Kenya Abagi and Odipo, (1997) investigated efficiency in primary education. The
number of textbooks, teachers, and money and physical resources were inputs considered
in this study. Completion rates and dropout rates were taken as outputs. The study found
out that education in Kenya faces the problem of inefficiency. The study also indicated
that teaching-learning time was not utilized efficiently in primary schools. The factors
behind such inefficiencies included: education policies and management processes, mis
-allocation of resources to educational levels; school based factors - teachers attitudes.
time utilization, school environment; and household based factors -poverty, socio-cultural
factors, and gender issues. The study used descriptive statistics in the analysis of data.
However, they did not use any econometric analysis to show the extent of relationship
between output and input or even the degree of influence of factors that impact on
efficiency of the school. Statistical tests to support the findings were also missing.
Ngware (2002) investigated internal efficiency of seven institutes of technology (IT) in
Kenya. Variables of interest in this study were; students population, physical facilities,
teaching and non-teaching staff. The attractiveness of each institute was determined and
The major limitation of the study is use of very small sample which may result to
statistical bias and misleading findings.
Kiveu and Mayio (2008) investigated the impact of cost sharing on the internal efficiency
of public secondary schools in Bungoma district, Kenya. The study used repetition rate
and graduation rates as indicators of internal efficiency. The direct costs. facilities
utilization and class attendance by teachers were factors considered to impact on school
performance. The direct costs were found to have negative impacts on internal efficiency
of schools. Underutilization of facilities and teachers absenteeism was found to have
negative impact on performance. The direct costs were found to have negative impacts on
internal efficiency of schools. The assumption that cost of education is the only major
determinant of schools performance is not valid. From several other studies it is clear that
there are quite a number of factors that interact to influence school's performance.
2.4 Determinants of Efficiency
According to Denaux, (2009), several factors may impact the efficiency of a school.
These factors are neither inputs nor outputs in the education process. but rather
circumstances faced by a particular school. Variables found to impact school efficiency
scores, included; educational policy, community environment. and school characteristics.
Public high schools were also distinguished by location (rural or urban). The study found
out that rural schools were less efficient than urban schools. In the second stage of
analysis parents' education, the race of residents and eligibility to scholarships had
significant influence in academic achievements. Government spending per pupil and
Other studies about the determinants of educational outcomes are structured by
distinguishing between student variables and school variables (Mancebonet et al., 2010,
Mizala, 2002, Kim et al., 2(06). At the student level, gender; household socio-cultural
and socioeconomic characteristics are strong determinants of educational outcome. The
other set of variables at the student level concerns household resources and how students
use them (Kang, 2007; Woessman, 20(3). At the school level, general school
characteristics such as; ownership type (private or public), physical and human resources
are strong determinants of school efficiency. Portela and Camanho (2007) used three
groups of variables: characteristics of pupils (prior attainment, social-economic
characteristics); characteristics of the school (number of teaching and non-teaching staff,
expenditure per pupil, size of school, or class size); characteristics of teachers (their
salary, experience, or level of education). Duncombe et al. (1997) concluded efficiency is
negatively related to school district size, percent tenured teachers, district wealth,
non-residential property values and labour intensity, and positively related to the percent of
adults who are college educated.
2.5 Overview of literature
The review of literature indicates that educational efficiency can be evaluated using either
parametric (SF A) or non parametric (DEA) approaches. However most a researcher uses
DEA technique in the estimation of educational efficiency. DEA has several strengths
over SF A techniques such as; no need to explicitly specify a mathematical Cormfor the
production function, handling multiple inputs and outputs, capable of being used with any
for every evaluated unit. This study will adopt the DEA approach due to the
aforementioned strengths.
Most of the studies reviewed estimated TE using a two-stage process. In the first stage
level of efficiency/inefficiency is measured using a normal production function. In the
second stage socio-economic characteristics that determine levels of technical efficiency
are analyzed using a probit or tobit model. The choice of the output is pretty
homogenous, and the vast majority of studies used tests scores (Chakraborty, 2009,
Mancebonet et al. 2010, Rassouli, et al., 2007). Other researchers (Bradley e/ al, 1999;
Jeon and Shields, 2003; Kounetas et al 2011) considered graduation rate. Other output
dimensions included are: number of conference papers and presentations, publications,
monographs and translations of a book/chapter (Johnes and Johnes, 1993. 1995; Madden
et al., 1997).
In
this study student completion rates and examination pass rate will betaken as output.
Most studies reviewed (for instance, Athanassopoulos and Shale, 1997 ; Johnes, 2006;
Jeon and Shields 2003; Portela and Camanho 2007) used totai expenditures, the number
of academic staff, number of students ,capital equipments, school size and number of non
teaching staff as inputs in the DEA model. Other non discretionary factors identified to
have an impact on educational efficiency includes; educational policy, community
environment and school characteristics (Denaux et al, 2009). Students gender, social
cultural and socio economic characteristics, family size, parental education were
There are quite a number of studies on education efficiency especially in USA and
Europe. However in Kenya there are only a few studies on this subject and mainly for
primary and secondary schools. The said studies have mainly concentrated on internal
efficiency of schools which are descriptive and without employing either parametric or
non parametric measures. To the best of my knowledge there is no empirical study on the
measurement of technical efficiency of educational institutions, specifically TVET using
CHAPTER THREE
RESEARCH METHODOLOGY
3.0 Introduction
This chapter presents theoretical framework, empirical model and describes the research
design in the study. Hypotheses of the study meaning of variables used are described. The
data, data sources and methods used for data analysis are explained.
3.1 Research design
The study adopted a survey research technique. Yin (2006) argues in favour of the use of
surveys in educational fact-finding because they provide a great deal of accurate
information. The intention of survey research was to gather data at a particular point in
time and to use it to describe existing conditions. To obtain high accuracy, all the forty
(40) public TVET institution under the Ministry of education were considered in the
study. These TVET institutions have so many things in common and therefore can
provide a more realistic comparison.
3.2 Theoretical Model
Suppose a firm uses a N dimensional vector of non negative real input x, to produce an M
dimensional output vector y. The production possibilities can be represented by
technology set:
S
=
[ex, y): xcan produce
y} 3.1The set consist of all input output vectors such that x can produce y. From 3.1 the output
P(x)
=
{y: x can produce y}=
{y: (x, y) eS}. 3.2To know how the firm was efficient in the production process, the output distance function is used. It is defined as the maximum scaling ~ (6l) such that () defines the
5
amount by which output could have been expanded given the inputs, if technology for a certain period had been fully utilized i.e.
Do(x,y)
=
min {o: (yjo) € P(x)} 3.3a or[Do (x, y) ] - 1
=
max {6l: (By) to: P(x)} 3.3bSuppose technical variation of a certain DMU is measured from period t to t
+
1with associate input output vectors (xt ,yt) and (xt+l, yt+l). The output oriented periodt
Malmquist index (m~) defined as a ratio of technical inefficiency in period t will be given by:
M~(YI ,YI+l' x, ,X'+l)
=
D~~Y'+I' X'+l) 3.4Do(Y, ,x,)
and D~+I (y" XI) are needed. To obtain TFP change the Malmquist index obtained in
equation 3.6 is decomposed into efficiency change and technical change. Since most
distance functions are less than one( there is technical inefficiency) equation 3.6 is
equivalent to:
1 DI+I (/+1 1+1) [DI (1+1 1+1 D' (' 1):2 M (XI+I 1+1 x' I)
=
0 X ,y*
0 X ,y*
0 X ,yo ,y" y D' (I I) DI+I (/+1 1+1 D/+I (,I I)
() X ,y 0 x ,Y 0 .x ,Y
... 3.7
The first ratio in equation 3.7 represents technical efficiency change from period t to t
+
1 whereas the one in the parenthesis represents the technical change from period
t
tot
+
1. Therefore, from the decomposition efficiency and technical change are given by:
Efficiency change
=
D~+I(YI+i'XI+I) 3.8D~(y"x,)
3.3.1DEA model
In
this study, it was hypothesized that each TVET institution maximizes outputs given theand Bandres, 1999). TE was measured using two outputs (Yl and Yz) and three inputs (Xl'
X
z,
X3 andx
4) The outputs considered here were; graduation rate and examination passrate. The inputs considered were; students enrolled number of teaching starr. number of
non teaching staff and physical facility index. Therefore, equation 3.6, 3.8 and 3.9
became:
[ D~+I(Y:~~I' Y21+1' XII+I, X21+1, X31+1, X41+1)
*
D~ (YII' Y21' XII' XlI' X]IX41)] 3.10 Do (YII' Y21' XII' x21 ,x31' x41) Do(YIt, Y21' XII' x21' X]I' X'IIWhere
YII+I' YII -number of graduates in period t
+
1andt
Y21+1'Y21-average national examination pass rate in period t I and t
XII+I,XII -number of student enrolled in period
t
+
1andt
X21+1' x21 -number of teaching staff in period
t
+
1
andt
X31+i' x31 -number of non teaching staff in period
t
+
1andt
X41+1' x41-physical facilities index
The index obtained in 3.10 was decomposed into technical efficiency changc(T. E) and
technological change (T.C) to obtain sources of TFP change using the following
equation:
TE
=
D~+I(YII~i'Y21+i'XII+I,X21+i'X31+I,X41+1) 3.11 D~+ (YII' Y21,XII' X21,x31'x41)To estimate them, the following DEA linear programming problems were solved.
D~[(xJ/+J' x21+J' x31+J' x41+J' YJI+J' Y2I+J)
J
-
J
=
maxeJc () .•..• 0••••••••• 000.0. 0••• 00": 0o. 0•• 3.13sot.
n A is 40x1vector of ones
Y1 - Number of graduates in TVET
i
in period t+
1(f+ 1),
Y _ Standard examinations pass rate in TVET i in period t
+
1 2 (t+I)1XJ(I+I)I - Number of students enrolled in TVET i in period t
+
1X2(/+I)i - Number of teaching staff in TVET i inperiod t
+
1X3(1+I)i - Number of non teaching staff in TVET i in period
t
+
1X4(1+I)i - Physical facility index of TVET i in period t
+
1To know the number of LPs to calculate, it was assumed that there were T time periods
and I firms, then applying the formula I (3T - 2). In this case 40(3
*
3 - 2) == 280 LPmodels were solved.
Each LP produced a 8 and a A vector. The 8 parameter provided information on the
technical efficiency score for the ith firm and the A vector provided information on the
peers of the (inefficient) ith firm. The peers of the ith firm were those efficient firms that
defined the facet of the frontier against which the (inefficient) ith firm was projected.
3.3.2 The Tobit model/ efficiency Determinants model
In the second stage, efficiency scores were related to factors seen to influence efficiency
using Tobit regression of the form;
Yi =xi!3+e, 3.14
Where Yi is the DEA efficiency score, Xi determinants of efficiency, !3 is vector of
parameters to be estimated, e, is the error term.
Therefore to analyze the influence of factors influencing efficiency in TVET institutions,
the efficiency score (EFF) were regressed on factors hypothesized to impact on technical
efficiency. These include location of TVET institution (RURB), provision of boarding
facility and services (BOFS), flexibility in training (FLEX), proportion of
engineering/technology courses offered (CENTEX) and percentage of teachers with
advanced degree (AD)
EFFi
=
ao +a1RURBi+
azBOFSi+
a3CENTEXi+
asFLEXi+
a6ADi+ei 3.1 5
Where EFFi is efficiency score TVET i, RURBi is location of TVET i , CENTEXi is
TVET i,
FL
E
X
i represents flexibility of the mode of training by TVET i, and ei is theerror term
3.6Definition and Measurement of the variables
The following variables were used in this study.
Outputs:
Y
l
-
number of graduates per yearY
r
national examination pass rate for a particular TVET in each yearInputs:
xl-Number of students enrolled for all programmes each year
Xz- teaching staff in each TVET during the period of study
x3-non teaching staff employed by each TVET
x
4-Physical facility index composed of three indicators i.e number of books per student,number of computers per student and number of other facilities per student. Each indicator was equated to 1 if the given facility was greater than corresponding average
level. The physical facility index was then computed as the sum of the three indicators.
Determinants of efficiency
R
U
RB-
location of the TVET (rural or urban). A dummy 1 if"TVET was in urban area,otherwise O.It was assumed that a TVET in urban area was better in terms of teachers and
facilities
BOFS-boarding facility provided by TVET institution i.e. bed and meals. A score of I
was assigned to each service offered by the TVET. It was hypothesized that these
CENTEX- whether TVET was a center of excellence in engineenng and technology
courses or Art-based courses. The main aim of TVET is to offer engineering/technology
courses although other courses also are offered together. This was calculated by dividing
the engineering and science based courses and the total number of courses offered by the
institute.
FLEX-flexibility of courses was indicated by courses being offered in full time, fulltime
and part time and fulltime, part time sandwich basis. A score of I was assigned for each
mode; total was achieved by adding up the scores, with highest score equal to 3.
AD- percentage of teachers with a master's degree and above qualifications
3.7 Data Collection
Data was collected using questionnaires which were filled in by principals of 36 public
period after major reforms in the TVET sector were implemented.
3.8 Data Analysis
Data obtained was arranged to fit data envelopment analysis programme(DEAP) which
estimated the efficiency score of each TVET institution. The scores obtained were further
regressed against the determinants of efficiency to help explain what factors actually
determines TE of TVET. The Tobit model was estimated by MLE assuming normality of
CHAPTER FOUR
RESULTS AND DISCUSSION
4.1 Introduction
This chapter presents the findings of the study. Technical efficiency of TVET institution
was estimated using DEA. In the second stage determinants of technical efficiency were
evaluated using Tobit model. The chapter starts by presenting and discussing descriptive
statistics. All results from DEA and Tobit model are then discussed.
4.2 Descriptive Statistics
4.2.1 Inputs and Outputs
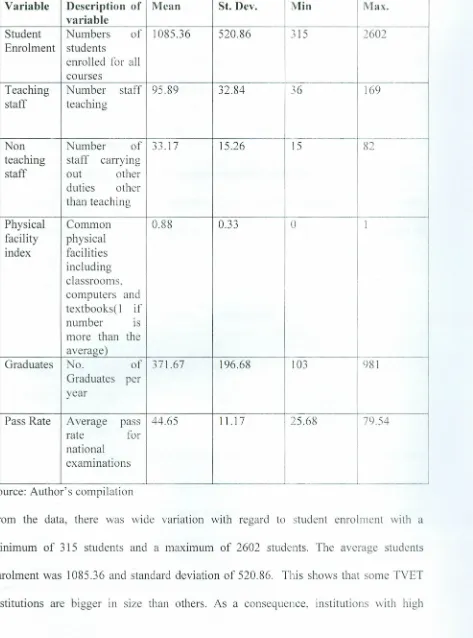
Table 4.1 present the summary statistics of the inputs and outputs. The number of TVET
institutions analyzed was 36 over a period of three years which gives a total of 108
observations. Four (4) TVET institutions did not respond even after the first and the
second follow up. The study respected the DEA convention that the minimum number of
Table 4.1: Descriptive Statistics
Variable Description of Mean St. Dev. Min Max. variable
Student Numbers of 1085.36 520.86 315 2602
Enrolment students
enrolled for all courses
Teaching Number staff 95.89 32.84 36 169
staff teaching
Non Number of 33.17 15.26 15 82
teaching staff carrying
staff out other
duties other than teaching
Physical Common 0.88 0.33 0 1 I
facility physical
I
index facilities including classrooms. computers and textbooks( 1 if number IS more than the average)
Graduates No. of 371.67 196.68 103 981 Graduates per
year
Pass Rate Average pass 44.65 11.17 25.68 79.54
rate for
national examinations
Source: Author's compilation
From the data, there was wide variation with regard to student enrolment with a
mmimum of 315 students and a rnaximum of 2602 students. The average students
enrolment was 1085.36 and standard deviation of 520.86. This shows that some TVET
enrolment have high rate of graduation. The difference between minimum and maximum graduation rate support the fact. This was also noted for teaching and non teaching staff. Average pass rate also varies among the institutions with a minimum of 25.68 and a
maximum of 79.54 per cent, a mean of 44.64 and a standard deviation of 11.16. The
average pass rate was below 50 per cent and could negatively affect the graduation rate.
4.2.2 Efficiency Determinants
The determinants of TE in TVET institutions identified were: location of the institution,
boarding facilities provided by the institution, flexibility of the mode of study, proportion of engineering/science courses relative to art based courses, and the qualification of teaching staff.
Table 4.2 Location of TVET institutions
Location No. of institutions Percentage
Rural 22 61
Urban 14 39
Total 36 100
Source; Author's compilation
From table 4.2, it was found out that 61% of TVET institutions were located in the rural
areas and 39% in urban areas. The high concentration of TVET institutions in the rural
areas was an attempt to distribute these learning institutions throughout the country.
In terms of boarding facility and services provided by each TVET institution, table 4.3
shows the various services offered by TVET institutions.
Table 4.3: Boarding Facility and Services offered by TVET
Boarding Facility No. of TVET institutiO~ Percentage
I
and Services offered
I
IBed alone 12 ...),...,)...),
Bed and meals 24 66.7
No Boarding 0 0
~
o
o
.
-Total 36
Source; Author's compilation
The analysis of the boarding facilities and services offered by the TVET institutions
revealed that all the institutions studied were offering these services but had limited
capacity. The institutions reported that they were unable to accommodate all students
studying in the institutions due to the limited capacity. 66.7% of TVET institutions
studied were offering both bed and meals. The remaining 33.3% were only offering bed
only without meals and the students were expected to buy or prepare meals on their own.
The proportion of engineering/science courses in relation to art based courses calculated
by comparing the number of engineering/science courses with art based course was
presented in table 4.4. The table shows the number of TVET institutions with greater
Table 4.4 Proportion of Engineering/Science in relation to Art-based Courses
Proportion of courses offered No. of institutions Percentage
- ---
-Engineering/Science> Arts 19 52.8
Arts> Engineering/Science 17 47.2
_._--
---Total 36 100
Source; Author's compilation
From Table 4.4, it was reported that 52.8% were offering more courses in mechanical
engineering, electrical engineering, automotive engineering, building & civi Iengineering,
information & communication technology and health& applied sciences than in business
studies, hospitality and liberal studies. The training in TVET was seen as vehicle to
develop the needed artisans, technicians and technologists for the country. Therefore, the
TVET institutions are expected to offer more of engineering, technology and science
courses, if they are realize their mandate. The study revealed that 47.2(Yo were
concentrating on art based courses more than engineering/ science based courses. This
could be due to the fact that they require little investment in capital and equipments.
Flexibility of the mode of study was measured by the different ways in which the TVET
institution could offer their course. It was revealed that, TVET course were offered in
three different modes; Full time (regular), Evening& Weekend (Part-time) and School
Tab Ie4.5 Flexibility of the Mode of study
Mode ofstudy No. of institutions Percentage
Full time only 18 50
Full time &Evening 16 44
---
-Full time, Evening& school 02 6
based
Total
36
100I
Source; Author's compilation
Table 4.5, revealed that half of the TVET institutions offered their courses on regular of
full time mode only. Another 44% of the institutions taught the TVET courses by using
both full time and evening modes. Only 6% of the institutions were found offering the
TVET courses by using the entire three modes i.e. full time, evening and school based
modes of study.
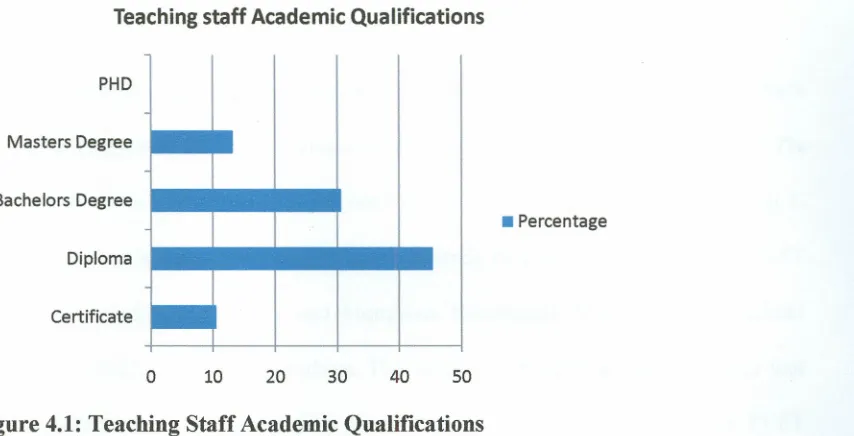
The teaching staffs in TVET institutions were found to be holding different qualifications
including; certificate, diploma, bachelors degree, masters degree and doctor of
Teaching staff Academic Qualifications
PHD
• Percentage Masters Degree
Bachelors Degree
Diploma
Certificate
o
10 20 30 40 50Figure 4.1: Teaching Staff Academic Qualifications
Source; Author
Figure 4.1, reveals that the qualification of teaching staff in TVET institutions were quite
low. The study revealed that 10.6% of the teaching staffs were certificate holders, 45.4%
were diploma holders and 30.7% had first degree qualifications. Only 13.3% of the
teaching staff had master degree qualifications. The study further found out that only two
teaching staff in TVET had doctorate qualifications. A high proportion of tutors with
diploma qualifications teaching diploma courses are likely to affect a TVET's
performance hence its efficiency.
4.3 Empirical Results
4.3.1 Efficiency Scores
The results show that on average the overall industry efficiency was high at 79.4 %inthe
years 2009, 2010 and 2011, denoting that most TVET institutions used inputs efficiently
to produce output. This means that only 20.6% of TVET institutions in Kenya were
inefficient during the study period. The TVET sub-sector thus had on average 20.4 %
resources. The findings were broadly in accordance with Abott and Doucouliagos (2003) who examined technical efficiency of polytechnics in New Zealand
In terms of technical efficiency, there was a wide dispersal of results, indicating that there was scope for improving TE. The average mean efficiency ranged from 0.51 to 1. 91.70/0
of TVET institutions had an efficiency score of over 0.5 with 8.3% of TVET scoring I,
hence identified as the best practice. For the entire study period, the three efficient TVET institutions included; Bumbe, NEP and Mombasa. Bushiagala, Mathenge and Michuki were the least efficient TVET institutions. The presence of inefficiencies indicated that the TVET institutions had excess inputs or insufficient inputs compared to those TVET on the efficient frontier. Nairobi was efficient in 2009 but th is declined in 2010 only to
emerge efficient again in 2011. Other institutions that recorded a score of 1 in some but not in all periods includes were; Kaiboi, Gusii, Moi, Nyandarua, Rift Valley, Kisumu,
Kabete, Kisiwa and Friends College. Masaai and Mathenge recorded an efficiency score of less than 0.5 in 2009 and 2010 respectively. The findings were consistent with Abbot& Doucouliagos (2003), with individual polytechnics registering mixed efficiency scores in their study.
Table 4.6: Mean efficiency in years 2009, 2010 and 2011
Year 2009 2010 2011
TE 0.753 0.787 0.840
~Average----~TE I
0.7~~ .
I
0.86 0.84 > 0.82 u c 0.8 C1I
·u
0.78a:
w 0.76c 1'0 0.74 C1I
:E
0.72 0.7 ..•.. ~ ~ .-K" ~••••• ~Efficiency
Efficiency
2009 2010 2011
Figure 4.2: Technical Efficiency Means over time Source: Author
Efficiency distribution over time summarized by table 4.3 and figure 4.1 indicated that
the overall efficiency was 0.794. Mean efficiency TVET institutions was found to
increase marginally for study period 2009, 2010 and 2010 with mean efficiencies of
0.753, 0.787, and 0.840 respectively. The findings are consistent with study by
Chakraborty & Poggio (2008) in which Kansas schools mean efficiency increased
marginally over a three years' study period.
4.3.2 Malmquist Analysis
The score for total productivity change (TFT) was less than one for most of TVET
institutions, with the exception of twelve, showing that a large proportion of the TVET
institutions experienced losses in total productivity in the period considered. The mean
TFT of 0.965 implies that there was a fall in total factor productivity of about 3.5 per cent
over the period 2009 to 2011. This was despite the fact that technical progress was
about 8.4 percent over the period. This seems to concur with general performance of
TVET institutions in Kenya, (Amuka, Olel and Gravenir, 2011).
Table 4.7: Malmquist Index Summary of Annual Means
Year Efficiency Technology Pure Scale Total f change change technical efficiency produc
efficiency change change
change
2 0.815 1.058 0.917 0.889 0.863
3 1.030 1.058 1.002 1.027 1.079
mean 0.916 1.053 0.959 0.956 0.969
-
-actor
l
tivity
_
~
l
_
Source: DEAP output
The change in the technical efficiency score defined, as the diffusion of best-practice
technology in the management of the TVET institutions is attributed to investment
planning, technical expenence, and management and organization Il1 the TVET
institutions. For the period under analysis, we can see that it is less than one for 67(% of
all the TVET institutions. The breakdown of the change in technical efficiency into pure
technical efficiency change and scale efficiency change shows mixed results, with some
TVET institutions obtaining simultaneous gains in both areas and others obtaining gains
in one but losses in the other. The decline in pure technical efficiency, which means
deterioration in managerial skills, shows that there was probably no investment in
organizational factors associated with the management of the TVET institutions, such as
best-practice initiatives, an improvement in quality and so on. The findings support the
study by Muriithi,(2008) who noted that the quality of teaching, teaching equi pments and
graduates of TVET was declining. The scale efficiency decreases on average in the