MATLAB Based GUI for Arrhythmia
Detection Using Wavelet Transform
P. Keerthi Priya1*, Dr.G.Umamaheswara Reddy 2
PG Student [CS], Dept. of ECE, SVU College of Engineering, Tirupathi, Andhra Pradesh, India1
Associate professor, Dept. of ECE, SVU College of Engineering, Tirupathi, Andhra Pradesh, India2
Co-responding author
ABSTRACT: Cardiac arrhythmia indicates abnormal electrical activity of heart can be threat to human, so it has to be automatically identified for clinical diagnosis and treatment. This paper presents efficient and flexible software tool based on Matlab GUI to analyse ECG, extract features using Discrete Wavelet transform and by comparing them with normal ECG classify arrhythmia type. Proposed software tool is tested for multiple databases like MIT-BIH and Creighton University arrhythmia databases. Performance of software is tested with total of nineteen long length ECG samples, arrhythmias detected are Tachycardia, Bradycardia, Ventricular Tachycardia, Asystole, First degree heart block, and Second degree heart block from the results obtained algorithm has sensitivity of 94.12%, positive predictive of 88.9% and accuracy of 86.61%.the software tool along with detecting arrhythmia, helps in analysing ECG by provides different parameters of ECG like sampling frequency, PR, RR interval and QRS width.
KEYWORDS: Electrocardiogram (ECG), Matlab GUI, wavelet transform, heart disorders, Features
I.INTRODUCTION
An Electrocardiogram (ECG or EKG) is a register of the heart’s electrical activity. The frequency range of ECG is from (0.1-150) Hz. It is widely used routine for cardiac diagnostic tool. A typical ECG tracing of normal heart beat consists of a P wave, a QRS complex, a T wave and a U wave which is shown in fig1. Successive repetition of these “PQRST” in monotony forms ECG. The characteristics of normal heart rhythm also called Normal Sinus Rhythm (NSR) are listed in table1, any disorder in these parameters results in a pathological condition called Arrhythmia or dysrhythmia Three common types of arrhythmias are supraventricular arrhythmia, ventricular arrhythmia and Bradyarrhythmias. Supraventricular arrhythmia are tachycardia (fast heart rates) types include atrial fibrillation, atrial flutter, paroxysmal supraventricular tachycardia (PSVT) and Wolff-Parkinson-white (WPW) syndrome. Ventricular arrhythmia include ventricular tachycardia and ventricular fibrillation .Bradyarrhythmia occurs because of slower heart rate. ECG signal being non-stationary it’s difficult to
visually analyse and may take lot of time, hence we need computer based methods for its analysis.
like artificial neural networks, Support Vector Machine, Hidden Markova models. In this paper we’ll develop simple and accurate algorithm using Discrete Wavelet transform (DWT).Wavelets can provide a time versus frequency representation of the signal and work well on non-stationary data.
II. LITERATURE SURVEY
Recently several research algorithms have been developed for arrhythmia detection in ECG signals some of them are using wavelet transform, Fuzzy logic Methods, Support Vector Machines with approach exhibiting its own advantages and disadvantages. S.Z Mohmoodabadi[3] used db4,db6 daubechies wavelet for extracting features from ECG signal this algorithm achieves positive predictivity of 98% and sensitivity of 99% . But this method can detect only peaks of ECG, failed to classify diseases in it. Jayalaxmi C M [6] developed Graphical User Interface that it can detect heart rate and various intervals of ECG signal. This algorithm can detect only what ECG parameters have abnormality but not classify them accordingly. Mujeeb Rahman [2] implemented traditional approach for extracting QRS complex in ECG which has differential filter followed by squaring filter. Disadvantage is that we need to have separate analog, digital denoising filters, lack of which causes severe reduction in accuracy of algorithm.
II. MATERIALS AND METHODOLOGY
(A). Data acquisition: ECG samples are taken not only from MIT-BIH but also from Creighton University arrhythmia databases. MIT-BIH signals have sampling frequency of 360hz.All ECG samples are of standard Lead II. Matlab software is used for computer programming
(B). Algorithm Description: Figure 2 shows the block diagram of our algorithm. Our algorithm mainly involves 3 steps .those are Pre-processing, feature extraction and classification.
(i)Pre-processing: ECG data was first normalized to unit maximum amplitude and DC offset is removed. Figure 3 shows normal ECG, this signal is normalized and dc removed. After that wavelet transform is applied
Wavelet transform: For extracting parameters of ECG we use wavelet transform, wavelet analysis breaks a signal down into its constituent parts for analysis. Mother wavelet transform we use here is Daubechies of D6 family if a signal is not well represented by one member of the Db family, it may still be efficiently represented by another. Daubechies wavelet family has similar shape to QRS complex and their energy spectrum is concentrated around low frequencies The wavelet transform is a convolution of the wavelet function ψ (t) with the signal x (t). Orthonormal dyadic discrete wavelets are associated with scaling functions ϕ (t).
The scaling function can be convolved with the signal to produce approximation coefficients. The discrete wavelet transform (DWT) can be written as:
Tm,n =∫x(t)ψ m,n (t)dt---(1)
By choosing an orthonormal wavelet basis, ψm,n (t) , and we can reconstruct the original. The approximation coefficient
of the signal at the scale m and location n can be presented by S m,n =∫ x(t)ϕ m,n (t)dt ---(2)
In practice our discrete input signal S0, n is of finite length N, which is an integer power of 2: N = 2M .Thus the range of
scales that can be investigated is 0 < m < M. A discrete approximation of the signal can be shown as X0(t) =XM (t) +∑ dm (t) --- (3)
Where the mean signal approximation at scale M is XM (t) = ∑ S M, n ϕ m, n (t) --- (4)
Fig (2). Block diagram of algorithm
dm (t) =∑ Tm, n(t)ψm,n(t)---(5)
Adding the approximation of the signal at scale index M to the sum of all detail signal components across scales gives the approximation of the original signal at scale index 0. The signal approximation at a specific scale was a combination of the approximation and detail at the next lower scale.
Xm (t) = Xm-1(t) -dm (t) --- (6)
If scale m = 3 was chosen, it can be shown that the signal approximation is given by X3(t) = X0 (t) -d1 (t) -d2 (t) -d 3(t) --- (7)
1200 1400 1600 1800 2000 2200 -1
-0.5 0 0.5 1 1.5
Fig (3).Input ECG signal
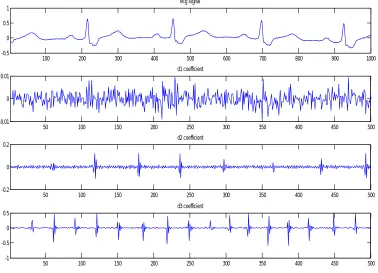
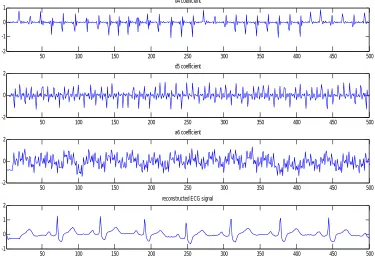
Input ECG signal is decomposed in to approximate and detailed coefficients. Figure (4), (5) gives all detailed and needed approximate coefficients of input ECG signal. Of all those only d3, d4, d5, a6 coefficients are used to reconstruct ECG signal. Now reconstructed signal is used for further processing .ECG signal was de-noised by removing wavelet coefficients at higher scales.
100 200 300 400 500 600 700 800 900 1000
-0.5 0 0.5 1
ecg signal
50 100 150 200 250 300 350 400 450 500
-0.01 0 0.01
d1 coefficient
50 100 150 200 250 300 350 400 450 500
-0.2 0 0.2
d2 coefficient
50 100 150 200 250 300 350 400 450 500
-1 -0.5 0 0.5
d3 coefficient
(ii)Feature Extraction: Detection of P wave, QRS complex wave is difficult as ECG signal varies with time due to psychological conditions and presence of noise. Two Thresholds, one considering amplitude and other interval between samples are applied to reconstructed signal. Samples greater than threshold are considered remaining are ignored. Find maximum peaks in signal which are nothing but R-peaks. Four timing windows are created to detect remaining peaks (P, Q, S, and T) in signal.From the detected peaks we calculate parameters like RR, PR interval and QRS width for each beat.
50 100 150 200 250 300 350 400 450 500
-2 -1 0 1
d4 coefficient
50 100 150 200 250 300 350 400 450 500
-2 0 2
d5 coefficient
50 100 150 200 250 300 350 400 450 500
-2 0 2
a6 coefficient
50 100 150 200 250 300 350 400 450 500
-1 0 1 2
reconstructed ECG signal
Fig (5) d4, d5, d6 detailed, a6 coefficient and reconstructed signal (d3+d4+d5+a6)
(iii) Classification: Based on features extracted (RR, PR intervals and QRS duration) decision rules were formed. In our algorithm we take average of 8 RR, PR interval and QRS width.so intervals considered are averaged ones. Total of 6 decision rules are formed after profoundly studying many arrhythmias. Some of the arrhythmia classifying decision rules are
For Bradycardia
If (QRS == 0.11&&PR>0.2 && abnormalbeats==0&&PR<0.2) --- (8) For Tachycardia
If (QRS == 0.11&&PR<0.2 && RR<0.85 && (abnormalbeats==0)) --- (9)
Using this decision rules we can detect totally six Arrhythmias those are Bradycardia, Tachycardia, Ventricular Tachycardia, Asystole (Complete Heart Block), First Degree AV block, Second Degree AV block
C. Performance Measure: We have used three parameters for evaluating performance of our algorithm. Those are accuracy, sensitivity, positive predictive. These parameters are defined using 4 measures True Positive (TP), True Negative (TN), False Positive (FP), and False Negative (FN)
True Positive: arrhythmia detection coincides with decision of physician True Negative: both classifier and physician suggested absence of arrhythmia False Positive: system labels a healthy case as an arrhythmia one
False Negative: system labels an arrhythmia as healthy
Accuracy= (TP+TN) / N--- (10) Total number of cases are N
Sensitivity: Sensitivity refers to the rate of correctly classified positive. Sensitivity may be referred as a True Positive Rate. Sensitivity should be high for a classifier
Sensitivity = TP / (TP+FN) --- (11)
Positive predictive: Positive predictive is probability that disease is present when test is positive, which is by how much amount disease is correctly predicted.
Positive predictive = TP/ (TP+FP) --- (12)
III. RESULTS AND DISCUSSION
Matlab-based GUI-driven tool is developed for effective detection and classification of arrhythmia using ECG signals. Totally 19 ECG samples are tested, table (1) shows results of our proposed method for some ECG samples. Algorithm works fine for noise contaminated signals also. We consider the entire duration ECG recordings since the proposed method does not require any learning phase.
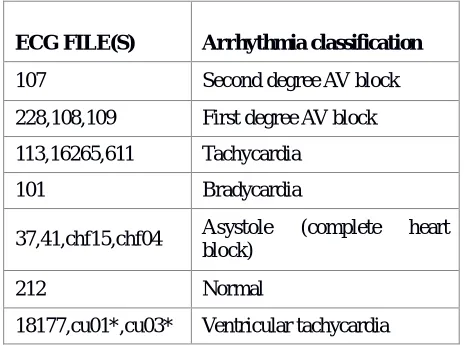
Table. (1) Shows arrhythmia classification using our algorithm for some ECG signals
ECG FILE(S) Arrhythmia classification
107 Second degree AV block
228,108,109 First degree AV block
113,16265,611 Tachycardia
101 Bradycardia
37,41,chf15,chf04 Asystole (complete heart block)
212 Normal
18177,cu01*,cu03* Ventricular tachycardia
Cu01, cu03 signals are from Creighton University arrhythmia databases .The proposed algorithm tested on multiple databases and works fine. Some MIT-BIH records exhibits high graded noise and artifacts like records 108,228 contain several baseline drifts and abrupt changes, record 113 has tall sharp T waves and record 223 exhibits sudden changes in QRS amplitudes, still our algorithm effectively detected heart disorder. Record 232 include long pauses up to 6 s in duration with high muscle noise, here our algorithm fails to correctly classify type of arrhythmia but still correctly predicts patient’s abnormal heart condition. Obtained features for some records with corresponding disease detected is tabulated in table (2)
The proposed algorithm implemented on a 1.8 GHz Intel core i3 CPU using MATLAB version 13a, the average processing time required for performing our method on each 30 min ECG data in the MIT-BIH database is approximately 2.24 s
Table. (2) Calculated parameters from our algorithm for some ECG samples
Database name RR interval PR interval QRS width Arrhythmia
detected
101
0.89 0.148 0.10 Bradycardia
107
0.8503 0.149 0.15
Second degree heart block
109
0.8601 0.2410 0.1135
First degree heart block
113 0.6677 0.123 0.0747 Tachycardia
212 0.829 0.141 0.124 Normal
223 0.667 0.159 0.1125 Tachycardia
228 1.5778 0.2306 0.1372
First degree heart block
611 0.45 0.1403 0.1014 Tachycardia
16265 0.2163 0.0507 0.0337 Tachycardia
37
- - - Complete heart
block
Chf15
0.0819 0.0958 0.167 Heart block
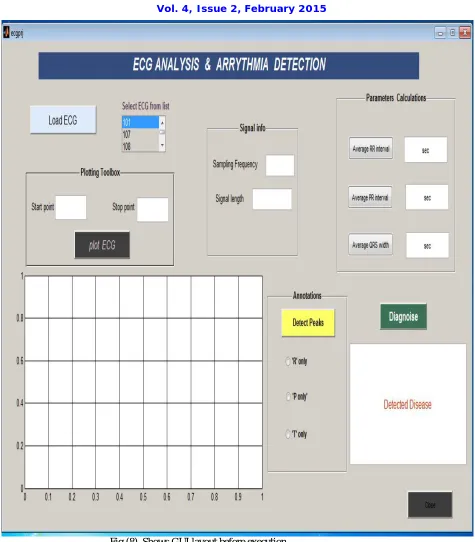
(A.)GUI building: GUI for this software is divided into number of subgroups according to their functionality. Our software module not only detects arrhythmia but also helpful in analysing ECG signal.
Signal loading: ECG signals in database are listed in list box. We can select whatever signal we want and load it with push button “load”
Plotting panel: In this we have plotting toolbox with start and stop point for plotting ECG signal in axes plane, this is provided for user’s flexibility in selecting signal segment they want and analyse it.
Signal information panel: This panel displays signal sampling frequency and its duration.
Annotations: Peaks of ECG signal can be detected and facility is there to choose peaks users want to see(R or P or T or all peaks) by choosing radio buttons.
Parameters Calculation: parameters from our algorithm PR, RR interval and QRS width can be find by clicking push buttons in this panel.
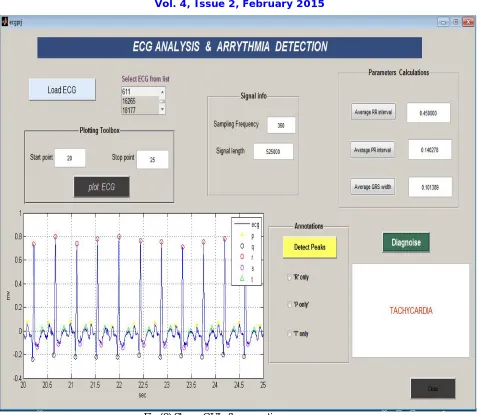
Fig (8). Shows GUI layout before execution
Fig (9).Shows GUI after execution
Figure (9) shows graphical user interface (GUI) after execution execution of algorithmn.Here input sample taken is "611" dat file from MIT-BIH database.Proposed algorithmn sucessfully detected arrhythmia as "Tachycardia" as shown in text box with red color.ECG peaks "PQRST" detected are highlighted with different colors each.
IV. CONCLUSION AND FUTURE SCOPE
REFERENCES
1. Sayantan Mukhopadhyay1, Shouvik Biswas, “Wavelet Based QRS Complex Detection of ECG Signal”, International Journal of Engineering
Research and Applications,Vol.2, Issue3, pp.2361-2365, May-Jun 2012,
2. Mujeeb Rahman, Mohamed Nasor,”An Algorithm for Detection of Arrhythmia”, International Journal of Biological Engineering, Volume 2
Issue 5,pp.44-47, 2012
3. S. Z. Mahmoodabadi, A. Ahmadian,” ECG Feature Extraction Using Daubechies” fifth iasted international conference visualization, imaging
and image processing, september Issue , pp.7-9, 2005
4. Introduction to graphical user interface (GUI),”The Mathworks”
5. The wavelet tutorial, second edition part 1, Robi polikar
6. Jaylaxmi C Mannurmath , Prof. Raveendra M, ”MATLAB Based ECG Signal Classification”, International Journal of Science, Engineering and
Technology Research ,Vol 3, Issue 7, July 2014
7. M.Sabarimalai Manikandana, K.P. Soman,” A novel method for detecting R-peaks in electrocardiogram(ECG) signal”, Elsevier, Biomedical
Signal Processing and Control , Issue 7 , pp.118– 128 , 2012
8. C. Saritha, V. Sukanya,” ECG Signal Analysis Using Wavelet Transform”, Bulg. J. Phys. Issue 35, pp.68 –77, 2008
9. Gordan cornelia, reiz romulus,” ECG signals processing using wavelets”,
10. Anuja sas, Shreetam behera, “Identification of Tachycardia and Bradycardia Heart Disorders using Wavelet Transform based QRS Detection” ,