Available online: https://edupediapublications.org/journals/index.php/IJR/ P a g e | 64
To Investigate the Most Important Factors Creating Satisfaction in the Mind of the
Customers While they decide to buy the Particular Brand of Detergent Powder and
Cake: An Empirical Study in the Rural Areas of Uttarakhand State- (India)
Arun Kant Painoli
Deputy Director
Doon Institute of Management and Research
Rishikesh (Uttarakhand) – India
Abstract
Study of the variables affecting the satisfaction of the customers is always an interest area for any business enterprise. The variable which brings satisfaction in the mind of the customers varies from one customer to another customer. That is why it becomes one of the biggest challenge in front of the companies to assemble all those different aspects in one product. Detergent powder and cake is one of the products in the category of FMCG products which we all use in our daily life. I have chosen rural market because there is a huge potential in the rural market since 65 to 70% of the population are living in the rural areas. In spite of this huge market potential the rural market is not fully taped. My intention of writing this paper is to know the most important attributes which bring satisfaction in the mind of the customers while they
decide to buy the particular brand of detergent powder and cake in the rural areas.
Key Words: - Customer Satisfaction, Detergent powder and cake, Rural marketing.
Introduction
Available online: https://edupediapublications.org/journals/index.php/IJR/ P a g e | 65
Satisfaction of the customer can be measure with the help of two broad parameter - Performance of the product and expectation from the product. If the performance of the product is higher than the expectation of the customers, then the customers get satisfied, but if the performance of the product is lower than what customer expect from the particular brand then the customers get dissatisfied. In an attribute level the overall satisfaction is the evaluation of some total of benefits he or she received from the particular brand. When companies able to manage its customers in terms of their expectation, the customers become happy and create positive image in their mind. This creates positive word of mouth and it help in the promotion of the product without doing any effort by the company. Satisfied customers have a positive impact about the product in their mind and that is why it is always been an interest area for the marketers to investigate this impact. When we measure customer satisfaction we come up with the important attributes which influences the buyer behavior and it will help the marketers in designing the marketing strategies as per the expectation of the customers. Detergent powder and cake is the most commonly used product in
the category of the laundry wash. There is huge competition in this sector both from recognized and un-organized sector. My intention of writing this paper is to know the most important attributes which create satisfaction in the mind of the customers when they decide to buy the particular brand of detergent powder and cake. I have chosen rural market because there is a huge potential in the rural market and still it is not full tapped as compared to the urban market. Therefore it is essential to know the expectation of the customers in order to satisfy them.
Objective
1. To know the most important factors which bring satisfaction in the mind the customers while decide to buy the particular brand of detergent powder and cake in the rural areas.
Literature Review
Available online: https://edupediapublications.org/journals/index.php/IJR/ P a g e | 66
mind of the customers. Thaniga chalam and K. Vijatrani (2014) in their finding found that the easy availability of the product in the village influences their decision most and they stick on the brand which is easily available in the nearby retail outlet. The presence of this factor influences their decision and brings satisfaction in their mind. Shalini Srivastava (2013) in her finding suggested that the variable under
reliability – like shopkeeper
recommendation, positive word of mouth, brand loyalty, known own recommendation, create positive image in the mind of the customers while they decide to buy the FMCG products. Swapnil Phadatare and Omprakash Haldar (2015) in their finding stated that the customers are very much influence by the attributes like washing tough stain, safety of hand, fragrance, packaging and advertisement of the particular brand. Amandeep Kaur and Megha (2014) in their finding found that the pinion leader and product display in the retail outlet tigers the buying decision and also bring satisfaction which help in their decision making process. A.M.Mahaboob Basha (2016) in his finding conclude that he companies who sale their products at standard price with good quality and easy
Available online: https://edupediapublications.org/journals/index.php/IJR/ P a g e | 67
rural market. Kim et.al (2002) argues that customer values get influenced by product attributes and consumption behavior and they consider customer values as an output of culture. Yuping (2007) in his finding stated that loyalty program were most likely influence the buying behavior of the consumer and post purchase behavior in the rural area.
Research Methodology
Having identified the statement of the problem and set of objective it has been decided to go for descriptive research. A structure schedule questionnaire was administered to the consumer of above18 year and above age group of people living in the rural areas of Uttarakhand. For this two broader region of Uttarakhand has been selected- Garhwal region and Kumaon region. In the present research work data is collected from both primary and secondary sources
Sample design: - For these stratified random sampling techniques was used to select the respondents from the selected area. While designing the sample following important parameter was considered to design the sample which is as follow:-
Sample size: - The sample size was calculated with the help of online available sample size calculator. A total of 1100 respondents were selected randomly out of which 1080 correctly filled questionnaire were taken for final analysis. (Refer-
www.s urveys ys tem.com)
Sample area: - The Sample area for the proposed study was entire state of Uttarakhand represented through the following two broad regions of Uttarakhand state viz Kumaon and Garhwal region Sampling unit: - The sampling units were the respondents in the age group of 18 and above year of peoples living in the rural area of the Uttrakhand. In those both male and female customers were selected randomly from the selected area under investigation. The sampling techniques:- The sampling techniques use in this research was Stratified Random sampling. In this the stratified sampling technique is used to avoid non overlapping of the strata
Available online: https://edupediapublications.org/journals/index.php/IJR/ P a g e | 68
they decide to buy the particular brand of FMCG product in the rural areas. These factors which included for investigation of the research are given below:-
Reliability of the product, Product attributes, Quality of the product, Promotion of the product, Economic acceptability of the product and Social image factors.
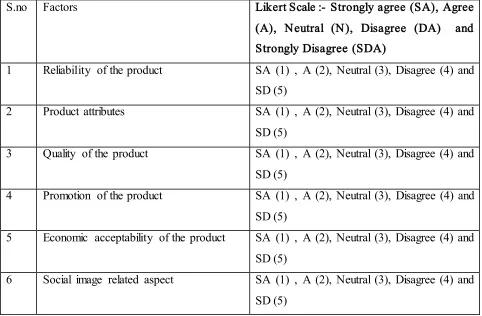
These factors were measured in 5 point likert scale.
The Question asked from the respondents is given below.
Q. Which is the most important factor which bring satisfaction in your mind in case you buy the particular detergent powder and cake? Rate your satisfaction or dis-satisfaction against the factors on the scale mention against the each factor
S.no Factors Likert Scale :- Strongly agree (SA), Agree
(A), Neutral (N), Disagree (DA) and Strongly Disagree (SDA)
1 Reliability of the product SA (1) , A (2), Neutral (3), Disagree (4) and SD (5)
2 Product attributes SA (1) , A (2), Neutral (3), Disagree (4) and SD (5)
3 Quality of the product SA (1) , A (2), Neutral (3), Disagree (4) and SD (5)
4 Promotion of the product SA (1) , A (2), Neutral (3), Disagree (4) and SD (5)
5 Economic acceptability of the product SA (1) , A (2), Neutral (3), Disagree (4) and SD (5)
6 Social image related aspect SA (1) , A (2), Neutral (3), Disagree (4) and SD (5)
Available online: https://edupediapublications.org/journals/index.php/IJR/ P a g e | 69
Result Analysis and Discussion
The descriptive statistics for the 6 extracted factors have been shown in the Table 2 which is given below
Regression Analysis: - Descriptive Statistics
Table 2 :- Overall Descriptive Statistics of factors Extracted after Factor Analysis
N Minimum Maximum Mean
Std. Deviation
1.Reliability 1080 6.00 27.00 16.1250 3.88888
2. Promotion of the product 1080 5.00 25.00 13.7157 3.35479
3. Product attribute 1080 5.00 25.00 12.5852 3.63667
4.Quality of the product
5. Economic Acceptability
6. Social Image
1080
1080
1080
5.00
5.00
3.00
18.00
12.00
15.00
11.9611
10.0491
6.8204
3.22846
2.15618
2.27350
Valid N (list wise) 1080
The above table display descriptive statistics for each factor that have been selected for the study. Though the mean rating has been highest for first factor but with the largest standard deviation making it difficult to decide which is the most important factor that influences the satisfaction of the
Available online: https://edupediapublications.org/journals/index.php/IJR/ P a g e | 70
Regression Analysis
Table 3:- Regression Analysis
Model Summary
Model R R Square Adjusted R Square Std. Error of the Estimate
1 .873a 0.761 0.76 0.29334
Predictors: (Constant), Reliability of the product, Promotion of the product, Product attributes, Quality of the product, Economic acceptability, Social Image
The Table 3 displays R, R squared, adjusted R squared, and the standard error. R, the multiple correlation coefficients is the correlation between the observed and predicted values of the dependent variables. The value of R for models produced by the regression procedure range from 0 to 1. Larger value of R indicates stronger relationship. In our case R value is .873 suggesting a high correlation between dependent and independent variables. Also the P value of significance is .000 and is less than .05 suggesting that relationship is significant
R squared is the proportion of variation in the dependents variable explained by the regression model. The value of R squared rang from 0 to 1 Small values indicates that
the model does not fit the data well. The sample R squared tends to optimistically estimates how well the model fits the population. For the data concerning our study R squared value is 0.761 which though not very high but also not very low as well. In nut shell the regression model is able to explain 70% of the variation in the dependent variable so as to conclude that regression model fit population to a reasonable degree.
Available online: https://edupediapublications.org/journals/index.php/IJR/ P a g e | 71
Regression Analysis: - ANOVA Table
Table 4:- ANOVA Analysis
ANOVA Model
Sum of
Squares
df Mean
Square
F Sig.
1 Regression 294.556 6 49.093 570.53 .000 (a)
Residual 92.329 1073 0.086
Total 386.885 1079
(a) Predictors: (Constant), Reliability of the product, Promotion of the product, Product attributes, Quality of the product, Economic acceptability, Social Image
(b) Customers satisfaction
The table summarizes the result of the analysis of variance. The sum of the square degree of freedom and mean square for displayed for two source of variation regression and residual.
The output for regression display information about the variance accounted for by the model. The output for residual display information about the variation that is not accounted for for by our model and the output for Total is the sum of the information for Regression and Residual. A model with the large regression sum of square in comparison to the residual sum of square indicate that the model account for most of variation in the dependant variable. For very high residual sum of square
indicate that the model fails to explain a lot of the variation in the dependent variable. In our case the regression value is more than the residual value though not significantly large. Thus we can conclude the regression model is able to explain good amount of variation in the dependent variables
Available online: https://edupediapublications.org/journals/index.php/IJR/ P a g e | 72
explaining the variation in the dependent variable. If the significance value of F is larger say 0.05 then the independent variable do not explain the variation in the dependent variable.
For the Current study the significance value of F is .000 and is smaller than .05 thus indicating that all the extracted factors have done a good job explaining the variation in influencing the overall buying behavior of the consumers.
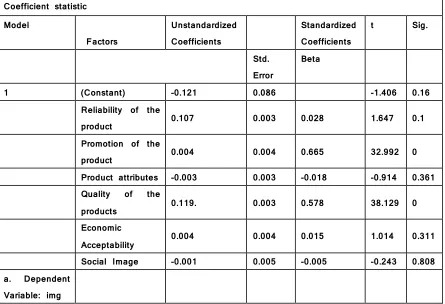
Regression Analysis- Regression Coefficient
Table 5:- Regression Coefficient
Coefficient statistic Model
Factors
Unstandardized
Coefficients
Standardized Coefficients
t Sig.
Std. Error
Beta
1 (Constant) -0.121 0.086 -1.406 0.16
Reliability of the
product 0.107 0.003 0.028 1.647 0.1
Promotion of the
product 0.004 0.004 0.665 32.992 0
Product attributes -0.003 0.003 -0.018 -0.914 0.361
Quality of the
products 0.119. 0.003 0.578 38.129 0
Economic
Acceptability 0.004 0.004 0.015 1.014 0.311
Social Image -0.001 0.005 -0.005 -0.243 0.808
a. Dependent
Variable: img
(a) Predictors: (Constant), Reliability of the product, Promotion of the product, Product attributes, Quality of the product, Economic acceptability, Social Image
Available online: https://edupediapublications.org/journals/index.php/IJR/ P a g e | 73
The above table shows the independent variables (selected factors) with the understand coefficient, standardized coefficients, these are the coefficient of the estimated regression model. Often the independent variable is measure in different unit. The standardized coefficient or beta is an attempt to make the regression coefficient more comparable. The t statistics can help us to determine the relative importance of each variable in the model. As a guide regarding useful predicators, look for t values well below – 2 or above + 2 The unstandardised regression coefficient beta values i.e B for the second factor i.e. the Quality of the product is .119 and is largest indicating, it as the most important factor that bring satisfaction in the mind of the customers while they buy the particular brand of detergent powder and cake. Other factors (importance wise) that bring satisfaction in the mind of the customers is Reliability of the (with B value 0.107).
Hence from the above research it is clear that the “ Quality factor’’ is the most important factor which brings satisfaction in the mind of the customer .When the question of satisfaction comes in the mind of the customers while they decide to buy the
particular brand of detergent powder and cake the Quality factor plays important role in convincing the buying behavior of the customers. The Quality factors contain certain specific attributes which bring satisfaction in the mind of the customers; these are stain removing quality, skin friendly quality and good fragrances. Presence of thee attributes in the product defines the overall quality of the product and has a great impact in bringing the satisfaction in the mind of the customers. Other important factor in this category is the Reliability of the product, which includes recommendation by the shopkeeper, positive word of mouth by other customers, brand name, known own recommendation (Post purchase experience) and easy availability of the chosen brand of detergent powder and cake in the nearby retail outlets.
Limitation of the study
Available online: https://edupediapublications.org/journals/index.php/IJR/ P a g e | 74
and hence it took more time in asking the responses from the respondents.
Conclusion
Hence from the above research we can conclude that, the quality factor is the most important factors among all the 6 factors which we have included in the research study. Presence of the quality factor in any brand creates satisfaction in the mind of the customers while they decide to buy the particular brand of detergent powder and cake. The quality factor contains certain specific attributes, which in combination define the overall quality of the product. Other important factor beside the quality factors is the motivational factors like reliability factor associated with particular brand of detergent powder and cake. Hence from the above research we can suggest that, the marketers should pay special emphasis in up bringing the Quality factor and specific attribute associated with the quality of the product. Every company has to come up to the expectation of the customers in order to satisfy the customer and for this quality factor is the most important which we have proved from the above sited research.
References
1. Md. Abbas Ali Venkat Ram Raj Thumiki and Naseer Khan (2012), Factors Influencing Purchase of FMCG by Rural Consumers in South India: An Empirical Study, International Journal of Business Research and Development, Vol. 1 No.1, pp. 48- 57
2. S.Thaiga Chalam and K.Vijayarani (2014), Consumer Behavior towards fast moving consumer goods in Pondicherry, Asia Pacific Journal of Research, Vol: I Issue XVII, PP 130-138
3. Shalini Srivastava (2013), Factors Affecting Buying Behavior of Consumers in Unauthorized Colonies for FMCG Products, Global Journal of Management and Business Studies, Volume 3, Number 7, pp. 785- 792
4. Amandeep Kaur and Megha (2014), Factor Influencing Unplanned Buying Behavior of Untapped, IOSR Journal of Business and Management, Special Issue AETM16, pp 7-10
5. A.M.Mahaboob Basha ( 2016 ), A study of consumer behavior towards FMCG goods: An empirical study with special reference to SPSR Nellore district – Andhra Pradesh, , 6th International Conference on Recent Innovation in Science, Engineering and Management , 20 the August, PP-1-7
Available online: https://edupediapublications.org/journals/index.php/IJR/ P a g e | 75
with Special Reference to Kochi City , Advances in Economics and Business Management (AEBM), Volume2, Number 7; April-June, 2015 pp. 722-725
7. B.V.N.G. ChandraSekhar (2012) ,Consumer Buying Behavior and Brand Loyalty in Rural Markets: FMCG, OSR Journal of Business and Management (IOSRJBM), Volume 3, Issue 2, pp 50-67.
8. Dhayia Dharam Sukh Dahiya (1996) “An attitudinal study of Consumer”, Journal of Commerce vol. XLIX No. 189 part IV, pp 101-106
9. Jarvis C.B (1998), An Exploratory Investigation of Consumers‘Evaluation of External Information Sources in Pre-purchase Search, Advances in Consumer Research, XXXV, Ed. J, W. Alba and W. Hutchinson
10. Dhanalakshmi,S and M. Ganesan (2015), Factors affecting consumers purchase of Bath soap in Chennai and its surrounding – An empirical study, International Journal Of Pharmacy & Technology, Vol. 6 , Issue No.4 ,pp 7818-7826
11. Singh Surinder Kundu (2013), Customer perception towards the FMCG in rural market: An analysis, International Journal of Techno Management Research, Vol 01 Issue-2, Sep 2013 pp 48
12. Kim J, Forsythes, Gu Q and Moon S. J. (2002), Cross Cultural Consumer values, Needs and Purchases Behavior, The Journal of Consumer Marketing Vol.19, No. 6, pp481-502.
13. Liu, Yuping (2007), The Long-Term Impact of Loyalty Programs on Consumer Purchase Behavior and Loyalty, Journal of Marketing, Vol.71 Issue 4, p19-35.
14. Swapnil Phadatare and Omprakash Haldar (2015), To study on consumer buying behavior towards detergent of few companies in Satara city, ASM’s International E -Journal on Ongoing Research in Management and IT, INCON – X 2015 , pp 77-88.
15. Leon G. Schiffman, Leslie Lazar Kanuk and S.Ramesh Kumar (2010), Consumer Behavior, 10th Edition, Pearson Publication