Available online: http://edupediapublications.org/journals/index.php/IJR/ P a g e | 711
Evaluating the performance of the optimal investment portfolio
using some financial methods
Dhuha Ali Hamzah Al-Rubaie & Prof. Dr. Haider Youns AL- Moussawi
1Applied research on the Bank listed in the Iraq Stock Exchange
Post Graduate Institute for Accounting and Financial Studies
Ministry of Higher Education and Scientific Research,University of Baghdad 2Republic of Iraq
University of Baghdad, Republic of Iraq
ABSTRACT
The optimal investment portfolio is one of the most important issues in financial management because of size and variety of investment options as well as the large and varied risks in the financial and banking field. Due to the importance of optimal investment portfolios for investors, there is a great attention on the risk that may affect them and how to build the optimal investment portfolio which is the main concern of many researchers and in any sector that invests in the market. This research attempts to answer the questions that constitute the whole problem of research.
1- What are the shares that constitute the optimal investment portfolio in the banking sector belonging to the Iraqi market for securities?
2- Are portfolio valuation methods
identical to each portfolio?
The objective of this study is to use the one-indicator model to build the optimal
investment portfolio and to the risk-adjusted return method to evaluate the optimal investment portfolio performance according to the Sharpe, Turner and Jensen indices. This research used the data of the monthly closing price of shares of banks listed in the Iraqi market for securities research sample during the period of research from 2007-2016.
The research has reached to a lot of conclusions, the most important of which is that building the ideal investment portfolio according to the index model leads to efficient performance of investors in building their investment decisions by identifying the most desirable shares and forming their investment portfolio which is characterized by return and risk through the index of Turner compared to the cut rate. The results of the analysis showed that the methods used to evaluate the performance of the optimal investment portfolio according to the indicators (Sharpe, Turner and Jensen) are not identical, because each indicator focuses on a particular aspect of the risk. According to these conclusions , there are a lot of recommendations and the most important of which is the necessity that investors should adopt the one-indicator
Available online: http://edupediapublications.org/journals/index.php/IJR/ P a g e | 712
investment portfolio. This is due to the high efficiency of this model in reducing the type and the quantity of data and its ability to produce good stocks that achieve the best investments.
Introduction
In view of the great and rapid developments witnessed by the world today and in all fields in the fields of finance, banking, technology, investment and others, In addition to the great openness of the financial markets and the high level of competition between business organizations in various sectors, Including the banking sector. Studies on the financial and banking sector have begun to take a large part of the interest of writers, researchers and investors in this field. The theme of the investment portfolio is one of the most important topics in the field of financial management.
The process of investment portfolio construction needs to be evaluated on an ongoing basis, due to the dynamic investment movement on the one hand and the rapid changes in the financial and banking fields on the other hand. Therefore, this study aimed to build and evaluate the performance of the optimal investment portfolio using some financial methods (Sharp, Trainor, Jensen), which is one of the main benefits to identify the feasibility of the use of financial resources for individuals and companies alike, Because the objective of any investor is to form an ideal portfolio that reduces the risk and increase the return of the investor, as the investment is based on the elements of return and risk. This led investors to study the portfolio and carry out the necessary analysis of the return on risk using some financial methods and evaluate the performance of the ideal portfolio by comparing the results achieved by the
market portfolio return rate for the ideal portfolio selection.
The first Section
This course deals with determining the methodology of research by reviewing the
most important paragraphs (research
problem, importance of research, research objectives, research hypothesis, limits of spatial research (community and research sample) and temporal (duration and search data), procedures and methods of research as follows:
1.1.1 Research problem
The financial sector is fertile ground for risk as a result of the fast and rapid development in the financial, banking and investment fields in general, as well as the great openness of the financial markets and other economic sectors in light of the concepts of globalization in all its forms and fields. Therefore, following up and updating the ways and methods of assessment and the measurement of these risks, determining the priority returns in diversified investment is a priority of specialists and researchers. And here arises a fundamental problem which is the large and multiple investment options for the investors that making them financially uncertain and hard to make an investment decision in any of the sectors can invest financially in the stock market, and the Research problem can be summarized by the following questions:
1. What are the shares that constitute the optimal investment portfolio in the banking sector that belong to the Iraqi market for securities?
Available online: http://edupediapublications.org/journals/index.php/IJR/ P a g e | 713
2. Are the valuation methods for portfolio performance is identical for all portfolio? 3- Which banks are the most stable in entering the optimal investment portfolio?
2.1.1 Importance of Research
The financial world is characterized by great distinction for the financial sector. Therefore, the topics of the financial market , financial investment and the decision to be taken is important in the academic and field research ,as a result of the importance of investment portfolios to the investors ,the interest in the risk that can affect them and how to build investment portfolio weighted by the risk become the concern for many researchers so this research is interested in: 1 - Building the optimal investment portfolios for the banking sector in the Iraqi stock market and knowledge of the shares involved during the period of research. 2 - Know and prove that the valuation methods for the investment portfolio (Sharp scale, Trainor scale and Jensen scale) are similar in multiple portfolio evaluation. 3 - Know the most return to risk weighted bank and the sequence of banks in the Iraqi market for stock.
3.1.1 Research objectives
This research aims to achieve a number of goals on its head:
1 - Building the optimal investment portfolio for a number of banks in the Iraqi stock market and a statement of any shares listed in the market will enter into these portfolios.
2 - Evaluation of the investment portfolios of the banking sector in the Iraqi market for securities through a number of methods used in the assessment (Sharp index, the Trainor index, and the index Jensen).
3 - Arrangement of banks according to risk weighted return for each investment portfolio.
4.1.1 Hypotheses of the study
Depending on the research problem and its data, the research is based on a number of hypotheses agencies:
1 - The shares in the optimal investment portfolio are similar in the banking sector from one year to another.
2. The results of valuation techniques for optimal portfolio performance are similar.
5.1.1 Temporal and spatial limits :
A. Time Limits: Based on the research data, the following data have been provided. 1 - Values of the monthly closing prices of the Iraqi stock market index for all shares of the banks represent the research sample for the period from January 2006 until December 2016.
2 - Monthly interest rates on Iraqi treasury transfers for the period from January 2007 until December 2016.
B. Spatial boundaries:
The research community consists of all the shares of the Iraqi private banks. The sample of the research was selected based on the basic condition of the continuity of the banks listed in the market and circulation length of the inspection period and exclude banks written off and not within the period approved in the search.
6.1.1 Procedures and methods of study
We have relied on many of the financial and statistical methods that helped to accomplish this research, which were explained in the theoretical terms such as the equation of yield extraction , total risk calculation equation , calculation of beta , equation of variance and standard deviation calculation, calculation of the cutting rate , equation of Zi calculation , the calculation of optimal portfolio inputs weights , Sharp index and the Trainor index Jensen Index as well as relying on EXCEL to extract results.
2- Investment Portfolio
Available online: http://edupediapublications.org/journals/index.php/IJR/ P a g e | 714
the other is the term investment. The investment portfolio has been defined by several definitions :
Writer Year
Page Definitions
(Webster) (Poornima, Remesh)
2003 2015 330
21 It is a combination of securities such as stocks, bonds and other financial market instruments owned by the bank ,investor or other.
1
(Horn by)
2010 324
Oxford is defined it as a "group of shares owned by a single person or institution. 2
(Bilaus)
2010 3
An appropriate mix of investments held by institutions or individuals.
3
(Taw& Myanmar)
2015 3
Investment portfolio is "transactions and positions involving trading in shares or debt securities, and other assets."
4
Optimal investment portfolio
The ideal portfolio term is not a concept at all but a relative one Therefore, it is difficult to define a general and unified model that defines its specifications from the point of view of all investors , As investors differ in the order of priorities , objectives ,
data and therefore the investor decides how to merge the investment tools that make up the portfolio.Therefore, many definitions of the optimal investment portfolio were presented by writers, authors and researchers in financial administration and markets. Hence, we include some concepts of optimal portfolio.
Table (2) optimal investment portfolio definitions
Writer Year
Page Concept
(Reilly & Brown)
2012 200
Is an "efficient portfolio that has the highest benefit for a given investor." 1
(
Francis)
2013 265
"A portfolio is at an efficient limit to achieve the best combination of return and risk for a particular investor.
2
(Bourdain)
2015 20
Is a portfolio that, under market conditions and investor preferences,
maximizes investor satisfaction.In
accordance with the expected interest theory, the risk investor will never choose an inefficient portfolio, and there is always an ideal portfolio for each investor.
Available online: http://edupediapublications.org/journals/index.php/IJR/ P a g e | 715 Modern Portfolio Theory(MPT)
Also called "portfolio management theory" MPT, an advanced investment gateway developed by Professor Harry Markowitz in 1952. (Ahmadinia, 2011: 25-26) The Markowitz model is used to select securities based on risk and return analysis. Markowitz laid the foundation
for risk measurement and his contribution was known as "modern portfolio theory". Which provided tools for analysis and optimal portfolio selection. (Nalini, 2014: 73). According to the research by Harry Markowitz and William Sharp, this theory suggests maximizing returns through a variety of securities. This theory tells us that risk can be reduced by combining low risk securities with high-risk securities, and this theory is based on the concept of
diversification in its formulation.
(Ahmadinia, 2011: 25-26) .
Modern portfolio theory (MPT) is defined as: "An approach to decision making The investment portfolio seeks to increase return rates while minimizing risk, and the portfolio should include free and risk-free securities that are mutually exclusive." (Friedman, 2000: 431)
Assumptions of Portfolio Theory:
Markowitz is credited with the development of modern portfolio theory and portfolio theory is based on several assumptions about investor behavior: (Brown & Reilly, 2010: 182) (Yang & Zhu, 2013: 2310) 1. Investors look at each investment
alternative from the perspective of potential distribution of expected returns over a given period of time.
2 .Investors aim to maximize the expected benefit for one term, and benefit curves show a diminishing marginal utility of wealth.
3 .Investors value portfolio risk on the basis of volatility in expected returns.
4 .The investment decision is based on two variables: the expected return and the risk. Therefore, the benefit curves are a function of the expected return and the variance or the expected standard deviation of the returns only.
5 .Investors avoid risk. They choose the alternative that gives less risk if two alternatives have the same yield.
Evaluation of portfolio performance
Available online: http://edupediapublications.org/journals/index.php/IJR/ P a g e | 716 Figure (1) Securities Market Line (SML)
Source : Levišauskaite , Kristina , ( 2010) ,
"Investment Analysis and Portfolio
Management" , Leonardo da Vinci
programme project , Vytautas Magnus University Kaunas, Lithuania . p 58.
Performance Appraisal Methods
The methods of performance evaluation have evolved from simple to double-method. The simple method is based on measuring the return only. The scientific method depends on the measurement of return and risk together. There are several models used to measure risk-adjusted return on investment portfolio: Sharpe (1966), Treynor (1965) and Jensen (1968).
Sharpe’s performance index:
Sharpe index was given by WF Sharpe in 1966, it measures risk premium of a portfolio, relative to the total amount for risk in the portfolio. Sharpe index summarizes the risk and return of a portfolio in a single measure that categorizes the performance of funds on the risk-adjusted basis. The larger the Sharpe Index, the portfolio over performance the market and vice versa (Acma ,2014 : 196) , (Kidd,2011:1) .
SRp = ]E(rp)-(Rf) [ /σ(rp)
As:
SRp = refers to the value of the bonus index to the volatility ratio of the yield, which reflects the performance of the investment portfolio under evaluation.
E(rp) = Indicates average portfolio return.
Rf =Indicates a risk-free return on
investment.
σ(rp) =refers to portfolio risk measured by the standard deviation of portfolio returns.
Treynor’s performance index:
It was given by Jack Treynor in 1965, it is expressed as a ratio of returns to systematic risk i.e. beta. It adjusts return based on systematic risk; therefore it is relevant for performance measurement when evaluating portfolios separately or in combination with other portfolios (Marios , 2014 :31) ؛ (Jagric, et al., 2007:237) (Poornima, Saranya, 2016:86).
As:
Tp = Treynor index value
)E )RP ( = expected portfolio yield; RF = risk-free rate of return;
ΒP = beta-Purse.
Jensen’s performance index:
It is a regression of excess fund return with market return given by MC Jensen in 1968.
It is also popularly known as Jensen’s alpha
Available online: http://edupediapublications.org/journals/index.php/IJR/ P a g e | 717
α= (RP– RF) – B(RM–RF)
As:
Α = alpha coefficient.
RP = Return on Investment Portfolio. RF= risk-free return.
RM = Market Portfolio Return (Market
Index)
B = Beta Investment Portfolio.
Steps to identify shares in the portfolio :
A set of steps to identify the shares in the portfolio will be listed as follows:
The first step: Calculate the return and risk of the security on the basis of the single index model. According to equation .( Elton et.al,2014:128 ) (Bodie,et.al,2011:253 )
The second step: Arrange the securities (shares) from top to bottom using the ratio of the additional return of the share to Beta
(β) This is called the measure of Treinor, which measures the desired stocks and as the following equation: (Jordan & Miller, 2009: 415)
The third step: After listing the securities from the highest desired value to the lowest value, the cut rate is calculated. The cut rate is the rate at which the stock that will be included in the optimal portfolio is determined. and it is calculated according to the following formula :( Elton et.al, 2014: 180 )
As:
Ci = cutting rate.
σ2 m = Differential (variation)rate of the market portfolio return.
σ2ei = Differentiation(variation) of the stock return.
Ri = the rate of the security.
The fourth step: After identifying the securities that will be placed in the portfolio, the weight is determined for each security. And according to the following formula ( Chen: 2012, 14)
value is calculated according to the following formula:
:Represents the weight of the security in the portfolio,
Xi: represents the relative weight of the listed equity.
ثلاثلا لصفلا The first topic
Analysis of the characteristics of individual stocks in the Iraqi Stock Exchange.
1.1.3: Initialization of investment portfolio inputs for 2007
Available online: http://edupediapublications.org/journals/index.php/IJR/ P a g e | 718
2007 to 2016,Market returns, mean, variance and standard deviation can be determined for all years that have been adopted in the research, Because the current research requires calculating the return and risk of the optimal investment portfolio for each year, The following table is presented for 2007 and the same steps will be taken in the calculation of the remaining years of the research sample. Which is displayed as follows.
Table (3)
Monthly Market Rate, Average, Differential and Standard Deviation of
Market Returns for 2007. Market M Rm Dec-06 25.288 jaun-2007 25.903 0.02432 Feb-07 26.291 0.014979 Mar-07 28.745 0.09334 Apr-07 26.599 -0.07466 May-07 24.967 -0.06136 Jun-07 25.876 0.036408 Jul-07 40.948 0.58247 Aug-07 41.9 0.023249 spte-07 38.55 -0.07995 Oct-07 36.99 -0.04047 Nov-07 34.627 -0.06388 Dec-07 34.59 -0.00107 Rmˆ 0.03778 σ m 0.179643 σ2m 0.032271
Prepared by the researcher based on the output of the computer
It is clear from the previous table (3) that the average market return (Rm) was 0.03778, which is a positive return. The standard deviation of the market (σm)
reached (0.179643) and the market variance
(σ2m) (0.032271).
2 - Analysis of investment return and risk of individual stocks: Based on the monthly closing price of the shares during the period of research that was adopted, the rate of return of the shares can be calculated as a whole , The following is the presentation and analysis of the results of investment return and risk of the Babylon Bank stock as a model for 2007.
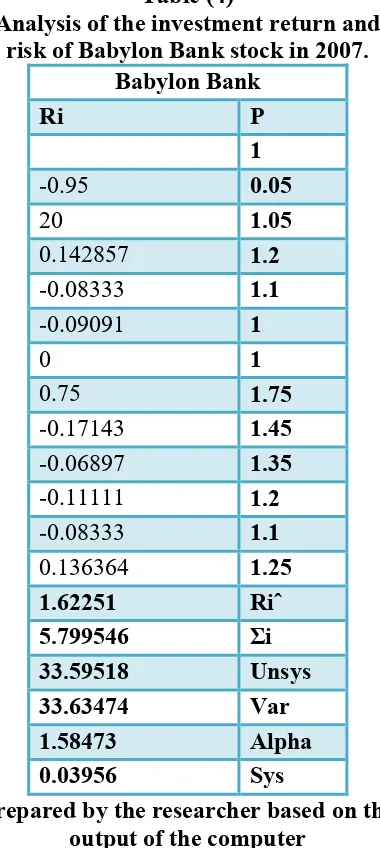
Table (4)
Analysis of the investment return and risk of Babylon Bank stock in 2007.
Babylon Bank P Ri 1 0.05 -0.95 1.05 20 1.2 0.142857 1.1 -0.08333 1 -0.09091 1 0 1.75 0.75 1.45 -0.17143 1.35 -0.06897 1.2 -0.11111 1.1 -0.08333 1.25 0.136364 Riˆ 1.62251 Σi 5.799546 Unsys 33.59518 Var 33.63474 Alpha 1.58473 Sys 0.03956
Prepared by the researcher based on the output of the computer
Available online: http://edupediapublications.org/journals/index.php/IJR/ P a g e | 719
the year 2007, The standard deviation value has reached (5.799546) Which is a high value, which indicates the overall risk of the bank, The stock beta was valued at (0.03956) which is a positive value, which means the relationship between the movement of the stock and the market is a positive movement.
We have adopted the same procedures in the calculation of the rest of the banks in the sample research, Therefore, the following table (5) includes a comprehensive presentation of all the results of the return rate , the standard deviation and beta stocks in sample banks.
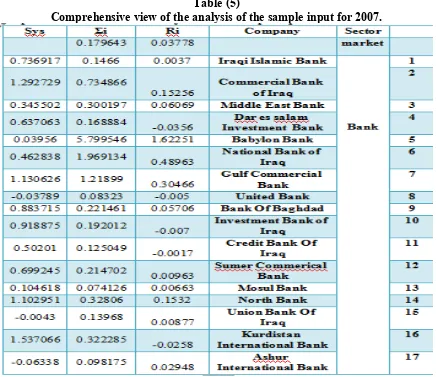
Table (5)
Comprehensive view of the analysis of the sample input for 2007.
Prepared by the researcher based on the output of the computer
As shown in table (5) above the Bank with the highest return of the 17
banks in 2007 is Babil Bank which amounted to (1.6225), This means high economic activity in Bank No. (5), The bank with the lowest returns is represented by (4) Dar al-Salaam Bank amounted to (-0.0356). This shows the downward movement of the bank's shares, standard
Available online: http://edupediapublications.org/journals/index.php/IJR/ P a g e | 720
decrease in the overall risk of the bank, while the beta coefficient has reached the highest value of bank's Beta in the research sample for the year (1.537066) for the bank of Kurdistan. This shows that the movement of stocks more volatile than the movement of the market, The lowest value of the Beta coefficient was (-0.06338) for the Bank of Assyria, This indicates that the relationship between the stock and the market is inverse.
The second topic
Building the optimal investment portfolio using a single index model
After the necessary inputs have been prepared to build the optimal investment portfolio in the first section, the optimal
annual portfolio will be built for the length of the research period (2007-2016).
1.2.3: Building the optimal investment portfolio for 2007 year.
1 - Determining the return and risk of the shares and the Trainor index for the research sample
Table (6) shows the ranking of the shares according to the TRAINOR index (from top to bottom), whereby the desired percentage of the stock is determined for the entry in the portfolio. The table includes the rate of return for each share of the sample shares, The market to the variability of market returns, as well as the rate of return of the risk-free asset.
Table (6)
Available online: http://edupediapublications.org/journals/index.php/IJR/ P a g e | 721 Prepared by the researcher based on the output of the computer
Table (6) shows that the highest value of the Trainor Index (46.83) for the Iraqi Union Bank and the lowest value of the Trainor Index (-1.94) for the Bank of Mosul.
2 - Determine the rate of cutting and shares nominated for the optimal portfolio :
After the shares of banks are arranged according to the Trainor index, the next step will be the calculation of (Ci) according to its equivalence on the theoretical side,
which constitutes the basis for determining the eligible shares to enter the optimal portfolio and the shares that are excluded, as well as determining the optimum cut rate
( c *) Which complements the calculation of the weights of the optimal investment portfolio components. The shares with the highest value of the Trainor index are entered in comparison with Ci and the exclusion of the lower value shares of the Trainor index compared to Ci by following table:
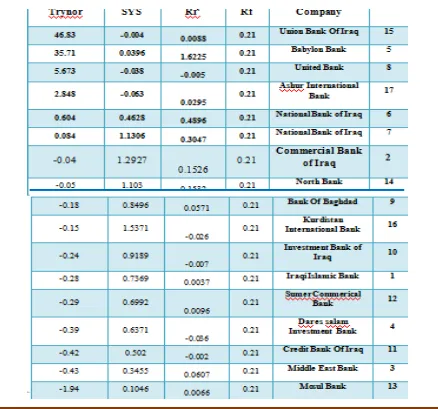
Table (7)
Determining the cut rate and the preferred shares for the optimal portfolio of 2007
company Rf Riˆ sys unsys Trynor (Ri-Rf)B/uns ys B^2/unsy s ∑ (Ri-Rf)B/uns ys ∑B^2/uns ys
σ2m∑(Ri -Rf)B/uns
ys 1+σ2m∑
B^2/unsy s Ci
15
Union Bank Of Iraq
0.21 0.00877 -0.0043 0.023808 46.8262 0.03632 0.00078 0.03632 0.00078 0.00117 1.0 0.00117 5 Babylon Bank 0.21 1.62251 0.03956 33.59518 35.7058 0.00166 4.7E-05 0.03798 0.00082 0.00123 1.0 0.00123 8 United Bank 0.21 -0.005 -0.03789 0.044817 5.6734 0.18174 0.03203 0.21972 0.03286 0.00709 1.0 0.00708 17
Ashur International Bank
0.21 0.02948 -0.06338 0.073016 2.84841 0.15669 0.05501 0.37642 0.08787 0.01215 1.0 0.01211 6 National Bank of Iraq 0.21 0.48963 0.462838 3.41465 0.60415 0.0379 0.06274 0.41432 0.1506 0.01337 1.0 0.01331 7 National Bank of Iraq 0.21 0.30466 1.130626 0.35531 0.08373 0.30123 3.59774 0.71554 3.74834 0.02309 1.1 0.0206 2 Commercial Bank of Iraq 0.21 0.15256 1.292729 -0.7527 -0.0444 0.09865 -2.2202 0.81419 1.52814 0.02627 1.0 0.02504 14 North Bank 0.21 0.1532 1.102951 -0.99533 -0.0515 0.06294 -1.2222 0.87713 0.30593 0.02831 1.0 0.02803 9 Bank Of Baghdad 0.21 0.05706 0.849615 -0.72125 -0.18 0.18016 -1.0008 1.05728 -0.6949 0.03412 1.0 0.0349 16
Kurdistan International Bank
0.21 -0.0258 1.537066 -1.4332 -0.1534 0.25293 -1.6485 1.31021 -2.3434 0.04228 0.9 0.04574 10
Investment Bank of Iraq
0.21 -0.007 0.918875 -0.88201 -0.2362 0.2261 -0.9573 1.53632 -3.3006 0.04958 0.9 0.05549 1 Iraqi Islamic Bank 0.21 0.0037 0.736917 -0.71543 -0.2799 0.21249 -0.7591 1.74881 -4.0597 0.05644 0.9 0.06494 12
Sumer Commerical Bank
0.21 0.00963 0.699245 -0.65315 -0.2866 0.21451 -0.7486 1.96332 -4.8083 0.06336 0.8 0.075 4 Dar es salam Investment Bank 0.21 -0.0356 0.637063 -0.60854 -0.3855 0.25709 -0.6669 2.22041 -5.4752 0.07165 0.8 0.08703 11
Credit Bank Of Iraq
0.21 -0.0017 0.50201 -0.48637 -0.4217 0.21852 -0.5181 2.43893 -5.9934 0.07871 0.8 0.09758 3 Middle East Bank 0.21 0.06069 0.345502 -0.25538 -0.4322 0.202 -0.4674 2.64093 -6.4608 0.08523 0.8 0.10768 13 Mosul Bank 0.21 0.00663 0.104618 -0.09912 -1.9439 0.21464 -0.1104 2.85557 -6.5712 0.09215 0.8 0.11695
Prepared by the researcher based on the output of the computer
Available online: http://edupediapublications.org/journals/index.php/IJR/ P a g e | 722
value of the Trainor index is higher than the cut rate (Ci)The optimum cutting rate for 2007 was (0.021). The number of shares in the optimal investment portfolio for 2007 was (6) shares only represented by (Bank of the Iraqi Union, Babylon, United, Bank of Assyria, the National Bank of Iraq, Gulf Bank).
3. Determine the investment weight of each share in the optimal portfolio.
After we identified the shares in the investment portfolio for 2007. The next step is to determine weight and this requires calculating the values of (Zi).According to the equations mentioned in the theoretical side and the results shown in Table (8).
Table (8)
The relative weight of each share within the optimal investment portfolio for 2007.
Prepared by the researcher based on the output of the computer
4 - Determining optimal portfolio return and risk :
After determining the optimal components and weights of the stocks in the portfolio,
Available online: http://edupediapublications.org/journals/index.php/IJR/ P a g e | 723 Table (9)
Return and risk of the optimal investment portfolio for 2007.
Prepared by the researcher based on the output of the computer
This is why the first hypothesis that "stocks in each investment portfolio are optimal for the banking sector from one year to another" should be rejected as the shares in each portfolio are not identical from year to year.
The third topic
Evaluating the performance of the optimal
investment portfolio using financial
methods. After the inputs were prepared to build the optimal investment portfolio in the first section(topic) and the optimal annual portfolio was built during the research period from (2007 - 2016) in the second
section(topic), the performance of the optimal investment portfolio is now evaluated using the financial methods (Sharp scale, Trainor, Jensen).
Optimal Portfolio Performance
Assessment for2007.
After the return and portfolio risk was determined in the previous section, The optimal portfolio performance is now assessed on the basis of its risk adjusted return, By calculating the values of the three indicators Sharp scale, Trainor, Jensen) for this portfolio. And compare them with the performance of the market portfolio, and the same procedures are adopted on the research sample, The table shows the results of the evaluation.
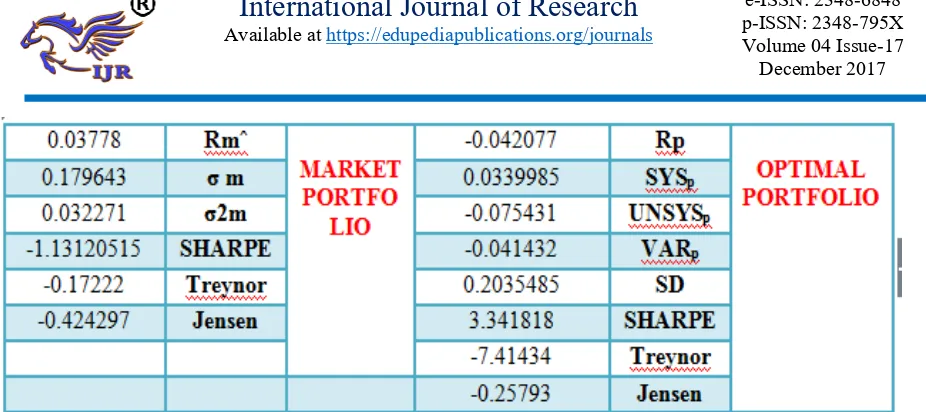
Table (10)
Available online: http://edupediapublications.org/journals/index.php/IJR/ P a g e | 724 Prepared by the researcher based on the output of the computer
Table (10) above shows the optimum portfolio return is low (-0.042077) which is a negative indicator of the decline and deterioration of the shares movement compared to the return of the market portfolio, which came as a positive value of (0.03778). The standard deviation of the optimum portfolio was (0.2035485) which is a high value compared to the standard deviation of the market portfolio reached (0.179643), this indicates the overall risk premium of the portfolio, The portfolio beta (0.0339985), which indicates an increase in systemic risk of the optimal portfolio, The non-systemic risk of the portfolio was(-0.075431) which is a low value compared to the market variance of (0.032271).This shows that the variation in the movement of the non-associated stock with market action is very low. The performance of the portfolio was positive according to the Sharp index with a value of (3.341818). Which means that it is better than the market performance of (-1.13120515),The performance of the best portfolio according to the index of Trainor was very low as it amounted to (-7.41434) compared to the performance of the market portfolio valued (-0.17222). Although both have a weak negative performance, the performance of the market portfolio is better than the optimal portfolio, The performance of the optimal portfolio by the Jensen Index was
negative also "(-0.25793). In comparison with the market performance of (-0.424297).Although both perform poorly, the optimal portfolio performance is better than the market.
" The second hypothesis that "the results of evaluation methods for optimal investment portfolio performance" is not consistent with the results of the evaluation of the indicators used should be rejected " .
Conclusions
Through what was put forward in the theoretical and practical side, the researcher came to a set of conclusions are:
1 - The shares included in the composition of the optimal investment portfolio of banks listed in the Iraqi market for securities from one year to another during the period of research (2016-2007) were asymmetric as follows:
- 2007 (6) shares were entered only in the composition of the optimal investment portfolio.
2 - Among the most bank stocks entered in the composition of the optimal investment portfolio within the Iraqi stock market during the period of research 2016-2007 are the shares :
Islamic Bank
Available online: http://edupediapublications.org/journals/index.php/IJR/ P a g e | 725
- Union Bank. -United Bank. -Al - Mansour Bank. -Kurdistan Bank. -Al Ahli Bank of Iraq.
3 - The average return of the Iraqi market for securities fluctuated during the period of research (2016-2007). The average market return in 2007 was 0.03778 compared with the average market return in 2016 (0.00395), which in turn was a reason for "the instability of the Iraqi stock market during the period of research.
4 - Risk levels between banks are clearly fluctuating from year to year, but overall, the market risk increased in 2007 to (0.17964) compared to the market risk in 2016 as it decreased to (0.07545).
5. The results of the three rating methods (Sharp, Trainor, Jensen). for optimal portfolio performance are not consistent with the market portfolio from year to year.
6 - The results of the measurement proved that building the optimal investment portfolio in accordance with the model of one index leads to efficient performance of investors in the construction of their investment decisions by identifying the most desirable shares and composition of their investment portfolio, which is characterized by return and risk through the index Trainor compared to the rate of cutting.
7 - Sharp index is similar to the Trainor index because both use the excess return to the risk scale in the valuation of securities within the portfolio, But the Sharp index is consistent with the difficulty in forming a portfolio of good diversification because of the difficulty of eliminating the risk of non-systemic and depends on the standard deviation, and the Treinor index uses systemic risk beta.
Recommendations
Based on the conclusions reached through the research, we recommend a number of recommendations, the most important of which are:
1 - The need for investors to adopt the single-index method in building the optimal investment portfolio due to the high capacity of this model in reducing the type of data and quantity and the ability to produce good stocks that are good in building the portfolio to achieve the best performance for investment.
2 - The need to guide the Iraqi banks listed in the Iraqi stock market (which did not enter into building investment portfolios for the research sample years) on activating their financial and operational capabilities to achieve the efficiency necessary to enter the optimal investment portfolio through the creation of efficient operational and financial mechanisms.
3 - Increasing the awareness of investors and key players in the Iraqi stock market in the field of determining the effective limit and how to finalize it on the ground, through lessons and courses of application it in the internal and external markets.
4 - The necessity of Iraqi banks to seek and choose banking competencies capable of building banks in an efficient consistent with developments in the global banking sector.
5 - Pursuing by the management of the Iraqi stock market to raise the level of market performance by increasing the level of transparency and accuracy of information, which will reflect on the efficiency of the market.
Available online: http://edupediapublications.org/journals/index.php/IJR/ P a g e | 726
market to ensure the accuracy of the process of safety , secrecy and investment, which generates increased confidence by domestic and foreign investors in the market and thus will reflect on the volume of investment in the market.
A. Books:
1- Bodie Zvi, Kane, A,Marcus,A .
"Investments and portfolio
Management" 9th ed N.Y, McGraw –
Hill 2011.
2- Elton ,Edwin J. ,Martin J. Gruber, Stephen J. Brown, William N. Goetzmann '' Modern Portfolio Theory And Investment Analysis '' 9th, John Wiley & Sons Inc, Usa 2014.
3- Francis , jack Clark, & Taylor , Richard w. "Investments" , 6th Edition , CFA,university of new york, p. 265.2013.
4- Friedman, Jack P. "Dictionary of Business Terms " Third Edition , Barron's Educational Series, Inc.2000. 5- Horn by , A.S. “ Oxford Advanced
Learner's Dictionary ” 6th .ed, Oxford University Press 2010.
6- Jordan ,Bradford D. , Miller, Thomas
W., Jr. “Fundamentals of investments, valuation and management “ 5th edition , The McGraw-Hill/Irwin Series in Finance, Insurance and Real Estate , New York 2009.
7- Jordan ,Bradford D. , Miller, Thomas
W., Jr. “Fundamentals of investments, valuation and management “ 7th edition , The McGraw-Hill/Irwin Series in Finance, Insurance and Real Estate , New York 2013.
8- Reilly , Frank K. & Brown , Keith C. "Investment Analysis & Portfolio Management " , Tenth Edition, South-Western 2012..
9- Webster's , Merriam , “ Collegiate Dictionary “ 10th . ed , Merriam –
Webster , Incorporated 2003.
B. Thesis:
1- Bourdain , Daniel " Efficient Frontier And Capital Market Line On Psi20" Dissertation Master Of Science In Finance ,Lisboa School Of Economics Management, September 2015.
2- Chen , Yue " Tactical Portfolio Construction " Master thesis of Science in Statstics , University of California, Los Angeles 2012.
3- Levsauskaite, K. “Investment Analysis
and portfolio Management “ Vytautas
Magous University , Kaunas, Litbuania 2010.
4- Marios ,Livanos “Evaluation of mutual
funds performance using multiple
measures “ Master of Science (MSc) in
Financial Analysis for Executives , University of Piraeus Department of Banking and Financial Management 2014
C. Journals&Articles:
1-
Acma, Qamruzzaman “ ComparativeStudy on Performance Evaluation of Mutual Fund Schemes in Bangladesh:
An Analysis of Monthly Returns “
Journal of Business Studies Quarterly , Volume 5, Number 4 , 190-209, 2014.
2-
Ahmadinia, Hamed “ Examining Sharp,Sortino and Sterling Ratios in Portfolio Management, Evidence from Tehran
Stock Exchange” International Journal
of Business and Management, Vol. 6, No. 4; April 2011 .
3-
Jagric,Timotej , Boris Podobnikb,Sebastjan Strasek , Vita Jagric “ Risk -Adjusted Performance Of Mutual
Available online: http://edupediapublications.org/journals/index.php/IJR/ P a g e | 727
Europe Journal Of Economics 2 (233-244 ) ,2007.
4-
Nalini, R. " Optimal PortfolioConstruction Using Sharpe’s Single
Index Model - A Study Of Selected Stocks From Bse "International Journal of Advanced Research in Management and Social Sciences , Vol. 3 , No. 12 , December 2014.
5-
Poornima, S & Remesh, Aruna P" Construction of optimal portfolio usingSharpe’s single index model- A study with reference to banking & IT sector " , International Journal of Applied Research , 1(13): 21-24, 2015.
6-
Poornima, S,. Saranya PB "Anapplication of Sharpe’s, Jenson and Treynor’s models to analyse the
performance of growth funds "
International Journal of Applied Research ( IJAR), 2(1): 85-90,2016.
7-
Shariat,N& Ketabi,S. “Evaluating thePerformance of Top Companies Listed on Tehran Stock Exchange and Selecting the
Optimal Investment Portfolio”
International Business Management,| Volume: 10 | Issue: 7 | Page No.: 1207-1214 ,2016.
8-
Yang.D. Zhu,Y. “ Venture capital industry index portfolio Analysis”shanghai Martime university , Vol .11, No, 5. 2013.
D. Rebotes:
1- Bilaus,Bogdan "Portfolio Management for institutional investors" CFA Romania 2010.
2- Kidd , Deborah “Measures of
Risk-Adjusted Return: Let’s Not Forget Treynor and Jensen” CFA institute , 2011.
3- Taw ,Nay Pyi& Myanmar "Portfolio Investment (L6) " IMF Statistics