in Conventional T Cells Stimulated with Autologous Dendritic Cells
Derek J. Cavatorta,aHollis N. Erb,aand M. Julia Felippeb
Department of Clinical Sciencesaand Department of Population Medicine and Diagnostic Sciences,bCollege of Veterinary Medicine, Cornell University, Ithaca,
New York, USA
A defining feature of dendritic cells (DCs) is their ability to induce the proliferation of autologous T cells in the absence of
foreign antigen—a process termed the “autologous mixed leukocyte reaction” (AMLR). We report that equine
monocyte-derived DCs, but not macrophages, are potent inducers of the AMLR. The response is contact dependent and major
histo-compatibility complex class II dependent and primarily involves CD3
ⴙCD4
ⴙCD8
ⴚT cells. Upon stimulation with DCs or
the mitogen concanavalin A, a subset of the proliferating T cells expresses the regulatory T-cell (Treg) transcription factor
FoxP3. Although many of these FoxP3
ⴙT cells are capable of producing the effector cytokines interleukin-4 (IL-4) and
gamma interferon (IFN-
␥
), they are more likely to produce IL-10 and less likely to produce IFN-
␥
than equivalent FoxP3
ⴚcells. Therefore, FoxP3 expression is an inherent component of equine T cell activation and is associated with a more
im-munosuppressive cytokine profile. These results confirm that FoxP3 expression in the horse, in contrast to the mouse, is
regulated similarly to FOXP3 expression in humans and provide evidence that FoxP3 expression by conventional T cells
may help regulate the developing immune response.
D
endritic cells (DCs) represent a heterogeneous population
of innate immune cells specialized in
immunosurveil-lance, antigen presentation, and initiation of the adaptive
im-mune response. DCs are uniquely capable of stimulating naive
T cells and can generate a variety of effector responses, anergy,
or tolerance (
34
). Therefore, DCs are an essential component
of a successful immune response, and a detailed understanding
of the interactions between DCs and T cells is relevant to many
areas of immunology.
DCs take up antigen from the peripheral tissues, process it, and
present it to naive T cells in the draining lymph node. Depending
on the local cytokine environment during DC-mediated T cell
activation, the antigen-specific T cell can proliferate and
differen-tiate into one of a variety of effector T cell phenotypes, including
(i) gamma interferon (IFN-
␥
)-producing Th1 cells that are
im-portant for immunity to intracellular pathogens and tumors; (ii)
interleukin-4 (IL-4)-, IL-5-, and IL-13-producing Th2 cells that
promote antibody production, help prevent parasitic diseases,
and are involved in allergic responses; and (iii) IL-17-producing
Th17 cells that protect against extracellular infections (
58
). DCs
also play a critical role in immune regulation because they are
capable of both expanding thymus-derived FoxP3
⫹(designated
FOXP3 in humans) natural regulatory T cells (nTregs) and
induc-ing naive T cells to develop into induced regulatory T cells (iTregs)
in the periphery (
55
,
56
). In turn, Tregs use a variety of
mecha-nisms (such as the production of the anti-inflammatory cytokines
IL-10 and transforming growth factor

[TGF-

]) to keep effector
responses in check and to prevent immune-mediated disease (
7
).
DCs also possess the unique ability to efficiently induce
prolif-eration of autologous T cells in the absence of exogenous antigen.
This process was first demonstrated with murine DCs several
de-cades ago and was termed the “autologous mixed leukocyte
reac-tion” (AMLR) (
39
). The AMLR has since been described with
human cells and is thought to represent polyclonal activation of
autoreactive T cells specific for self-antigens presented by DCs (
2
,
3
,
10
,
38
,
44
). Interestingly, the AMLR displays characteristics of a
normal immune response (including specificity and memory) and
is reduced in a variety of human disease states (
23
,
53
).
Further-more, the self-reactive T cells in the AMLR demonstrate a capacity
for immunosuppression and increased transcription of the Treg
transcription factor FOXP3, suggesting that such DC-stimulated
T cells are involved in immune regulation during the normal
im-mune response
in vivo
(
25
,
45
,
51
).
A protocol for generating monocyte-derived DCs has been
de-scribed in the horse, and the phenotype of these cells has been
characterized by several groups (
9
,
12
,
19
). However, relatively
little is known about the ability of equine DCs to induce
prolifer-ation and differentiprolifer-ation of autologous T cells. Our objective in
the present study was to monitor the magnitude and nature of the
equine DC-induced AMLR. Previously, a detailed analysis of this
interaction was limited by the use of heterogeneous cell
popula-tions and [
3H]thymidine proliferation assays. We developed a
method for isolating and coculturing relatively pure populations
of equine monocyte-derived DCs with autologous
5,6-carboxy-fluorescein diacetate succinimidyl ester (CFSE)-stained
periph-eral blood T cells. We used multicolor flow cytometry to measure
T cell proliferation, surface marker expression, and cytokine
pro-duction.
We found that equine DCs potently induced the AMLR in the
absence of foreign antigen. The AMLR-responsive T cells
exhib-ited activation-induced FoxP3 expression— confirming that
FoxP3 is regulated similarly in horses and humans and is an
in-herent component of T cell activation and proliferation.
Further-Received21 May 2012Returned for modification15 June 2012
Accepted25 July 2012
Published ahead of print1 August 2012
Address correspondence to M. Julia Felippe, mbf6@cornell.edu.
Copyright © 2012, American Society for Microbiology. All Rights Reserved.
doi:10.1128/CVI.00308-12
on August 17, 2020 by guest
http://cvi.asm.org/
more, the induced expression of FoxP3 by activated T cells was
associated with a regulatory cytokine profile. This analysis
con-tributes to our knowledge of the early events in the immune
re-sponse, including concomitant regulatory mechanisms, with
po-tential implications for immunotherapeutic strategies (
11
).
MATERIALS AND METHODS
Monocyte isolation and generation of DCs.Peripheral blood was col-lected into 10-ml heparinized Vacutainer tubes (Becton Dickinson, Franklin Lakes, NJ) by jugular venipuncture from healthy adult horses according to an approved Institutional Animal Care and Use Committee (IACUC) protocol. Peripheral blood mononuclear cells (PBMC) were isolated via 1077 Ficoll-Paque (Amersham Biosciences, Piscataway, NJ) density centrifugation at 700⫻gfor 15 min. We modified previously described magnetic bead positive selection and plastic adherence proto-cols to perform monocyte isolation (12,46). Briefly, 108PBMC were
labeled with anti-equine CD14 monoclonal antibody (MAb; hybridoma clone 105, kindly provided by Bettina Wagner, Cornell University, Ithaca, NY) (26), washed with phosphate-buffered saline (PBS), incubated with anti-mouse IgG1 microbeads (Miltenyi Biotech, Bergisch Gladbach, Ger-many), and positively selected over an LS column (Miltenyi Biotech) ac-cording to the manufacturer’s protocol. To reduce nonspecific binding, the cells were labeled in buffer containing 10% heat-inactivated autolo-gous serum (AS), and the column was pretreated with 500l of AS as described previously (48). Fetal bovine serum (FBS) was used instead of AS where indicated to evaluate lymphocyte proliferation in the presence of bovine proteins. Three million CD14⫹cells were plated onto a 35-mm petri dish (Fisher Scientific, Pittsburgh, PA) in 3 ml of Aim-V medium (Gibco-Invitrogen, Grand Island, NY) with 10% AS and allowed to adhere for 1 h at 5% CO2and 37°C. Nonadherent cells were removed by gentle
washing with Dulbecco modified Eagle medium plus F-12 medium (DMEM-F12; Gibco-Invitrogen). DCs were produced by culturing the adherent monocyte-enriched population (⬃2.5⫻106cells) in 3 ml of
DMEM-F12 complete medium (Gibco-Invitrogen) supplemented with 10% AS, 1⫻antibiotics/antimycotics (Gibco-Invitrogen), 10 ng of re-combinant equine IL-4 (rEqIL-4; kindly provided by David Horohov, University of Kentucky, Lexington, KY)/ml, and 50 ng of recombinant human granulocyte-macrophage colony-stimulating factor (rHuGM-CSF; R&D Systems, Minneapolis, MN)/ml for 3 days at 5% CO2and 37°C
(19). For comparison, macrophages were generated by culturing mono-cytes in complete medium with 10% AS, 1⫻antibiotics/antimycotics, and no exogenous cytokines.
Autologous T cell isolation and CFSE staining.On the third day of DC culture, blood was collected from the same horse and PBMC were isolated via 1077 Ficoll-paque density centrifugation. For negative selec-tion of peripheral blood T cells, monocytes and neutrophils were depleted with anti-canine CD172a (hybridoma clone SWC3, VMRD, Pullman, WA) (22), and B cells were depleted with anti-human CD21 (hybridoma clone B-ly4; Becton Dickinson) (33). A total of 108PBMC were labeled
with anti-canine CD172a and anti-human CD21, washed in PBS, incu-bated with anti-mouse IgG1 microbeads, and eluted from an LD column according to the manufacturer’s protocol (Miltenyi Biotech). The puri-fied T cells were washed in PBS, resuspended in 0.25M CFSE (Sigma-Aldrich, St. Louis, MO) diluted in PBS, and incubated on a spinning rack at room temperature in the dark for 10 min (14). An equal volume of FBS (Gibco-Invitrogen) was added to inactivate the extracellular CFSE, and the cells were washed three times in PBS and then resuspended in lym-phocyte proliferation medium consisting of RPMI 1640 medium (Gibco-Invitrogen) enriched with 10% AS, 25M 2-mercaptoethanol (Sigma-Aldrich), and 1⫻antibiotics/antimycotics (Gibco-Invitrogen).
DC harvest.On day 3 of culture, nonadherent DCs were removed by washing the wells with PBS and saved. Adherent cells were treated with 1 ml of Accumax (Millipore, Temecula, CA) at room temperature for 5 min and gently removed with a cell lifter. The adherent and nonadherent cells were pooled, washed in PBS, and resuspended in lymphocyte
prolifera-tion medium. Cell viability was assessed by 0.4% trypan blue exclusion (Gibco-Invitrogen) and was consistently⬎90%.
Autologous mixed leukocyte reaction.Purified, CFSE-stained T cells were plated in a 96-well, flat-bottom tissue culture plate (Becton Dickin-son) at a concentration of 3⫻105cells in 300l of lymphocyte
prolifer-ation medium. A total of 6⫻103DCs were added to the appropriate wells
(1 DC:50 T cells). Positive control wells were treated with 5g of conca-navalin A (ConA; Sigma-Aldrich)/ml. All treatments were performed in triplicate for each horse. For the antibody-blocking experiment, 50l of anti-equine major histocompatibility complex (MHC) class II MAb (CZ11 hybridoma clone 130.8 E8D9, kindly provided by Douglas Antc-zak, Cornell University, Ithaca, NY) was added to each of three wells on days 0 and 3 of culture. Samples assayed for cytokine production were treated with 40 ng of phorbol myristate acetate (PMA; Sigma-Aldrich)/ ml, 1g of ionomycin (Sigma-Aldrich)/ml, and 10g of brefeldin A (Sigma-Aldrich)/ml for the last 5 h of culture. Unless otherwise indicated, all samples were harvested on day 6 or 7 of culture and grown in medium containing 10% AS.
Transwell assay.DCs and CFSE-stained T cells were cultured in lym-phocyte proliferation medium in a 96-multiwell insert system (Becton Dickinson). Because the surface area of the flat-bottom receiver plate was twice that of the 96-well tissue culture plate used for the previous DC-T cell cocultures, 6⫻105T cells and 1.2⫻104DCs were plated to achieve
the same cell density and DC/T cell ratio. DCs were either absent, sepa-rated from the T cells by a polyethylene terephthalate (PET) membrane with 1-m pores, or cultured together with the T cells in the receiver plate. Flow cytometry.We analyzed all samples on a FACSCalibur flow cy-tometer (Becton Dickinson) equipped with argon-ion and red-diode lasers. DCs and macrophages were harvested after 3 days of culture as described, and surface marker expression was measured by incubating the cells with MAbs against equine MHC class II (CZ11 hybridoma clone 130.8 E8D9), equine CD14 (hybridoma clone 105), human CD86 (phy-coerythrin [PE]-conjugated hybridoma clone 2331; Becton Dickinson) (19), or human CD206 (PE-conjugated hybridoma clone 3.29B1.10; Beckman Coulter, Fullerton, CA) (47). The cells were washed, and the unconjugated primary MAbs were labeled with fluorescein isothiocya-nate-conjugated anti-mouse IgG secondary antibody (Jackson Immu-noresearch, West Grove, PA). T cell proliferation was quantified by mea-suring the percentage of CFSEdimcells in the lymphocyte-gated area. Cell
surface marker expression was analyzed by incubating the cells with MAbs against equine CD3 (hybridoma clone F6G3.3; Stott Lab, UC Davis), CD4 (hybridoma clone HB61A, VMRD), CD8 (hybridoma clone HT14A, VMRD), MHC class II (CZ11 hybridoma clone 130.8 E8D9), or an isotype control (mouse anti-parvovirus, kindly provided by Colin Parrish, Cor-nell University, Ithaca, NY), followed by a PE-conjugated anti-mouse IgG secondary antibody (Jackson Immunoresearch). Intracellular protein expression was measured after the permeabilization of cells with a sapo-nin-based reagent (Cytofix/Cytoperm kit; Becton Dickinson). Cells were labeled with PE-conjugated anti-mouse/rat FoxP3 (hybridoma clone FJK-16S; eBioscience, San Diego, CA) (43) or rat IgG2a isotype control (hy-bridoma clone eBR2a; eBioscience). Samples incubated with anti-mouse/ rat FoxP3 antibody were also stained for expression of Alexa 647-conjugated anti-equine IL-4 (hybridoma clone 12H8; Wagner Lab, Cornell University), anti-equine IL-10 (hybridoma clone 492-2; Wagner Lab, Cornell University), or anti-bovine IFN-␥(hybridoma clone CC302; AbD Serotec, Oxford, United Kingdom) (6).
Statistical analysis.For each analysis, a Shapiro-Wilk test was used to determine whether data were Gaussian and the appropriate para-metric or nonparapara-metric analysis was performed using Statistix 9.0 software (2008 Analytical Software, Tallahassee, FL). Pairedt tests were used to compare the ability of DCs and macrophages to induce the AMLR (two-sided), to test whether proliferating T cells increased MHC class II expression (one-sided), and to compare cytokine pro-duction between FoxP3⫺and FoxP3⫹cells (two-sided). A Spearman’s rank correlation was used separately for AS and FBS samples to
on August 17, 2020 by guest
http://cvi.asm.org/
sure the correlation between DC dose and T cell proliferation, and a Wilcoxon rank-sum test was used to test for the effect of serum on T cell proliferation. Multiplettests were performed to analyze the AMLR kinetics (two-sided), and separate ttests were performed for each horse to measure the effect of the transwells (two-sided) and treatment with class II MHC MAb (one-sided to compare treated versus un-treated, two-sided to compare treated to baseline) on T cell prolifera-tion. For all analyses, an overallPvalue of 0.05 (two-sided) was used to indicate significance, and Bonferroni adjustments to the overall P
value were used to account for multiple comparisons.
RESULTS
Monocyte and T cell isolation can be obtained by magnetic
sort-ing.
To facilitate analysis of the interaction between equine
mono-cyte-derived DCs and autologous T cells, we established a protocol
for developing enriched cell populations using magnetic sorting.
We isolated PBMC from healthy adult horses by Ficoll gradient
centrifugation (
Fig. 1A
), and purified monocytes by positive
se-lection and plastic adherence. More than 90% of the cells were
within the monocyte gate, and all gated cells were CD14
⫹(
Fig.
1B
). Monocytes were cultured in complete medium
supple-mented with rHuGM-CSF and rEqIL-4 to generate equine
mono-cyte-derived DCs. On day 3 of DC culture, PBMC were again
obtained from the same horse, and autologous T cells were
puri-fied by negative selection. More than 95% of the eluted cells were
detected within the lymphocyte gate, and more than 95% of these
cells were CD3
⫹(
Fig. 1C
). The T cells were stained with CFSE,
cocultured with autologous DCs, and monitored for proliferation.
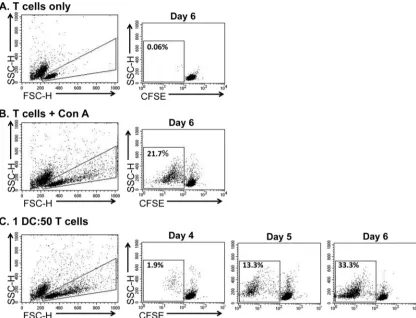
Equine DCs induce proliferation of autologous T cells in the
absence of exogenous antigen.
As expected, minimal
prolifera-tion was detected in cultures of nonstimulated T cells (
Fig. 2A
),
and a reliable proliferative response was present in T cell cultures
stimulated with ConA (
Fig. 2B
). However, DCs induced
autolo-gous T cell proliferation in the absence of exogenous antigen (
Fig.
2C
). Of note, the DC-stimulated, proliferating T cells (
Fig. 2C
, cell
population within 10
0and 10
1fluorescence) further diluted the
CFSE in comparison to the ConA-stimulated, proliferating T cells
(
Fig. 2B
, cell population within 10
1and 10
2fluorescence) on day 6
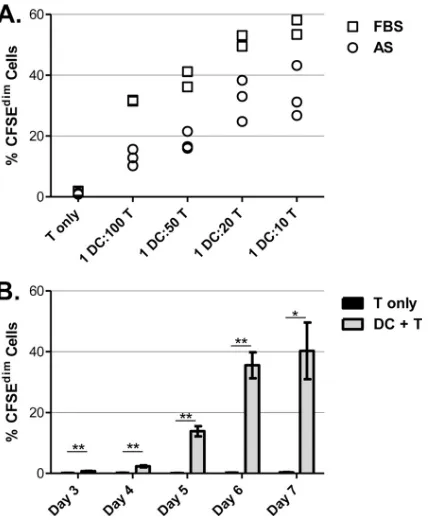
of culture. The degree of T cell proliferation was highly correlated
with the DC concentration when the cells were grown in medium
with 10% AS (r
⫽
0.94,
P
⬍
0.0001) or 10% FBS (r
⫽
0.98,
P
⬍
0.0001) (
Fig. 3A
). Furthermore, T cell proliferation was greater in
cultures grown in medium supplemented with FBS compared to
AS when data were grouped by serum treatment (P
⫽
0.02). When
the cells were cocultured at a ratio of 1 DC to 50 T cells, a
signifi-cant increase in T cell proliferation over nonstimulated controls
was detected starting on day 3 of culture (P
⫽
0.003) and was
greatest on day 6 (
Fig. 3B
). T cells cultured in the absence of DCs
did not proliferate over baseline levels at any time point tested
(P
⬎
0.045, which is nonsignificant with the Bonferroni-corrected
P
value).
DCs stimulate T cells in a contact-dependent, MHC class
II-dependent manner.
We attempted to determine the nature of the
DC stimulatory signal in the AMLR because some cells (such as
memory T cells) can undergo homeostatic proliferation in the
presence of DC-derived cytokines (
18
). We used a transwell
sys-tem to prevent direct contact between DCs and T cells while
per-mitting diffusion of cytokines between the two cell types. When
direct contact with DCs was prevented by a permeable membrane,
T cell proliferation was reduced to background levels (both
P
⬍
0.005) (
Fig. 4A
). Preventing T cell receptor (TCR) recognition of
MHC class II-peptide complexes with anti-MHC class II blocking
antibody decreased T cell proliferation significantly (all
P
ⱕ
0.02)
in all horses tested, but not completely to baseline levels in one of
three horses (P
⫽
0.045, which is nonsignificant with the
Bonfer-roni-corrected
P
value) (
Fig. 4B
).
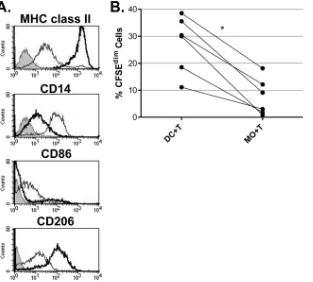
DCs are more potent inducers of the AMLR compared to
macrophages.
The ability to efficiently induce the AMLR is a
defining characteristic of DCs (
15
,
39
,
44
). Therefore, we
wanted to compare the ability of equine monocyte-derived
DCs and macrophages to induce the proliferation of
autolo-gous T cells in the absence of foreign antigen. Flow cytometric
phenotyping revealed that DCs were MHC class II
highCD14
dimcells (
Fig. 5A
). Most DCs were CD86
⫺CD206
high, which is
consistent with an immature phenotype, although a subset (ca.
10 to 30%) of cells were CD206
lowCD86
⫹mature DCs. In
contrast, macrophages were MHC class II
lowCD14
highCD86
lowCD206
lowcells and consistently included a small population
(
⬍
5%) of cells with increased expression of MHC class II. As
expected from these phenotypic profiles, equine DCs were
FIG 1Flow cytometric dot plot and histogram analyses of peripheral blood cell sorting. Forward scatter (FSC) versus side scatter (SSC) dot plots of pre-sorted PBMC (A), positively selected, adherent CD14⫹monocytes (B), and negatively selected CD3⫹T cells (C) are shown. Region 1 (R1), lymphocyte gate; region 2 (R2), monocyte gate; region 3 (R3), neutrophil gate, based on cell size and granularity and cell-lineage surface marker staining. Percentage values indicate the percentage of total cells within each gate. Histogram analyses show the fluorescence intensity for CD14⫹cells (B, M2) and CD3⫹cells (C, M2); negative cells are within the M1 region.
on August 17, 2020 by guest
http://cvi.asm.org/
more potent inducers of T cell proliferation in the AMLR
com-pared to macrophages (P
ⱕ
0.002) (
Fig. 5B
).
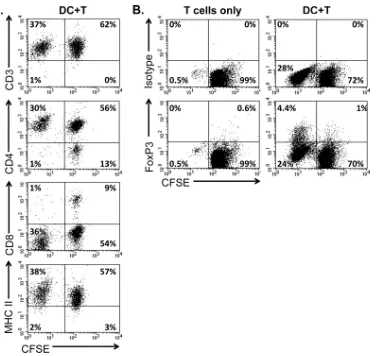
Proliferating T cells in the AMLR are primarily CD3
ⴙCD4
ⴙCD8
ⴚT cells.
CFSE-stained, DC-stimulated T cells were labeled
with surface markers to characterize the proliferating T cell
pop-ulation after 6 days of culture. As expected, virtually all cells in the
lymphocyte gate were CD3
⫹T cells (
Fig. 6A
). The proliferating
CFSE
dimcells were primarily CD4
⫹CD8
⫺T cells. The T cells were
positive for MHC class II, a feature demonstrated previously for
adult equine T cells, and MHC class II expression was increased in
the proliferating cells (P
⫽
0.05), a finding consistent with an
activated phenotype (
4
,
30
).
A subset of DC-stimulated T cells expresses FoxP3.
Murine
DCs induce expansion of nTregs and differentiation of naive T
cells to become FoxP3
⫹iTregs by presenting self-antigens in the
periphery (
37
). Because the T cells in the equine AMLR appeared
to be responding to DCs in the absence of exogenous antigen, we
measured their expression of the Treg transcription factor FoxP3.
A subset of the proliferating T cells (5 to 15%) expressed FoxP3
after 6 days of culture with autologous DCs (
Fig. 6B
).
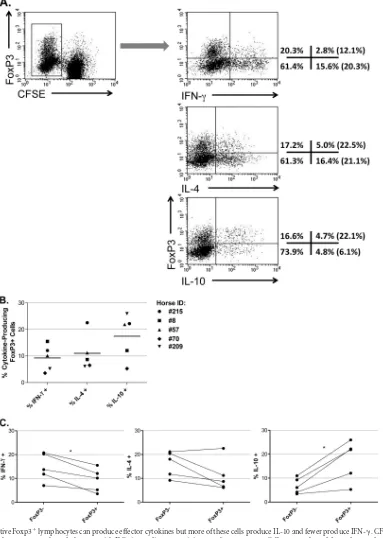
Proliferating FoxP3
ⴙcells can produce effector cytokines
but more of these cells produce IL-10 and fewer produce IFN-
␥
.
Although initial experiments in mice lead researchers to believe
that FoxP3 is a Treg-specific transcription factor, accumulating
evidence suggests that FOXP3 is also expressed transiently in
ac-tivated human conventional T cells (
50
). In addition, mitogenic
stimulation increases FoxP3 expression in equine peripheral
blood T cells (
43
). Therefore, acquisition of FoxP3 expression in
DC-stimulated equine T cells might simply be a transient marker
of cellular activation and might not be associated with a regulatory
phenotype. To investigate this question further, we treated
DC-stimulated, CFSE-stained T cells with PMA plus ionomycin and
compared cytokine production by CFSE
dimFoxP3
⫹cells with that
of CFSE
dimFoxP3
⫺cells (
Fig. 7A
.). We found that approximately
equivalent subpopulations of FoxP3
⫹T cells were capable of
pro-ducing the effector cytokines IFN-
␥
and IL-4, as well as the
regu-latory cytokine IL-10 (
Fig. 7B
). However, compared to the
FoxP3
⫺cells, more of the FoxP3
⫹cells produced IL-10 (P
⫽
0.015) and fewer produced IFN-
␥
(P
⫽
0.013) (
Fig. 7C
). Both cell
populations contained statistically equivalent numbers of
IL-4-competent cells (P
⫽
0.095). Approximately 60% of the FoxP3
⫹and FoxP3
⫺cells did not express detectable levels of IFN-
␥
, IL-4,
or IL-10.
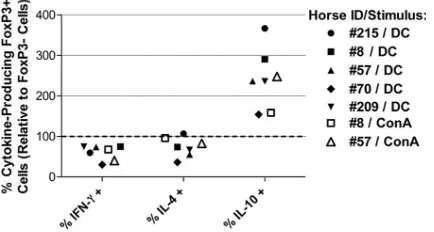
Cytokine production by FoxP3
ⴙversus FoxP3
ⴚcells is
sim-ilar after stimulation with DCs or ConA.
DCs in humans and
mice can adopt a tolerogenic phenotype and promote the
differ-FIG 2DCs induce the proliferation of autologous T cells. CFSE-stained T cells were nonstimulated (A), ConA-stimulated (B), or cocultured with DCs (C) in medium containing autologous serum. Samples were harvested on days 4 through 6 of culture for analysis by flow cytometry. Flow cytometric dot plots (FSC versus SSC) were used to exclude dead cells by gating on lymphocytes and proliferating blast cells. Dot plots (CFSE fluorescence versus SSC) were made for the gated lymphocytes. Nonstimulated lymphocytes were used to determine the fluorescence intensity for nonproliferating cells (CFSEhigh) and proliferating cells (CFSEdim). The percentage of proliferating cells within the CFSEdimregion was calculated for each treatment. Note the dim fluorescence intensity of DC-stimulated proliferating T cells (C) compared to ConA-DC-stimulated proliferating T cells (B) on day 6.
on August 17, 2020 by guest
http://cvi.asm.org/
entiation and expansion of Treg populations (
29
,
57
). Therefore,
we wondered whether the regulatory cytokine profile detected in
DC-stimulated FoxP3
⫹T cells was triggered by DC-derived
sig-nals or whether it was an inherent component of T cell activation
and proliferation in the horse. We compared cytokine production
by CFSE
dimFoxP3
⫹cells to that by CFSE
dimFoxP3
⫺cells in
DC-or ConA-stimulated T cell cultures. Cells were cultured fDC-or 6 days
and stimulated with PMA and ionomycin prior to analysis.
Simi-lar to the DC-stimulated samples, more of the ConA-stimulated
FoxP3
⫹cells produced IL-10, and fewer produced IFN-
␥
(
Fig. 8
).
DISCUSSION
In this study, we showed that equine monocyte-derived DCs, but
not macrophages, were capable of stimulating the AMLR in the
absence of foreign antigen. To our knowledge, this is the first
description of the AMLR in the horse. As in humans and mice, the
equine AMLR was contact and MHC class II dependent and
pri-marily involved CD3
⫹CD4
⫹CD8
⫺T cells (
24
,
27
). Equine DCs
express high levels of MHC class II, contain a subpopulation of
cells with a mature flow cytometric phenotype, and more potently
induce the AMLR compared to macrophages (
9
). This confirms
the superior antigen-presenting and costimulatory capacity of
equine DCs, because the AMLR requires DC expression of CD86
and MHC class II (
44
). The low levels of T cell proliferation
mea-sured in the macrophage cocultures might be due to the presence
of small numbers of contaminating DCs consistently detected as
MHC class II
highcells by flow cytometric phenotyping. These
could be unsorted DCs from peripheral blood or spontaneously
differentiated, monocyte-derived DCs (
21
).
The demonstration that T cell proliferation in the AMLR was
contact and MHC class II dependent confirms that these cells were
not exclusively responding to DC-derived cytokines. Instead, the
T cells responded through the TCR to antigens presented by DCs.
T cell proliferation was highly correlated with DC dose and, at a
DC/T cell ratio of 1:50, was detectable by day 3 of culture.
Maxi-mum proliferation of T cells was detected around day 6, a finding
suggestive of a primary T cell stimulation. Other researchers have
shown that the murine AMLR peak response occurred around day
7 in primary cultures but, upon restimulation of T cells with fresh
DCs, T cell proliferation peaked on day 3 (
53
).
T cell proliferation was greater in FBS than in AS (
8
).
There-FIG 3T cell proliferation correlates with DC/T cell ratio and increases with time of incubation. (A) Approximately 3⫻105CFSE-stained T cells from a single horse were cocultured alone or with various concentrations of autolo-gous DCs (DC/T cell ratios 1:100, 1:50, 1:20, 1:10) in culture medium contain-ing autologous serum (AS) or fetal bovine serum (FBS). FBS was used instead of AS where indicated to evaluate lymphocyte proliferation in the presence of bovine proteins. The percentage of proliferating T cells (CFSEdim) was mea-sured after 6 days of culture by flow cytometry. Experiments were performed in triplicate (AS, open circles) or duplicate (FBS, open squares). (B) CFSE-stained T cells from a single horse were cultured alone (black bars) or with DCs (gray bars) at a ratio of 1 DC to 50 T cells, and the proliferation was monitored daily between days 3 and 7 of incubation. Each treatment was performed in triplicate. Bars represent the means and standard deviations of proliferating cells (% CFSEdim), and values for the two treatment groups were compared. *,
P⬍0.05; **,P⬍0.01.
FIG 4T cell proliferation requires DC contact and is MHC class II dependent. (A) Using a transwell system, CFSE-stained T cells were cultured in the bottom chamber either alone (T only), combined with DCs (DC⫹T together), or separated from DCs by a permeable membrane (DC⫹T separate). Cells from two different horses were cultured in medium containing autologous serum for 7 days, in triplicate. Bars represent the means and standard deviations of the percent proliferating cells (% CFSEdim). The samples with T cells alone were cultured as a control and were not included in the statistical analysis. (B) CFSE-stained T cells were cultured alone (T only), with DCs (DC⫹T), or with DCs plus anti-equine MHC class II MAb (DC⫹T⫹MHCII MAb). Cells from three different horses were cultured in medium containing autologous serum for 5 to 7 days, in triplicate. Bars represent the means and standard deviations of the percent proliferating cells (% CFSEdim). *,P⬍0.02; **,P⬍0.005. “a” indicates the MAb-treated group is not equal to T only (P⬍0.02).
on August 17, 2020 by guest
http://cvi.asm.org/
fore, a subset of the T cells proliferating in FBS might be specific
for foreign serum-derived antigens presented by DCs. In contrast,
T cells cultured with DCs in AS are likely responding to
autoanti-gens from self-proteins (
38
). This is supported by the kinetics of
CFSE dilution, which shows that a small percentage of
DC-stim-ulated T cells are CFSE
dimat early time points and, by day 6 of
culture, have markedly diluted the CFSE. In contrast,
ConA-stim-ulated samples have a similar percentage of CFSE
dimT cells by day
6, but these cells are 1 log brighter in their CFSE fluorescence.
These data suggest that DCs stimulate a distinct, potentially
auto-reactive T cell population that undergoes multiple rounds of
pro-liferation, whereas ConA stimulates fewer replication cycles in a
larger, nonspecific population of cells. The presence of
autoreac-tive T cells in the peripheral blood can be explained by the known
imperfections in thymic negative selection and the suspected
cross-reactivity of the TCR (
13
,
32
). Also, DCs may activate
auto-reactive T cells by presenting cryptic epitopes resulting from
caspase modification of self-proteins from nearby apoptotic cells
(
2
,
3
,
10
).
We became interested in the presence of Tregs in our equine
DC-T cell cocultures because Tregs are often specific for
self-an-tigen and because of the aforementioned suppressive capacity of
AMLR-stimulated human T cells. We found that a subset of the
DC-stimulated, proliferating T cells (5 to 15%) expressed the Treg
transcription factor FoxP3. It was unclear whether these cells were
truly Tregs because in humans, unlike in mice, conventional T
cells transiently upregulate FOXP3 upon cellular activation in the
absence of exogenous TGF-

(
16
). Similarly, increased FoxP3
lev-els were reported in mitogen-stimulated canine and equine
PBMC, suggesting that FoxP3 gene expression is regulated
simi-larly to humans in these species (
36
,
43
). To further investigate the
role of FoxP3 in the DC-stimulated samples, we measured
cyto-kine production and found that approximately equivalent
num-bers of the proliferating FoxP3
⫹cells were capable of producing
IFN-
␥
, IL-4, and IL-10. This finding confirms that suppressive
and effector phenotypes exist concurrently within the FoxP3
⫹population (
43
). However, compared to the proliferating FoxP3
⫺cells, more of the proliferating FoxP3
⫹cells produced IL-10 and
fewer produced IFN-
␥
. If FoxP3 were simply a marker of
activa-tion with no funcactiva-tional significance, the cytokine profile of both
groups of cells would be identical. Instead, the FoxP3
⫹cells
pro-duced a more immunosuppressive cytokine profile,
demonstrat-ing that FoxP3 expression was associated with a regulatory
tran-scriptional program in at least some of the proliferating cells. This
is likely mediated by the inhibitory effect of FoxP3 on IFN-
␥
ex-pression (
5
). Interestingly, a similar regulatory cytokine profile
was also enriched in proliferating FoxP3
⫹cells after polyclonal
stimulation with ConA. Therefore, the expansion of FoxP3
⫹cells
and the associated alterations in cytokine production are not
in-duced by DC-specific signals but are, instead, an inherent
charac-teristic of equine T cell activation and proliferation. Measuring
TGF-

production by these cells would also be interesting since
FIG 5DCs are more efficient inducers of the AMLR compared to macrophages. (A) DCs and macrophages (MOs) were harvested after 3 days of culture in medium containing autologous serum and stained for surface expression of MHC class II, CD14, CD86, or CD206. Histogram analyses were made to compare expression of each surface marker between DCs and macrophages. Shaded region, isotype control; wide line, DCs; thin line, macrophages. The data are representative of four independent experiments. (B) CFSE-stained T cells from five different horses (one horse was used twice) were cultured with DCs or MOs. Cells were cultured in medium containing autologous serum for 6 to 7 days, in triplicate. Each data point represents the mean percentage of proliferating cells (% CFSEdim) for each horse, and values for each treatment group were compared. Lines that indicate DC and MO data are from the same horse. *,Pⱕ0.002.
on August 17, 2020 by guest
http://cvi.asm.org/
the production of this cytokine is a specific marker of regulatory
activity, but this was not performed due to a lack of appropriate
reagents.
The FoxP3
⫹cells following ConA or DC stimulation either
represent the expansion of preexisting nTregs, the induction of
FoxP3 in activated conventional T cells, or a combination of the
two. Although ConA stimulation induces some expansion of
pre-existing nTreg populations in the dog, the vast majority of the
FoxP3
⫹cells following polyclonal mitogenic stimulation are
acti-vated conventional T cells (
41
). In addition, because nTregs do
not proliferate readily, the CFSE
dimFoxP3
⫹cells analyzed in our
experiments likely represent activated conventional T cells (
42
).
Future analysis of expression of Helios (a recently described
nTreg-specific transcription factor) might verify this distinction
(
49
). Taken together, these results indicate that FoxP3 expression
in activated equine conventional T cells is associated with a
regu-latory cytokine profile. The demonstration that FoxP3 is
upregu-lated following DC stimulation proves that this effect is not
mito-gen exclusive and supports the concept that FoxP3 might be
induced during conventional T cell stimulation
in vivo.
Conflicting results have been reported in experiments
measur-ing the suppressive capabilities of human FOXP3
⫹conventional T
cells (
28
,
31
,
35
,
40
,
52
). The functional immunosuppressive
sig-nificance of transient, activation-induced FOXP3 expression is
therefore suspect. However, the possibility that FOXP3
⫹effector
T cells help to fine-tune the developing immune response is an
attractive hypothesis that cannot be discounted, particularly
be-cause transduction of FOXP3 in naive human T cells imparts a
regulatory phenotype (
31
,
54
). This is supported by the recent
finding that stimulation of conventional equine T cells induced a
population of CD4
⫹CD25
⫹T cells that were functionally
sup-pressive and did not proliferate (
20
). However, these cells were
activated in the presence of TGF-

, so they may represent true
Tregs rather than activated conventional T cells with transient
Treg-like characteristics (
40
). In other studies, activation-induced
FOXP3 expression was insufficient to inhibit IFN-
␥
production
by human effector T cells (IL-4 and IL-10 were not measured) (
1
,
17
). This finding likely contrasts with our data because our
anal-ysis focused exclusively on the proliferating cells rather than both
proliferating and nonproliferating populations. This allowed us to
measure FoxP3 and cytokine expression only in the relevant,
DC-or ConA-responsive cells.
We report herein that equine monocyte-derived DCs are
capa-ble of inducing the AMLR. This response should be considered
FIG 6AMLR induces proliferation of CD4⫹T cells, including a subpopulation of FoxP3⫹cells. CFSE-stained T cells were cultured alone or with DCs in medium containing autologous serum. Cells were harvested after 6 days of incubation and stained for the surface expression of CD3, CD4, CD8, or MHC class II (A) or permeabilized and stained for intracellular levels of FoxP3 or a negative isotype control (B). Cells within the lymphocyte gate were analyzed, and the percent cells within each quadrant are shown. The data are representative of five independent experiments.
on August 17, 2020 by guest
http://cvi.asm.org/
when measuring the ability of DCs to induce an antigen-specific T
cell response
in vitro. We also found that equine DCs stimulate the
proliferation of autologous, potentially autoreactive helper T cells
and that a subset of these cells exhibits activation-induced FoxP3
expression, which is associated with an immunoregulatory
cyto-kine profile. Such activation-induced FoxP3 expression is an
in-herent component of proliferating equine T cells and might help
regulate the developing immune response
in vivo. These findings
FIG 7AMLR-reactive Foxp3⫹lymphocytes can produce effector cytokines but more of these cells produce IL-10 and fewer produce IFN-␥. CFSE-stained T cells from five different horses were cultured alone or with DCs in medium containing autologous serum. Cells were cultured for 6 days and treated with PMA, ionomycin, and brefeldin A for the last 5 h of culture. Cells were harvested, permeabilized, and stained for FoxP3 expression and cytokine production (IFN-␥, IL-4, or IL-10). (A) Cells were gated for proliferation (CFSEdim), and cytokine profiles were measured for FoxP3⫹and FoxP3⫺cells. The percent cells within each quadrant are shown (FoxP3⫹, upper left and right quadrants; FoxP3⫺, lower left and right quadrants). Values in parenthesis indicate the percentages of FoxP3⫹ or FoxP3⫺cells that are positive for each cytokine. (B) Cytokine production by FoxP3⫹cells. Bars represent mean percentage of cytokine-producing cells. (C) Cytokine production was compared between FoxP3⫹and FoxP3⫺cells. Lines indicate that FoxP3⫹and FoxP3⫺data are from the same horse. *,Pⱕ0.015.
on August 17, 2020 by guest
http://cvi.asm.org/
are relevant to the human immune system because FoxP3
expres-sion is regulated similarly in humans and horses.
ACKNOWLEDGMENTS
D.J.C. was supported by an Institutional Ruth L. Kirschstein National Research Service Award from the National Center for Research Resources T32RR007059. This study was partially funded by the Harry M. Zweig Memorial Fund for Equine Research.
We thank Mary Beth Matychak for laboratory technical expertise and Rebecca Tallmadge for helpful discussions. We also thank David Horohov for providing the recombinant equine IL-4 and Douglas Antczak and Bettina Wagner for providing MAbs.
REFERENCES
1.Allan SE, et al.2007. Activation-induced FOXP3 in human T effector cells does not suppress proliferation or cytokine production. Int. Immunol.
19:345–354. doi:10.1093/intimm/dxm014.
2.Amel Kashipaz MR, Huggins ML, Powell RJ, Todd I.2002. Human autologous mixed lymphocyte reaction as an in vitro model for autoreac-tivity to apoptotic antigens. Immunology107:358 –365.
3.Barat C, Gilbert C, Tremblay MJ.2009. Efficient replication of human immunodeficiency virus type 1 in resting CD4⫹T lymphocytes is induced by coculture with autologous dendritic cells in the absence of foreign antigens. J. Virol.83:2778 –2782. doi:10.1128/JVI.01420-08.
4.Bendali-Ahcene S, Cadore JL, Fontaine M, Monier JC.1997. Anti-alpha chain monoclonal antibodies of equine MHC class II antigens: applica-tions to equine infectious anaemia. Res. Vet. Sci.62:99 –104.
5.Bettelli E, Dastrange M, Oukka M.2005. Foxp3 interacts with nuclear factor of activated T cells and NF-B to repress cytokine gene expression and effector functions of T helper cells. Proc. Natl. Acad. Sci. U. S. A.
102:5138 –5143. doi:10.1073/pnas.0501675102.
6.Breathnach CC, Soboll G, Suresh M, Lunn DP.2005. Equine herpesvi-rus-1 infection induces IFN-gamma production by equine T lymphocyte subsets. Vet. Immunol. Immunopathol. 103:207–215. doi:10.1016/ j.vetimm.2004.09.024.
7.Brusko TM, Putnam AL, Bluestone JA.2008. Human regulatory T cells: role in autoimmune disease and therapeutic opportunities. Immunol. Rev.223:371–390. doi:10.1111/j.1600-065X.2008.00637.x.
8.Buchele S, Hopfl R.1997. Presentation of tetanus toxoid to autologous T cells by dendritic cells generated from human blood. Improved specificity with dendritic cells generated without fetal calf serum. Adv. Exp. Med. Biol.417:233–237.
9.Cavatorta DJ, Erb HN, Flaminio MJ.2009.Ex vivogeneration of mature equine monocyte-derived dendritic cells. Vet. Immunol. Immunopathol.
131:259 –267.
10. Chernysheva AD, Kirou KA, Crow MK.2002. T-cell proliferation in-duced by autologous non-T cells is a response to apoptotic cells processed by dendritic cells. J. Immunol.169:1241–1250.
11. Delamarre L, Mellman I.2011. Harnessing dendritic cells for immuno-therapy. Semin. Immunol.23:2–11. doi:10.1016/j.smim.2011.02.001. 12. Dietze B, Cierpka E, Schafer M, Schill W, Lutz MB.2008. An improved
method to generate equine dendritic cells from peripheral blood mono-nuclear cells: divergent maturation programs by IL-4 and LPS. Immuno-biology213:751–758. doi:10.1016/j.imbio.2008.07.024.
13. D’Orsogna LJ, Roelen DL, Doxiadis II, Claas FH.2010. Alloreactivity from human viral specific memory T cells. Transpl. Immunol.23:149 – 155. doi:10.1016/j.trim.2010.06.008.
14. Flaminio MJ, Yen A, Antczak DF.2004. The proliferation inhibitory proteins p27Kip1and retinoblastoma are involved in the control of equine lymphocyte proliferation. Vet. Immunol. Immunopathol.102:363–377. doi:10.1016/j.vetimm.2004.07.001.
15. Freudenthal PS, Steinman RM.1990. The distinct surface of human blood dendritic cells, as observed after an improved isolation method. Proc. Natl. Acad. Sci. U. S. A.87:7698 –7702.
16. Garden OA, Pinheiro D, Cunningham F.2011. All creatures great and small: regulatory T cells in mice, humans, dogs, and other domestic animal species. Int. Immunopharmacol. 11:576 –588. doi:10.1016/ j.intimp.2010.11.003.
17. Gavin MA, et al.2006. Single-cell analysis of normal and FOXP3-mutant human T cells: FOXP3 expression without regulatory T-cell development. Proc. Natl. Acad. Sci. U. S. A. 103:6659 – 6664. doi:10.1073/ pnas.0509484103.
18. Geginat J, Sallusto F, Lanzavecchia A.2001. Cytokine-driven prolifera-tion and differentiaprolifera-tion of human naive, central memory, and effector memory CD4⫹T cells. J. Exp. Med.194:1711–1719.
19. Hammond SA, Horohov D, Montelaro RC.1999. Functional character-ization of equine dendritic cells propagated ex vivo using recombinant human GM-CSF and recombinant equine IL-4. Vet. Immunol. Immuno-pathol.71:197–214.
20. Hamza E, Gerber V, Steinbach F, Marti E.2011. Equine CD4⫹CD25high T cells exhibit regulatory activity by close contact and cytokine-dependent mechanisms in vitro. Immunology134:292–304. doi:10.1111/j.1365-2567.2011.03489.x.
21. Ho CS, Munster D, Pyke CM, Hart DN, Lopez JA.2002. Spontaneous generation and survival of blood dendritic cells in mononuclear cell cul-ture without exogenous cytokines. Blood99:2897–2904.
22. Ibrahim S, Saunders K, Kydd JH, Lunn DP, Steinbach F.2007. Screen-ing of anti-human leukocyte monoclonal antibodies for reactivity with equine leukocytes. Vet. Immunol. Immunopathol. 119:63– 80. doi: 10.1016/j.vetimm.2007.06.034.
23. Indiveri F, Barabino A, Pierri I, Grifoni V.1983. Human autologous mixed lymphocyte reactions. Ric. Clin. Lab.13:397– 409.
24. Innes JB, Garbrecht FC, Weksler ME, Russo C. 1989. Lymphocyte transformation induced by autologous cells. XVI. Distinctive role of dis-crete regions of class I MHC antigens in the autologous mixed leucocyte reaction. Clin. Exp. Immunol.75:280 –285.
25. Jin Y, et al.2007. Induction of auto-reactive regulatory T cells by stimu-lation with immature autologous dendritic cells. Immunol. Invest.36: 213–232. doi:10.1080/08820130601015775.
26. Kabithe E, Hillegas J, Stokol T, Moore J, Wagner B.2010. Monoclonal antibodies to equine CD14. Vet. Immunol. Immunopathol.138:149 –153. doi:10.1016/j.vetimm.2010.07.003.
27. Kawamura M, et al.1991. Further characterization of the autologous mixed lymphocyte reaction: induction of double negative gamma delta T lymphocytes. Cell. Immunol.133:468 – 483.
28. Kmieciak M, et al.2009. Human T cells express CD25 and Foxp3 upon activation and exhibit effector/memory phenotypes without any regulato-ry/suppressor function. J. Transl. Med.7:89. doi:10.1186/1479-5876-7-89. 29. Kushwah R, Hu J.2011. Role of dendritic cells in the induction of
regu-latory T cells. Cell. Biosci.1:20. doi:10.1186/2045-3701-1-20.
30. Lunn DP, Holmes MA, Duffus WP.1993. Equine T-lymphocyte MHC II expression: variation with age and subset. Vet. Immunol. Immunopathol.
35:225–238.
31. Mahic M, et al.2008. Differentiation of naive CD4⫹T cells into CD4⫹
FIG 8FoxP3⫹and FoxP3⫺cytokine profiles are similar in DC- and ConA-stimulated T cells. CFSE-stained T cells from 5 different horses were cultured with DCs (5 horses) or ConA (2/5 horses) in medium containing autologous serum. Cells were cultured for 6 days and treated with PMA, ionomycin, and brefeldin A for the last 5 h of culture. Cells were harvested, permeabilized, and stained for FoxP3 expression and cytokine production (IFN-␥, IL-4, or IL-10). The cells were gated for proliferation (CFSEdim), and the cytokine production by FoxP3⫹cells relative to FoxP3⫺cells was calculated. Relative expression⫽ 100⫻(% of FoxP3⫹cells producing cytokine/% of FoxP3⫺cells producing cytokine). Values below 100% (dotted line) indicate fewer cytokine-producing FoxP3⫹cells compared to FoxP3⫺cells. Values above 100% indicate more cytokine-producing FoxP3⫹cells compared to FoxP3⫺cells. Filled shapes in-dicate DC stimulation. Open shapes inin-dicate ConA stimulation.
on August 17, 2020 by guest
http://cvi.asm.org/
CD25⫹FOXP3⫹regulatory T cells by continuous antigen stimulation. J. Leukoc. Biol.83:1111–1117. doi:10.1189/jlb.0507329.
32. Mason D.1998. A very high level of cross-reactivity is an essential feature of the T-cell receptor. Immunol. Today19:395– 404.
33. Mayall S, Siedek E, Hamblin AS.2001. The anti-human CD21 antibody, BU33, identifies equine B cells. J. Comp. Pathol.124:83– 87. doi:10.1053/ jcpa.2000.0425.
34. Mellman I, Steinman RM.2001. Dendritic cells: specialized and regulated antigen processing machines. Cell106:255–258.
35. Miyara M, Sakaguchi S.2011. Human FoxP3⫹CD4⫹regulatory T cells: their knowns and unknowns. Immunol. Cell Biol.89:346 –351. doi: 10.1038/icb.2010.137.
36. Mizuno T, Suzuki R, Umeki S, Okuda M. 2009. Crossreactivity of antibodies to canine CD25 and Foxp3 and identification of canine CD4⫹ CD25⫹Foxp3⫹cells in canine peripheral blood. J. Vet. Med. Sci.71:1561– 1568.
37. Morel PA, Turner MS.2011. Dendritic cells and the maintenance of self-tolerance. Immunol. Res.50:124 –129. doi:10.1007/s12026-011-8217-y. 38. Narendran P, et al.2004. Dendritic cell-based assays, but not mannosylation
of antigen, improves detection of T-cell responses to proinsulin in type 1 diabetes. Immunology111:422– 429. doi:10.1111/j.1365-2567.2004.01825.x. 39. Nussenzweig MC, Steinman RM.1980. Contribution of dendritic cells to stimulation of the murine syngeneic mixed leukocyte reaction. J. Exp. Med.151:1196 –1212.
40. Pillai V, Ortega SB, Wang CK, Karandikar NJ.2007. Transient regula-tory T cells: a state attained by all activated human T cells. Clin. Immunol.
123:18 –29. doi:10.1016/j.clim.2006.10.014.
41. Pinheiro D, et al.2011. Phenotypic and functional characterization of a CD4⫹CD25highFOXP3highregulatory T-cell population in the dog. Im-munology132:111–122. doi:10.1111/j.1365-2567.2010.03346.x. 42. Prochazkova J, et al.2009. Distinct regulatory roles of transforming
growth factor-beta and interleukin-4 in the development and mainte-nance of natural and induced CD4⫹CD25⫹Foxp3⫹regulatory T cells. Immunology128:e670 – e678. doi:10.1111/j.1365-2567.2009.03060.x. 43. Robbin MG, Wagner B, Noronha LE, Antczak DF, de Mestre AM.2011.
Subpopulations of equine blood lymphocytes expressing regulatory T-cell markers. Vet. Immunol. Immunopathol. 140:90 –101. doi:10.1016/ j.vetimm.2010.11.020.
44. Scheinecker C, et al.1998. Initiation of the autologous mixed lymphocyte reaction requires the expression of costimulatory molecules B7-1 and B7-2 on human peripheral blood dendritic cells. J. Immunol.161:3966 – 3973.
45. Smith JB, Knowlton RP.1979. Activation of suppressor T cells in human autologous mixed lymphocyte culture. J. Immunol.123:419 – 422.
46. Steinbach F, et al.2009. Clinical application of dendritic cells and interleukin-2 and tools to study activated T cells in horses: first results and implications for quality control. Vet. Immunol. Immunopathol.
128:16 –23.
47. Steinbach F, et al.2005. Molecular cloning and characterization of mark-ers and cytokines for equid myeloid cells. Vet. Immunol. Immunopathol.
108:227–236.
48. Sung SS.2008. Monocyte-derived dendritic cells as antigen-presenting cells in T-cell proliferation and cytokine production. Methods Mol. Med.
138:97–106. doi:10.1007/978-1-59745-366-0_9.
49. Thornton AM, et al.2010. Expression of Helios, an Ikaros transcription factor family member, differentiates thymic-derived from peripherally in-duced Foxp3⫹T regulatory cells. J. Immunol. 184:3433–3441. doi: 10.4049/jimmunol.0904028.
50. Valencic E, Piscianz E, Tommasini A, Granzotto M. 2007. T cells stimulated in vitro have a suppressive function but do not contain only regulatory T cells. Clin. Exp. Immunol.150:561–566. doi:10.1111/j.1365-2249.2007.03502.x.
51. Verhasselt V, et al. 2004. Induction of FOXP3-expressing regulatory CD4pos T cells by human mature autologous dendritic cells. Eur. J. Im-munol.34:762–772. doi:10.1002/eji.200324552.
52. Walker MR, et al.2003. Induction of FoxP3 and acquisition of T regula-tory activity by stimulated human CD4⫹CD25⫺T cells. J. Clin. Invest.
112:1437–1443. doi:10.1172/JCI19441.
53. Weksler ME, Kozak R.1977. Lymphocyte transformation induced by autologous cells. V. Generation of immunologic memory and specificity during the autologous mixed lymphocyte reaction. J. Exp. Med.146:1833– 1838.
54. Yagi H, et al. 2004. Crucial role of FOXP3 in the development and function of human CD25⫹CD4⫹regulatory T cells. Int. Immunol.16: 1643–1656. doi:10.1093/intimm/dxh165.
55. Yamazaki S, et al.2007. Dendritic cells are specialized accessory cells along with TGF for the differentiation of Foxp3⫹CD4⫹regulatory T cells from peripheral Foxp3 precursors. Blood110:4293– 4302. doi:10.1182/ blood-2007-05-088831.
56. Yamazaki S, et al.2003. Direct expansion of functional CD25⫹CD4⫹ regulatory T cells by antigen-processing dendritic cells. J. Exp. Med.198: 235–247. doi:10.1084/jem.20030422.
57. Zanoni I, Granucci F.2011. The regulatory role of dendritic cells in the induction and maintenance of T-cell tolerance. Autoimmunity44:23–32. doi:10.3109/08916931003782148.
58. Zhu J, Yamane H, Paul WE.2010. Differentiation of effector CD4 T-cell populations. Annu. Rev. Immunol.28:445– 489. doi:10.1146/annurev-immunol-030409-101212.