© 2014, IJCSMC All Rights Reserved 603 Available Online atwww.ijcsmc.com
International Journal of Computer Science and Mobile Computing
A Monthly Journal of Computer Science and Information Technology
ISSN 2320–088X
IJCSMC, Vol. 3, Issue. 12, December 2014, pg.603 – 611
RESEARCH ARTICLE
Exploring Mobile Analytics
for Business Intelligence
Monika R. Astonkar
1, Prof. Amar Buchade
2¹Department of Computer Engineering, PICT Pune, India
²Department of Computer Engineering, PICT Pune, India
1[email protected];
2[email protected]
Abstract— Mobile analytics studies the behaviour of mobile application visitors. Data collected as a part of mobile analytics typically includes page views, visits, visitors and countries along with information specific to mobile devices such as device model, manufacturers, screen resolution, device capabilities, service providers and preferred user languages.
Thus, here we are going to explore some set of tools that provide capabilities as event tracking with better extraction of it’s semantic, as well real-time data collection and reporting that will include monthly active users, active users for particular time instance as well providing geographically located active users with the help of map. Also, we will design normalized, actionable metric to assess user engagement over arbitrary period of time for particular event of an application. We can also track the steps completed by user, and the ratio of dropout customers in each step. The semantic report will get generated for all the actions getting performed in applications.
Keywords— Mobile Analytics, Mobile Metrics, Data Collection, Segmentation Analysis, Retention Analysis
I. INTRODUCTION
The existing popularity of cell phones and other mobile devices capable of connecting to the Internet, coupled with the dramatic increase in popularity of powerful smart phones like Apple’s iPhone, has led to a surge in interest among businesses throughout the world in having a presence on the ―mobile Internet‖. Unfortunately the amount of available expertise for deploying mobile sites across diverse networks, devices, and application stacks is currently lacking. In situations like this, Web Analytics Tools are a strong champions for the appropriate use of measurement to help determine the quality and efficacy of deployed sites and applications. [1]
© 2014, IJCSMC All Rights Reserved 604 The key to this difference is in understanding how the context and capabilities of mobile interact with consumer behaviour. The most important difference is the nature of consumer engagement, which is heavily influenced by the intimacy and personal nature of mobile. At the heart of mobile analytics is an understanding of this engagement. [2]
A. NEED OF MOBILE ANALYTICS
The importance of Mobile Analytics and the role they play in analytics, it is important to understand how their capabilities will affect the organization.
Improving the end user experience: Mobile Web analytics should be conceptually familiar to marketers who work with traditional Web analytics. Both are useful for understanding how customers consume content, and what changes can be made to optimize their browsing behavior. Performance is often seen as the biggest problem for mobile users; therefore, establishing very specific ―cause and effect‖ scenarios via analytics reports can show which segments need attention in order to improve the overall customer experience.[10]
Real-time data collection: Data is the cornerstone of engaging business campaigns. Mobile analytics harnesses the power of data to create more relevant, engaging messages that can increase.[10]
Constant monitoring can deliver up-to-date knowledge to perpetually refine the user experience through features such as interactive visualization, an interface to apply filters and various views of data. A complete lifecycle perspective on how individuals use reports/apps to improve user engagement is key to succeeding with mobile analytics. [10]
Delivering custom content: Customized reports provide a more organized way for enterprises to look at their data. Once businesses have established the programs and features that work for their customers, they can better justify future investments. With the addition of data on the connecting device, mobile sites can be increasingly optimized to suit the specific interests of each consumer.[10]
B. INDUSTRY CHALLENGES TO MOBILE ANALYTICS
Agencies, vendors, developers, merchants—the mobile marketing industry—faces a number of challenges that need to be addressed openly by everyone working in this space.
1.
Implementing Analytics across mobile is hampered by data silo (A data silos is a repository of fixed data that an organization does not regularly use in its day-to-day operations)- The variety of data available in the mobile ecosystem necessarily brings with it a high level of complexity. SMS, mobile web, app behaviour data, app store data, location-based data, and mobile ad and QR code data all tend to reside in separate data silos. Stitching this information together is challenging, and the mobile marketing industry should endeavour to break down these silos. [7]
2.
Tagging and tracking users remains a technical hurdle- Tagging and tracking mobile user behaviour is essential to collecting analytics, but it is a still-developing mobile capability. JavaScript is a standard tagging mechanism, but this is only effective for smartphones capable of handling JavaScript and completely omits feature phones. This is becoming more common as users switch to smartphones with ―modern‖ mobile OS browsers – iOS, Android, and Windows Phone browsers – which all support JavaScript.[7]
- Pixel-based tracking has been introduced as a solution for non-JavaScript enabled devices but is not yet standard practice. Third party cookies, the bread and butter of online tracking, are not supported by many platforms, or are turned off by default, as on iOS, making comprehensive web tracking more difficult.[7]
3.
Privacy remains a paramount issue© 2014, IJCSMC All Rights Reserved 605 marketers and their media and analytics partners must be mindful of the most challenging tenet, choice, and the control that consumers must be able to exert with any mobile device.[7]
4.
Regional and national differences impact technical capabilities and regulations- There are regional considerations to keep in mind as well when implementing mobile analytics programs. Due to network and local infrastructure, what may be technically or legally possible in one country may not be possible in another. Each country has its own privacy and data collection regulations that determine what can and cannot be done to contextually enable relevant programs.[7]
II. LITERATURESURVEY
Mobile analytics is a growing field. A significant amount of research is in progress to enhance performance of Mobile Analytics. We have surveyed different research papers and other whitepapers related to Mobile Analytics and Web Analytics. The paper titled ―Web Analytics and Metrics: A Survey‖ [1] have contributed in process of Web Analytics. They also discussed different metrics and mechanism of evaluating websites and collecting information about behaviour of the user. Analysis of social media such as Twitter, Facebook with business activity with web-based API’s provided by these services. [2] Different benefits of web analytics data suggests that this data sometimes used to perform technical troubleshooting and optimization. It also throws light to use of web analytics to understand their audiences, often for curiosity or entertainment, as well as for more site- design oriented tasks like increasing traffic and optimizing content. [3] The paper [4] aims to supports learning analytics through dashboard applications, ranging from small mobile applications to learnsacpes on large public displays. Dashboards term refers to tools for the graphical visualization of key performance indicators (KPIs) complemented by reporting functions for data analysts. The author of the paper [5] investigate the risk of privacy leakage through mobile analytics services and demonstrate the ease with which an external adversary can extract individual's profile and mobile applications usage information, through two major mobile analytics services, i.e. Google Mobile App Analytics and Flurry. This whitepaper [6] exposes the lies being told about mobile analytics. They have discussed most common lies about mobile analytics which includes its accuracy, analytical solution correctness, hardware /software required as well measuring mobile visitors. A framework for Mobile Analytics to understand user engagement with mobile application is discussed in [7]. It also focuses on industry challenges to mobile analytics.
The report [8] examines the impact of mobile computing on the development, management, and implementation of applications and services for BI and analytics. The report will interpret the result of an extensive survey about organizations’ current experiences and plans for future deployment of mobile BI and analytics for users ranging from executives to frontline sales, service, and support personnel. The report [9] on ―Mobile Analytics from Netbiscuits-Using parameters to build web visitor insights‖ provides new insights to companies to get closer to their customers through new channels. It also introduces to Netbiscuits mobile analytic parameters, to demonstrate how they can be used to drive deeper understanding of customer preference and behaviour.
III.PROPOSEDSYSTEM
The organization which is deploying mobile analytic process should first define the goals, what exactly they want from Mobile and BI analytics and what sort of information access and management benefits the organization seeks to achieve on mobile devices. Afterwards, build Key performance indicators (KPI’s) and need to take Mobile Analytic service to fetch data. After the output is produced as analytics, they can modify implementation changes and verify the results to take hike in business. The system here we are proposing consists of following Steps:
Step 1: Client (Mobile App Data Analyst): At the first, client or Mobile App Data Analyst will define goals to achieve and build KPI’s. It sends metrics to calculate as a request to Mobile Analytic Tool/Server.
Step 2: Mobile Analytic Tool/Server: It receives the request from client and seeks Mobile App raw data from Data collection Server. Data collection server as collects User data, provides to analytical tool.
Firstly, the authentication process is carried out by data collection server and Mobile Data Analytics server for security purposes. Then Mobile data analytic tool sets the parameters in raw data API depending upon type of operation needs to perform like either segmentation analysis or retention analysis. And calculates the required Metrics.
© 2014, IJCSMC All Rights Reserved 606 Game and particular event related to that game. Again, select date for which analysis to be done. And then select type of analysis as DAU, MAU or Retention analysis to perform. The result in the form of graphical representation will get displayed on dashboard. There are also options provided to view result in different graphical forms.
The flow diagram of system shown in figures, which describes clearly all the steps that needs to take in system in sequence.
Figure1: System Data Flow Diagram
IV.MATHEMATICALMODELLING
Input: Bunch of User data from Mixpanel Analytic Tool as Data Collection Server
Output: Reporting and Analysis with UI representation/dashboard of metrics calculated.
System:
S = {s, e, X, Y, Fs, DD, NDD, Øs, Success, Failure} S = A Proposed System from Programmer’s perspective s = Start State
= UD DCS
Where, UD = Set of User Data DCS = Data Collection Server
e = End State
= Output displayed in the form of dashboard with metrics calculated X = Input of the System
= Bunch of user data from server = (UD1, UD2, UD3, _ _ _ _, UDn)
Y = Output of the System
= Metrics calculated to Mobile data Analyst in form of reports/graphs Mobile App/Web Data for Analysis
Data Collection server
Authentication Process
Select Metric to calculate
Calculate different Metrics using mobile analytic tool API’s
Analytics and Reporting using Dashboards
© 2014, IJCSMC All Rights Reserved 607 Fs = Friend functions for System
={start_data_collection_server(),Authentication(),fetch_data(),perform_operations(), shutdown_server() }
Function Mapping: Fn = Set of friend functions
Here, each function represents a special task to perform. We will discuss these tasks in details as follows:
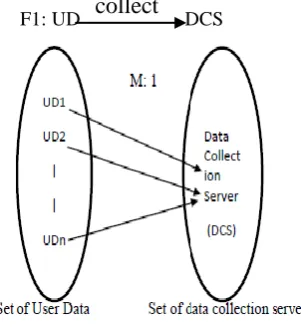
1. Data collection server and User Data F1: data_collection ()
This is a function that fetches or collects user data for particular game. This data collection server.
F1: UD DCS
Figure 2: Many to one mapping between set of user data and set of data collection server
2. Authentication and User Data
F2: authenticate ()
This is a function which ensures the security of user data
F2: UD CS authentication Parameters
Figure 3: Many to one relationship between set of user data and authentication process as well one to one relationship between authentication process and its different parameters
In order to consume user data authentication system requires following set of parameters. Authentication A = {api_key, api_secret, signature, expire}
collect
© 2014, IJCSMC All Rights Reserved 608
3. User Data from Data collection Server & Events, Properties and Profiles
F3: UD {E, P, PF}
This is a function which tells that for every user data collected from data collection server is associated with set of events (E), properties (P) and profiles (PF).
F3: UD {E, P, PF}
Figure 4: One to one mapping for User Data collection server and corresponding Events and properties.
4. User Data and calculate different metrics
F4: UD {DAU, MAU, NU, GDU}
This is a function which tells that for user data collected/ fetched, we have to calculate Different metrics as DAU, MAU, NU (New User), GDU (Geographically located Users)
Fig 5: One to One mapping for User data and metrics to be calculated
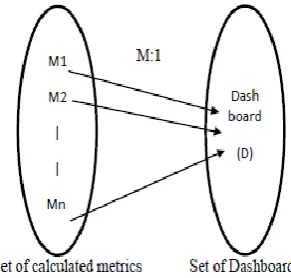
5.
Calculated metrics and UI representation/ dashboardsF5: M D
This is a function which tells to display the calculated result with the help of dashboard.
Fig 6: Many to one mapping for calculated metrics and UI representation (dashboard)
© 2014, IJCSMC All Rights Reserved 609 DD = Deterministic Data
= FD ∈ (ED EP)
= FD ∈ Actual behaviour of the system
Where, FD (Fetch Data) = required data pull up from data collection server ED (Event Data) = Event data in the system
= {E1, E2, E3, _ _ _ _ _ _, En | E ∈ no. of events corresponding to particular game}
EP (Event Parameters) = Event Parameters corresponding to each event Here, EP ∈ ED
= {EP1, EP2, _ _ _ _ _, En | EP ∈ no. of events corresponding to particular game)
NDD = Non-Deterministic Data
= FD ∈ prediction of desired behaviour Øs = Constraints
= Data fetched considered to be real time.
= Parameters chosen to calculate metrics must be appropriate to get correct results
Success State:
1. Metrics calculated correctly and efficiently for User Data
2. Creation of effective and user friendly dashboard for reporting and analysis of metrics calculated
Failure State:
1. Incorrect calculation of metrics
2. Ineffective display of result and analysis
V. UMLDIAGRAMSFORSPECIFIEDMODEL
Our proposed mobile analytics system is in its infancy i.e. initial stage. We have built some UML Diagrams for proposed system as Class diagram, Use Case diagram as follows which describes clearly the entities in the system.
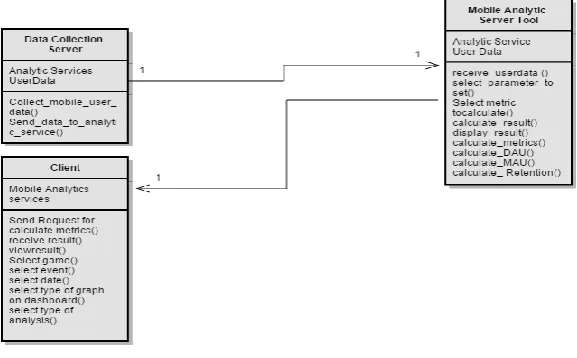
A. Class Diagram
Class Diagram is a static diagram. It shows static view of an application class. It helps us in analysis and design of the static view of an application. It describes responsibility of a system. It provides base for component and deployment diagrams. It is useful in forward and reverse engineering. [11] Our application consists of main 3 elements as Server, Android Task Submitter and Client, and the relationship between them is clearly mentioned in class diagram.
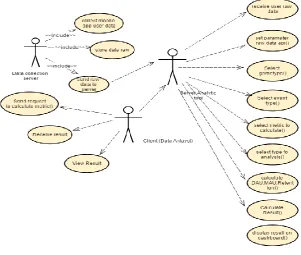
© 2014, IJCSMC All Rights Reserved 610 B. Use Case Diagram
A use case diagram is a graphic depiction of the interactions among the elements of a system. Use Cases are used in system for analysis to identify, clarify and organize system requirements. Use Cases are employed in UML (Unified Modelling Language), a standard notation for modelling of real-world objects and systems. [12]
Figure 8.Use Case Diagram
VI.CONCLUSIONS
The Mobile Analytics era is growing day by day and it will make its significant position in near future. Mobile analytics is establishing its existence in business by providing different analytic services to vendors as well as business people. We have also noticed that most users carry their web paradigms from PC to mobile, Firms measure mobile websites more than applications, Large enterprises extend their existing analytics investments, Mobile analytics vendors are moving faster than potential buyers, all these things signifies that there are good days for Mobile analytics and business intelligence.
Thus, through this paper we overviewed the need of Mobile analytics with its benefits as well as industrial Challenges. We also discussed system flow diagram for mobile analytics and our proposed system. To find out semantics out of mobile analytics we have considered few metrics as DAU (Daily Active User), MAU (Monthly Active User), and retention. Dashboards availability is very important for most mobile BI and analytic users. Dashboards can increase speed to instantly by delivering information in a way that makes it actionable and essential qualify for most users of mobile devices. Along, with dashboards, performance metrics and KPIs are key features that organizations want to see on mobile devices. Our current work going on segmentation and retention analysis to calculate the metrics and building a mobile analytical tool which will calculated desired metrics for providing business intelligence.
References
[1] Lakhwinder Kumar, Hardeep Singh and Ramandeep Kaur, ―Web Analytics and Metrics: A Survey‖
ICACCI ’12, August 03-05 2012, Chennai, India
[2] Bogdan Batrinca, Philip C. Treleaven ―Social media analytics: a survey of techniques, tools and platforms‖ open access at springerlink.com July 26, 2014
[3] Manya Sleeper, Sunnu Consolvo, Jessica Staddon ―Exploring the Benefits and Uses of Web Analytics
Tools for Non-Transactional Websites‖ DIS 2014, June 21-15, 2014, Vancouver, Canada
[4] Katrien Verbert, Sten Govaerts, Erik Duval, Jose Luis Santos, Frans Van Assche, Gonzalo Parra, Joris
Klerkx ―Learning dashboards: an overview and future research opportunities‖ Springer Paper, Published
© 2014, IJCSMC All Rights Reserved 611
[5] Terence Chen,Imdad Ullah, Mohamed Ali Kaafar, Raksana Boreli, ―Information Leakage through mobile
analytics services‖ Article No. 15 HotMobile '14 Proceedings of the 15th Workshop on Mobile Computing Systems and Applications. ISBN: 978-1-4503-2742-8
[6] Eric Peterson, Michiel Berger, Thomas Pottjegort ―The Truth about Mobile Analytics‖ Web Analytics Demystified and Nedstat, June 2009
[7] Seth Fowler, Michael Becker, Leo Scullin, Mike Ricci ―The MMA Primer on Mobile Analytics‖ Issued by
Mobile Marketing Update, September 2012.
[8] David Stodder ―Mobile Business Intelligence and Analytics‖ TDWI Best Practices Report, First Quarter 2012
[9] NetBiscuits ―Mobile Analytics from Netbiscuits – Using parameters to build web visitor insights‖, April
2014
[10] Giri Muthusamy, Rahul Ramalingam ―Mobile Enterprise Analytics in 60 Minutes‖ Whitepaper by
Cognizant 20-20 Insights, December 2013 [11] The Tutorial’s Point website. [Online]. Available:
http://www.tutorialspoint.com/uml.uml_class_diagram.htm