ISSN Online: 2333-9721 ISSN Print: 2333-9705
Climate Variability: Attributes and Indicators of
Adaptive Capacity in Semi-Arid Tharaka
Sub-County, Kenya
Charles W. Recha
1, George L. Makokha
2, Chris A. Shisanya
2, Mercy N. Mukopi
31Department of Geography, Egerton University, Egerton, Kenya
2Department of Geography, Kenyatta University, Nairobi, Kenya 3Kakamega County Government, Kakamega, Kenya
Abstract
This study assessed the state of adaptive capacity in four agro-ecological zones of Tharaka sub-county, Kenya. The study utilized two data sets: household survey and key informants. At total of 326 household respondents across four agro-ecological zones; and 24 key informants from public and private sectors were sampled. A chi-square test was used to test the independence of attributes of adaptive capacity-flexibility and access to resources. It was estab-lished that the state of adaptive capacity is reflected in households’ cropping and livelihood diversification; and cultivation of drought tolerant crops. In-stitutions are also involved in support programs such as distribution of relief food and planting seeds, infrastructural support of irrigation and rainwater harvesting. There is need for climate science, practitioners and community interaction to scaled-up communication of best optimal adaptation practices that are risk averse to climate variability.
Subject Areas
Atmospheric Sciences, Environmental Sciences
Keywords
Adaptive Capacity, Climate Variability, Semi-Arid, Kenya
1. Introduction
There is growing evidence that global climate is changing [1] [2] and subse-quently re-shaping the world. A changing and variable climate has combined with non-climatic factors to create vulnerability [1]. According to [3] Africa is
How to cite this paper: Recha, C.W., Makokha, G.L., Shisanya, C.A. and Mukopi, M.N. (2017) Climate Variability: Attributes and Indicators of Adaptive Capacity in Semi- Arid Tharaka Sub-County, Kenya. Open Ac- cess Library Journal, 4: e3505.
https://doi.org/10.4236/oalib.1103505
Received: March 18, 2017 Accepted: May 5, 2017 Published: May 8, 2017
Copyright © 2017 by authors and Open Access Library Inc.
This work is licensed under the Creative Commons Attribution International License (CC BY 4.0).
especially vulnerable to climatic changes and variability. This vulnerability has been attributed to dependency on climate-sensitive economic sectors, wide-spread poverty, limited funding of institutions, poor infrastructure, high illiter-acy rates, over-exploitation of natural resources and tribal conflicts [4]. These factors have contributed to the continent’s low adaptive capacity. In spite of the low adaptive capacity of Africa, communities and governments have developed adaptation strategies to cope with climate variability and extreme events [5] [6] [7]. Some literature to support current climate change adaptation efforts by local communities and institutions (public and private) would suffice.
[7] discussed the importance of science-practitioner communication and the role of regional institutions and policy in addressing vulnerability in southern Africa. These views are echoed by [5] (Malawi and Kenya), [8] [9] (Ontario- Canada), [10] (US and Mexico) and [11] (in Brazil). In these studies, the role of institutions in supporting adaptation through technology transfer is unders-cored. Besides institutional level-support, there exist location specifics studies on ongoing adaptation strategies. [12] discussed seed fair as a drought recovery strategy in semi arid Kenya districts within the Tana Basin. In South Africa, rainwater harvesting techniques are the most popular risk management and adaptation strategy used [13]. In Central Rift Valley of Ethiopia, farmers apply different strategies such as sell of livestock, migration, change of crops and agri-cultural practices and reliance on food relief [14]. These studies demonstrate that there is variation in climate change adaptation strategies. These variations may be an outcome of cultural or economic setting of a community or the de-velopment agenda of the supporting agency.
Against this background, the present study sought to examine smallholder agro-pastoralists’ ability to draw on available skills, resources and experience to respond to climate variability in Tharaka sub-County. The study further exam-ined institution-led efforts in supporting adaptation to climate variability. Study finds are expected to contribute to Kenya’s National Climate Change Response Strategy (NCCRS) [15] and the Climate Change Act 2016 [16] on Tharaka’s so-cial vulnerability to climate change. In general, the study provides a perspective on the state of adaptive capacity in Kenya’s arid and semi-arid lands (ASALs).
2. Methodology
2.1. Study Area
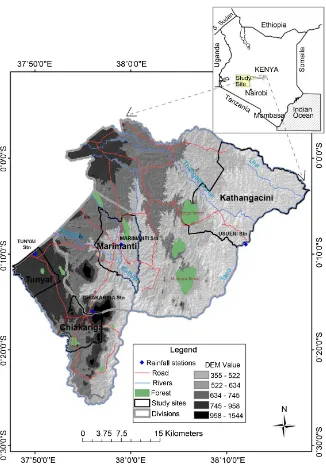
Tharaka sub-county is found in Tharaka Nithi County and covers an area of 1569.5 km2 and a population of 175, 905 [17]. The sub-county has four agro-
mixed farming [21]. As a semi- arid sub-county, rainfall is highly variable caus-ing wide fluctuations in agricultural production and has profound impacts on the ecology, economy and social welfare of the people. The choice of the sub-county was based on an understanding that as a semi-arid area, climate va-riability is a major source of vulnerability. Thus there is need to establish the state of existing climate change adaptation strategies.
2.2. Sample Size and Data Collection
Household survey data and interviews of key informants was collected from four main agro-ecological zones in Tharakasub-county-LM4, LM5, IL5 and IL6. A total of 326 respondents were interviewed across the four study sites (Figure 1) in the year 2010. In each study site, 5% of the households were selected for inter-view (Table 1). Simple random sampling [22] was used to select respondents in each location-giving all household members a chance to be interviewed. A total of twenty-four key informants were purposively selected and interviewed; nine-teen from the government and the five from private sector entities. These were drawn from agriculture, livestock, water, public health and administration sec-tors. Information from key informants was used to validate household survey data-particularly the role of institutions in supporting adaptation to climate change.
Data collection was carried in three stages. First, it involved a reconnaissance survey and consultation with the Arid and Semi-arid Department at Marimanti. Reconnaissance provided an understanding of the administrative units, general physiography and communication network of the sub-county. This provided critical information on planning for data collection. The second phase entailed pre-testing and administration of a structured questionnaire and interview schedule. Pre-testing of these tools was done to check the reliability and validity of the questions.
2.3. Data Analysis
The variables analyzed from the data collected were flexibility of and resour-ceaccessby agro-pastoralist households in Tharaka sub-county as presented in
Table 2. The two variables are regarded as the attributes of adaptive capacity
[8]. Chi-square (X2) is a non-parametric test used to test the independence of
attributes. To apply X2, requirements were observed as discussed by [23]. X2
was used to establish the difference between number of livelihoods and study sites.
3. Results and Discussion
3.1. Flexibility
3.1.1. Cropping Diversity
Figure 1. A Map of Tharaka sub-county showing study sites.
Table 1. Sample population by study sites and gender.
Location Sub-location Male Female Sub-total Total
Kathangacini Kathangacini 27 24 51 58
Rwanthanju 4 3 7
Marimanti Marimanti 20 20 40 92
Kithigiri 26 26 52
Tunyai Tunyai 24 13 37 78
Tubui 30 11 41
Chiakariga Materi 23 6 29 98
Chiakariga 51 18 69
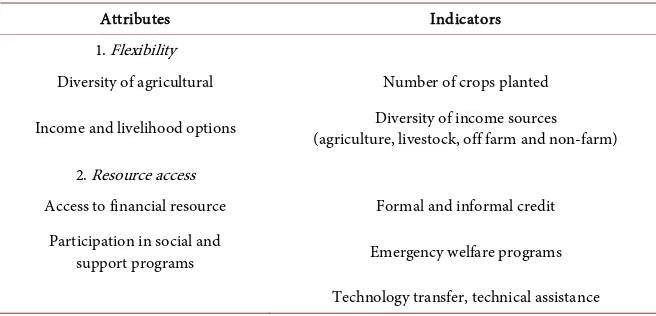
Table 2. Attributes and indicators of adaptive capacity.
Attributes Indicators
1. Flexibility
Diversity of agricultural Number of crops planted
Income and livelihood options (agriculture, livestock, off farm and non-farm) Diversity of income sources
2. Resource access
Access to financial resource Formal and informal credit Participation in social and
support programs Emergency welfare programs Technology transfer, technical assistance
Adopted and modified from [24].
respectively (Figure 2). During the OND season, majority of the households at AEZ IL6 and IL5 planted three cultivars while their counterparts in LM4 and LM5 had two cultivars. During MAM season, the number of households culti-vating more than one crop reduced, with majority (35%) not planting any crop. In a rural-based economy where crop farming is a lead livelihood, failure to en-gage in farming is a statement of socio-economic factors (not necessarily rain-fall) being a hindrance. High cost of farm inputs (especially seeds and fertilizers) potentially limits engagement in crop farming.
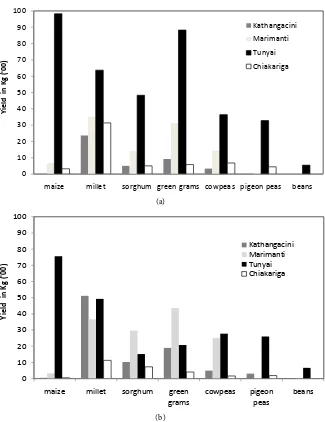
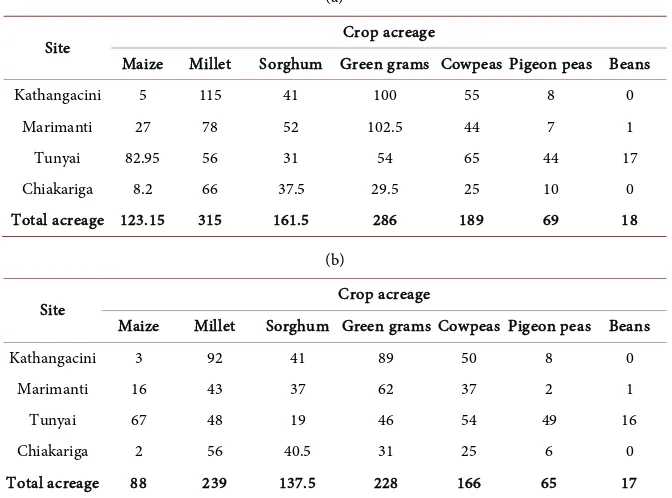
The specific crops cultivated in Tharaka sub-county were green grams, millet, sorghum, cowpeas, pigeon peas, maize and beans. A comparison of cultivated acreage by seasons shows that there is a marked difference-with MAM recording the least acreage across all crops (Table 3(a) and Table 3(b)). Millet and green grams are the most cultivated with a total acreage of 315 acres and 286 acres during OND and 239 acres and 228 acres during MAM, respectively. While beans and pigeon peas are the least cultivated in both seasons. It is also signifi-cant to note that maize and beans require more moisture and are mainly grown in LM 4 (Tunyai) where annual rainfall is slightly over 1000 mm [19].
Figure 2. Number of crops grown by seasons-October-November-December (OND) and March-April-May (MAM).
(a)
(b)
Figure 3. Total crop yield of the main crops cultivated in Tharaka sub-county during (a) OND and (b) MAM.
22 12 25 21 16 2 1 35 9 22 16 15 2 1 0 5 10 15 20 25 30 35 40
0 1 2 3 4 5 6
% o f re sp on de nt s
No. Of crops cultivated
OND MAM 0 10 20 30 40 50 60 70 80 90 100
maize millet sorghum green grams cowpeas pigeon peas beans
Yie ld in Kg (' 00 ) Kathangacini Marimanti Tunyai Chiakariga 0 10 20 30 40 50 60 70 80 90 100
maize millet sorghum green
grams cowpeas pigeon peas beans
Table 3. Cropping diversity and acreage by study sites for (a) OND and (b) MAM. (a)
Site Crop acreage
Maize Millet Sorghum Green grams Cowpeas Pigeon peas Beans Kathangacini 5 115 41 100 55 8 0
Marimanti 27 78 52 102.5 44 7 1 Tunyai 82.95 56 31 54 65 44 17 Chiakariga 8.2 66 37.5 29.5 25 10 0 Total acreage 123.15 315 161.5 286 189 69 18
(b)
Site Crop acreage
Maize Millet Sorghum Green grams Cowpeas Pigeon peas Beans
Kathangacini 3 92 41 89 50 8 0
Marimanti 16 43 37 62 37 2 1
Tunyai 67 48 19 46 54 49 16
Chiakariga 2 56 40.5 31 25 6 0
Total acreage 88 239 137.5 228 166 65 17
engage in adaptation. In view of the findings, adaptive capacity can be streng-thened with efforts directed towards increased productivity and facilitating marketing of farm produce. This will contribute to improved food security and overall wellbeing of the Tharaka people. Although this study did not go into the agronomy of crop varieties in Tharaka, cultivation of non-native crops such as pearl millet (matures in 55 days), N-26 green gram (matures in 45 - 50 days) and sorghum varieties demonstrates that farmers have mixed agricultural science with their knowledge of agro-ecological zones. Preference for non-native culti-vars is evidence of fruitful co-production of knowledge between farmers and ex-tension workers and development agencies-similarly reported by [27] (in Zam-bia) and [28] (in Namibia).
Allocation of more arable land to crop farming and cultivation of more culti-vars during OND than MAM rain seasons suggests farmers’ preference for the former. Indeed in Eastern Kenya, OND is the main growing season. OND rain season has been found to be reliable than MAM rain season [29] [30]. But the relatively high crop yield at Marimanti (IL5) during MAM highlight the signi-ficance of the season. The signisigni-ficance of MAM is further given credence in a study by [19] who established that there is no significant difference between MAM and OND rainfall amount in AEZ IL5. To practitioners and farmers, it calls for a re-evaluation of the current emphasis on OND rainfall season espe-cially in IL5. These results should however be treated with caution given that crop yield were based on one season. But they offer a fertile ground for further investigations on the link between seasonal rainfall and crop yield over time.
3.1.2. Livelihoods Diversification
during the past 12 months. Sale of livestock (55%), crops (15%) and forest & non-wood forest products (8%) were the main livelihood support strategies in Tharaka sub-county. Sale of goats, cattle and poultry, were the main sources of income from livestock. Cowpeas and green grams were the most sold crops at household level. A small section of the sampled households (N = 27) engaged in sale of charcoal and handicrafts. At least 18% (N = 60) of the respondents en-gaged in on-farm-wage employment, while 8% joined social programs as a food security measure. The high percentage of respondents who sold livestock is fur-ther supported by a high proportion and diversity of livestock ownership. Cattle, sheep, goats and poultry are owned by 55%, 34%, 64% and 72% of households sampled. But a sizeable (27%) group of respondents had no livestock. Livestock is important in an agro-pastoral system of the semi-arid Tharaka-found to in-crease resilience of vulnerable people especially in light of a projected decline of crop production under climate change [31]. But livestock keeping as a lead live-lihood in Tharaka will have to content with diseases and prolonged drought.
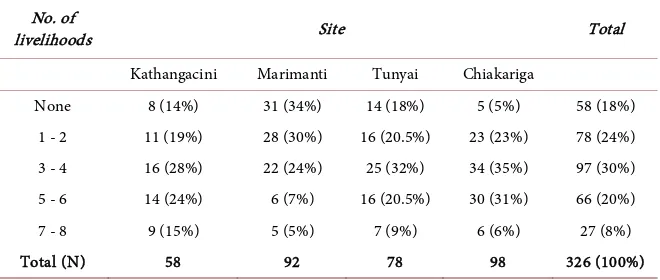
Result in Table 4 shows the number of livelihoods in the last 12 months. Fifty percent of the respondents had 3 - 4 and 5 - 6 livelihood options in Tharaka. At least 18% claimed not to have been involved in a livelihood strategy. It is not clear whether this group (without livelihood) is the most stable and therefore did not dispose some assets or engaged in alternative sources of income. Chi-square test (p = 0.05) showed that there is a significant relationship between number of livelihoods and study sites. It is concluded that households in relatively high po-tential agro-ecological zones (LM4 and LM5) have more livelihood options than their counterparts in marginal agro-ecological zones (IL5 and IL6). Diversity in livelihoods was an indication of stability and therefore less vulnerable to climate variability. The fewer livelihood options at Marimanti (agro-ecological zoned IL5) can be attributed to the growing urbanization-a precursor for unemploy-ment.
Although households in Tharaka had more than one livelihood, their reliance on rainfall dependent livelihoods-livestock and crop produce, make them vul-nerable to climate variability, especially drought. It would therefore be prudent to prioritize building livelihoods that will enable households cope better with current climate variability. Livelihood diversification, particularly involvement
Table 4. Number of livelihoods at household level by study sites (N = 326).
No. of
livelihoods Site Total
Kathangacini Marimanti Tunyai Chiakariga
None 8 (14%) 31 (34%) 14 (18%) 5 (5%) 58 (18%) 1 - 2 11 (19%) 28 (30%) 16 (20.5%) 23 (23%) 78 (24%) 3 - 4 16 (28%) 22 (24%) 25 (32%) 34 (35%) 97 (30%) 5 - 6 14 (24%) 6 (7%) 16 (20.5%) 30 (31%) 66 (20%) 7 - 8 9 (15%) 5 (5%) 7 (9%) 6 (6%) 27 (8%)
in non-farming income sources was reported in [32]. There is a need for diversi-fication of livelihoods to reduce over-reliance on crops and livestock. In Thara-ka, venturing into non-wood forest products such as gum arabic & resin, bee keeping and handicrafts would complement existing livelihood options. But there is also need to refocus use of remote sensing technology (e.g. normalized difference vegetation index data) in monitoring livestock diseases in Kenya’s ASALs [33]. The focus on livestock is motivated by an understanding that it’s a lead livelihood in Tharaka sub-County.
3.2. Resource Base
3.2.1. Access to CreditAccess to formal credit is almost non-existent among smallholder farmers in Tharaka sub-county. The most common source of credit was where members make monthly contribution to one another on rotational basis-locally referred to as Merry-go-round. Limited access to credit can be explained by three factors. To smallholder farmers of semi-arid Tharaka, borrowing money for farming does not make economic sense as chances of crop failure are much higher than success. Secondly majority of the farmers are poor and therefore lack collateral, including land title deeds. Third, the sub-county had no operational bank by the time of study. For residents who had bank account, they travel long distances on all-weather roads to Meru or Chuka towns in neighbouring sub-counties. The construction of Kathwana-Chiakariga and Marimanti-Mitunguu roads is expected to open up the sub-county. It is hoped that major banks will open branches and other essential services will be established in the sub-county. There is need for formulation and implementation of poor policies which should include pro-vision of short term production credit as was found in Ghana [34]. Often, access to credit makes it possible to make climate change adaptation decisions. A case in point was in Ethiopia where access to credit had a positive and significant impact on the likelihood of adopting soil conservation, change of planting dates and use of irrigation [35]. In Kenya, there are several efforts by the Ministry of Agriculture and other development agencies in providing credit and farm inputs to farmers. Unfortunately, these efforts are emphasized in high and medium po-tential areas than in semi-arid lands.
3.2.2. Institutional-Level Support Programs
re-ceived relief food and seeds respectively attributed it to prolonged drought. Wa-ter supply, installation of irrigation equipment, participation in training and technology transfer were mainly mentioned in Tunyai with a few cases reported in Marimanti. The focus of these development programs in Tunyai-agro-eco- logical zone LM4, can be attributed to agricultural potential. Irrigation has been found to be highly beneficial in reducing poverty among the poor and in pro-viding employment opportunities which diversify income base [36]. [26] found investment in irrigation a desired investment among farmers of ASAL Kenya – well ahead of other adaptation options such as agro-forestry and change of crop cultivars. Given the agro-pastoral system preferred in Tharaka [37], promotion of irrigation can reduce vulnerability caused by erratic rainfall.
The Kenyan government was acknowledged by respondents for playing a role in food relief and seed distribution. The specific Kenyan government agencies involved in support programmes were agricultural extension service providers, Kenya Agricultural and Livestock Organization (KALRO) and the Ministries of Livestock and Special Programmes. The extension is involved in the technology transfer programs in agriculture and natural resource management. KALRO is involved in farm trials of drought tolerant cultivars and promotion of their adoption. The Ministries of Livestock and Special Programs encourage house-holds to sell-off their livestock before drought to avoid losses. Non-governmen- tal organizations found to be promoting adaptation to climate change in Thara-ka were the Catholic Diocese of Meru, Plan International, United Nations De-velopment Programme (UNDP) and World Food Programme (WFP). These organizations were widely quoted as helping in the installation of water storage facilities, distribution of relief food and farm inputs, and promotion of natural resource conservation (water and soil). Although practitioners observed that use of seasonal climate forecast would improve resource and planning (especially in mitigating the effect of climate variability), none indicated its use. Lack of inter-est can be attributed to inaccuracy arising from large scale of prediction [38]. But practitioners need to tap into the improved rating of seasonal climate fore-cast by households where 74% rated it as somewhat accurate. Application of forecasts in the drought prone Tharaka sub-county would help farmers reduce risk and losses, and enable them plan for alternative livelihoods.
It was however not clear whether researchers (or research institutions) are involved in support programs, notably technology transfer and training in natu-ral resources programs. Either, there is less research supporting communities in Tharaka, or researchers are embedded in NGO and government as channels of dialogue and engagement. To improve science-practitioner interaction, [7] sug-gests the need to find out what a practitioner does and what decisions are pend-ing (rather than askpend-ing what kind of information he/she needs). In Tharaka, science-practitioner interaction is favoured by a majority of practitioners.
4. Conclusion
sub-county. Diversity of livelihoods, two growing season (MAM and OND), and cultivation of drought tolerant crops (millet, green grams, sorghum and cow-peas) are indicators of adaptive capacity, a demonstration of the communities’ in-built adaptation to climate variability. In Tharaka, there was a mismatch be-tween land allocation and crop yields for the two growing seasons-MAM and OND. Although farmers have an outright preference for OND rainfall season, analysis of crop yield shows that there is an untapped opportunity in the MAM rainfall season. Farmers in agro-ecological zones IL5 (Marimanti) and IL6 (Ka-thangacini)-the driest agro-ecological zones, can benefit from MAM rainfall season by allocating more farmland to cowpeas, green grams and millet. To support adaptation, institutions are engaged in support programs that are both short term (seed distribution, food relief) and medium term (irrigation, installa-tion of small-scale irrigainstalla-tion infrastructure and rain water harvesting). Ac-knowledging the vital role of short term strategies in reducing vulnerability to impact of extreme climatic events, it is the promotion of rainwater harvesting techniques and use of climate forecast in agricultural planning and resource management that are key to risk reduction. Since communities in semi-arid are growing drought tolerant crops, efforts by non-governmental organizations and government agencies need to be directed towards increasing productivity and market access of farm produce. Much more success can be realized if the existing communication gap between climate science, practitioners and community can be addressed.
Acknowledgements
The authors acknowledge financial support from the African Climate Change Fellowship Programme—a programme of International SysTem for Analysis, Research and Training (START) for a study fellowship award to the first author and fieldwork support from the EU Water Facility Project (No. 9 ACP RPR 50/11). We further acknowledge the valuable support of the Department of Arid Lands-Tharaka sub-county and the receptive people of Tharaka who partici-pated in the survey, without which this study would not have been possible.
References
[1] IPCC (2014) Summary for Policymakers. In: Field, C.B., Barros, V.R., Dokken, D.J., Mach, K.J., Mastrandrea, M.D., Bilir, T.E., Chatterjee, M., Ebi, K.L., Estrada, Y.O., Genova, R.C., Girma, B., Kissel, E.S., Levy, A.N., MacCracken, S., Mastrandrea, P.R and White L.L., Eds., Climate Change 2014: Impacts, Adaptation and Vulnerability. Part A: Global and Sectoral Aspects. Contribution of Working Group II to the Fifth Assessment Report of IPCC, Cambridge University Press, New York, 1-32.
[2] Kundezewicz, Z.W., Mata, L.J., Arnel, N.W., Doll, P., Jimenez, B., Miller K., Oki, T., Sen, Z. and Shiklomanov, I. (2008) The Implication of Projected Climate Change for Freshwater Resources and Their Management. Hydrological Sciences, 53, 3-10.
https://doi.org/10.1623/hysj.53.1.3
[3] Osman-Elasha, B. (2007) Africa’s Vulnerability. Tiempo, 63, 3-9.
Resilience to Climate Change through Development Assistance: USAID’s Climate Adaptation Program. Climate Change, 108, 411-421.
https://doi.org/10.1007/s10584-011-0127-4
[5] Brooks, S. (2014) Enabling Adaptation? Lessons from the New “Green Revolution” in Malawi and Kenya. Climate Change, 122, 15-26.
https://doi.org/10.1007/s10584-013-0992-0
[6] Mertz, O., Halsnaes, K., Olesen, J.E. and Rasmussen, K. (2009) Adaptation to Cli-mate Change in Developing Countries. Environmental Management, 43, 743-752.
https://doi.org/10.1007/s00267-008-9259-3
[7] Vogel, C., Moser, S.C., Kasperson, R.E. and Dabelko, G.D. (2007) Linking Vulnera-bility Adaptation and Resilience Science to Practice: Pathways, Players and Part-nerships. Global Environmental Change, 17, 349-364.
[8] Berman, R., Quinn, C. and Paavola, J. (2012) The Role of Institutions in the Trans-formation of Coping Capacity to Sustainable Adaptive Capacity. Environmental Development, 2, 86-100. https://doi.org/10.1016/j.envdev.2012.03.017
[9] Crabbě, P. and Robin, M. (2006) Institutional Adaptation of Water Resource Infra-structures to Climate Change in Eastern Ontario. Climate Change, 78, 103-133.
https://doi.org/10.1007/s10584-006-9087-5
[10] Vasquez-Leon, M., West, C.T. and Finan, T.J. (2003) A Comparative Assessment of Climate Vulnerability: Agriculture and Ranching on Both Sides of the USA-Mexico Border. Global Environmental Change, 13, 159-173.
https://doi.org/10.1016/S0959-3780(03)00034-7
[11] Lemos, M.C., Finan, T.J., Fox, R.W., Nelson, D.R. and Tucker, J. (2002) The Use of Seasonal Climate Forecasting in Policymaking: Lessons from Northeast Brazil. Cli-mate Change, 55, 479-507.
[12] Orindi, V.A. and Ochieng, A. (2005) Seed Fairs as a Drought Recovery Strategy in Kenya. Institute of Development Studies, 36, 87-102.
https://doi.org/10.1111/j.1759-5436.2005.tb00236.x
[13] Gandure, S., Walker, S. and Botha, J.J. (2013) Farmer’s Perceptions of Adaptation to Climate Change and Water Stress in a South African Rural Community. Environ-mental Development, 5, 39-53. https://doi.org/10.1016/j.envdev.2012.11.004
[14] Adimassu, Z., Kessler, A. and Stroosnijder, L. (2014) Farmers’ Strategies to Per-ceived Trends of Rainfall and Crop Productivity in the Central Rift Valley of Ethi-opia. Environmental Development, 11, 123-140.
https://doi.org/10.1016/j.envdev.2014.04.004
[15] Republic of Kenya (2016) National Climate Change Response Strategy.
http://cdkn.org/wp-content/uploads/2012/04/National-Climate-Change-Response-Strategy_April-2010.pdf
[16] Republic of Kenya (2016) The Climate Change Act No. 11 of 2016. National Coun-cil of Law Reporting, Nairobi.
[17] Republic of Kenya (2010) 2009 Kenya Population and Housing Census: Population Distribution by Administrative Units. Kenya National Bureau of Statistics, Nairobi. [18] Jaetzold, R., Schmidt, H., Hornetz, B. and Shisanya, C. (2007) Farm Management
Handbook of Kenya: Part C, East Kenya. Ministry of Agriculture, Nairobi.
[19] Recha, C.W., Makokha, G.L., Traore, P.S., Shisanya, C., Lodoun, T. and Sako, A. (2012) Determination of Seasonal Rainfall Variability, Onset and Cessation in Semi- Arid Tharaka District, Kenya. Theoretical and Applied Climatology, 108, 479-494.
https://doi.org/10.1007/s00704-011-0544-3
Tharaka, Kenya: Vulnerability, Persistence and Challenge. Disasters, 32, 190-215.
https://doi.org/10.1111/j.1467-7717.2007.01035.x
[21] Gioto, V., Wandiga, S. and Oludhe, C. (2016) Climate Change Detection across All Livelihood Zones in Tharaka Nithi County. Journal of Meteorology Related Studies,
9, 11-17. https://doi.org/10.20987/jmrs.2.08.2016
[22] Saleemi, N.A. (2011) Statistics Simplified. Saleemi Publications Ltd., Nairobi. [23] Shaw, G. and Wheeler, D. (1985) Statistical Techniques in Geographical Analysis.
John Wiley and Sons, New York.
[24] Wehbe, M.B., Seiler, R.A., Vinocur, M.R., Eakin, H., Santos, C. and Civitaresi, H.M. (2015) Social Methods of Assessing Agricultural Producers’ Vulnerability to Cli-mate Variability and Change Based on the Notion of Sustainability (AIACC Work-ing Paper No. 19).
http://www.start.org/Projects/AIACC_Project/working_papers/Working%20Papers
/AIACC_WP_No019.pdf
[25] Devereux, S. (2009) Why Does Famine Persist in Africa? Food Security, 1, 25-35.
https://doi.org/10.1007/s12571-008-0005-8
[26] Bryan, E., Ringler, C., Okoba, B., Rocoli, C., Silverster, S. and Herrero, M. (2013) Adapting Agriculture to Climate Change in Kenya: Household Strategies and De-terminants. Journal of Environmental Management, 114, 26-35.
https://doi.org/10.1016/j.jenvman.2012.10.036
[27] Makondo, C.C., Chola, K. and Moonga, B. (2014) Climate Change Adaptation and Vulnerability: A Case of Rain Dependant Smallholder Farmers in Selected Districts in Zambia. American Journal of Climate Change, 3, 388-403.
[28] Newsham, A.J. and Thomas, D.S.G. (2011) Knowing, Farming and Climate Change Adaptation in North-Central Namibia. Global Environmental Change, 21,760-770.
https://doi.org/10.1016/j.gloenvcha.2010.12.003
[29] Barron, J., Rockstrom, J., Gichuki, F. and Hatibu, N. (2003) Dry Spell Analysis and Maize Yields for Two Semi-Arid Locations in East Africa. Agricultural and Forest Meteorology, 117, 23-37. https://doi.org/10.1016/S0168-1923(03)00037-6
[30] Amissah-Arthur, A., Jagtap, S. and Rosenzweig, C. (2002) Spatio-Temporal Effects on Rainfall and Maize Yield in Kenya. International Journal of Climatology, 22, 1849-1860. https://doi.org/10.1002/joc.858
[31] Thornton, P.K., Jones, P.G., Alagarswamy, G., Andresen, J. and Herrero, M. (2010) Adapting to Climate Change: Agricultural Systems and Household Impacts in East Africa. Agricultural Systems,103, 73-82.
[32] Belachew, O. and Zuberi, M.I. (2015) Perception of Climate Change and Livelihood of a Farming Community of MarufKebele, Central Oromia, Ethiopia. American Journal of Climate Change, 4, 269-281. https://doi.org/10.4236/ajcc.2015.43022
[33] Indeje, M., Ward, M.N., Ogallo, L., Davies, G., Dilley, M. and Anyamba, A. (2006) Predictability of Normalized Difference Vegetation Index in Kenya and Potential Applications as an Indicator of Rift Valley Fever Outbreak in the Greater Horn of Africa. Journal of Climate, 19, 1673-1687. https://doi.org/10.1175/JCLI3708.1
[34] Wossen, T., Berger, T., Swamikannu, N. and Ramilan, T. (2014) Climate Variability, Consumption Risk and Poverty in Semi-Arid Northern Ghana: Adaptation Options for Poor Farm Households. Environmental Development, 12, 215.
https://doi.org/10.1016/j.envdev.2014.07.003
[36] Eshetu, S., Belete, B., Goshu, D., Kassa, B., Tarimu, D., Worku, E. and Abebe, Z. (2010) Income Diversification through Improved Irrigation in Ethiopia: Impacts, Constraints and Prospects for Poverty Reduction. Working Paper 14, Ethiopia Rip-ple.
[37] Cecchi, G., Wint, W., Shaw, A., Marletta, A., Mattioli, R. and Robinson, T. (2010) Geographic Distribution and Environmental Characterization of Livestock Produc-tion Systems in Eastern Africa. Agriculture, Ecosystems and Environment, 135, 98- 110. https://doi.org/10.1016/j.agee.2009.08.011
[38] Coelho, C.A.S. and Costa, S.M.S. (2010) Challenges for Integrating Seasonal Climate Forecasts in User Applications. Current Opinion in Environmental Sustainability,2, 1-9. https://doi.org/10.1016/j.cosust.2010.09.002
Submit or recommend next manuscript to OALib Journal and we will pro-vide best service for you:
Publication frequency: Monthly
9 subject areas of science, technology and medicine Fair and rigorous peer-review system
Fast publication process
Article promotion in various social networking sites (LinkedIn, Facebook, Twitter, etc.)
Maximum dissemination of your research work
Submit Your Paper Online: Click Here to Submit