Scholarship@Western
Scholarship@Western
Electronic Thesis and Dissertation Repository
7-20-2017 12:00 AM
Reliability and Validity of the Star Excursion Balance Test in
Reliability and Validity of the Star Excursion Balance Test in
Patients with Knee Osteoarthritis
Patients with Knee Osteoarthritis
Lauren Kanko
The University of Western Ontario
Supervisor
Dr. Trevor Birmingham
The University of Western Ontario Graduate Program in Kinesiology
A thesis submitted in partial fulfillment of the requirements for the degree in Master of Science © Lauren Kanko 2017
Follow this and additional works at: https://ir.lib.uwo.ca/etd
Part of the Rehabilitation and Therapy Commons
Recommended Citation Recommended Citation
Kanko, Lauren, "Reliability and Validity of the Star Excursion Balance Test in Patients with Knee Osteoarthritis" (2017). Electronic Thesis and Dissertation Repository. 4661.
https://ir.lib.uwo.ca/etd/4661
This Dissertation/Thesis is brought to you for free and open access by Scholarship@Western. It has been accepted for inclusion in Electronic Thesis and Dissertation Repository by an authorized administrator of
i
Abstract
The purpose of this study was to investigate the measurement properties of the star excursion balance test (SEBT) in patients with knee osteoarthritis (OA). Specific objectives were to estimate: 1) test-retest reliability, 2) concurrent validity of observer measurements compared to a 3D motion capture system, and 3) longitudinal validity in response to 12 weeks of neuromuscular exercises. Thirty-eight patients diagnosed with knee OA participated. They performed the SEBT on three test occasions. The first two test sessions were completed within one week and the third was 12 weeks later.
Participants performed exercises at home over the 12-week period. Intraclass correlation coefficients (ICC) ranging from 0.70-to-0.94 suggested good-to-excellent reliability. Pearson r ≥0.96 between observer and motion capture measures suggested excellent concurrent validity. Participants significantly improved (p≤0.05) on six directions and the composite score of the SEBT, with standardized response means >0.4. Improvements in the SEBT were low-to-moderately correlated with improvements in 40m walk times and patient-reported outcomes (r=0.24-0.48) suggesting adequate longitudinal validity. The present results suggest appropriate measurement properties for the SEBT in patients with knee OA and support its use in clinical and research settings.
Keywords
ii
Co-Authorship Statement
iii
Acknowledgments
I would like to thank my supervisor Dr. Trevor Birmingham for all of his support and guidance over the last two years. I would not be where I am without his leadership, patience, dedication, and mentorship. I would also like to thank Dr. Rebecca Moyer, Ian Jones, Ryan Pinto, and Dr. Amanda Lorbergs for sharing their knowledge, providing daily assistance, and guiding me through research and study recruitment. I would also like to thank Dr. Dianne Bryant and Dr. Bob Giffin for providing expertise, support, and guidance over the course of my studies.
I am very grateful for my fellow WOBL and FKSMC grad students who assisted with data collection, provided support throughout my degree, and made my time here more enjoyable. I would also like to thank the staff at the Fowler Kennedy Sport Medicine Clinic, in particular Greg, Tracey, Jackie, Kathy, and Marsha for their assistance and help with recruiting in clinic.
Thank you to the Western Bone and Joint Institute and Collaborative Training Program in Musculoskeletal Health Research, which provided me with many invaluable
opportunities to attend informative seminars and learn from and work with students in a transdisciplinary atmosphere.
iv
Table of Contents
Abstract ... i
Co-Authorship Statement... ii
Acknowledgments... iii
Table of Contents ... iv
List of Tables ... viii
List of Figures ... ix
List of Appendices ... x
List of Abbreviations ... xi
Chapter 1 ... 1
1 Introduction ... 1
1.1 Background and Rationale ... 1
1.2 Objectives ... 4
1.3 Hypotheses ... 4
Chapter 2 ... 5
2 Literature Review ... 5
2.1 Anatomy of the Knee Joint ... 5
2.2 Knee Osteoarthritis ... 5
2.2.1 Diagnosis... 6
2.2.2 Epidemiology ... 6
2.2.3 Risk Factors for Knee OA... 7
2.3 Management of Knee OA ... 8
2.3.1 Pharmacological Management ... 8
2.3.2 Non-pharmacological Management ... 9
v
2.4 Research Outcomes in Knee OA ... 10
2.4.1 Reliability and Validity ... 10
2.5 Postural Control ... 11
2.6 Postural Control in Patients with Knee OA ... 12
2.6.1 Static Balance... 12
2.6.2 Dynamic Balance ... 12
2.6.3 Balance and Neuromuscular Training in Patients with Knee OA ... 13
2.7 The Star Excursion Balance Test ... 14
2.8 Reliability and Validity of the SEBT ... 14
2.8.1 Reliability ... 15
2.8.2 Construct Validity ... 17
2.8.3 Concurrent and Discriminant Validity ... 18
2.9 Kinematics and Muscle Activation of the SEBT ... 18
2.10Simplifying the SEBT to 3 Directions ... 19
2.11Ability to Detect Deficits and Improvements ... 20
2.11.1 Ankle Injuries... 20
2.11.2 Knee Injuries ... 22
2.11.3 Limb Asymmetry ... 22
2.12Neuromuscular Training Programs ... 23
2.13Summary ... 25
Chapter 3 ... 26
3 Methods ... 26
3.1 Study Design ... 26
3.2 Participants ... 27
vi
3.3 Outcome Measures... 27
3.3.1 SEBT Test Protocol ... 27
3.3.2 Motion Capture System ... 29
3.3.3 Subject Preparation ... 29
3.3.4 Knee Injury and Osteoarthritis Outcome Score (KOOS) ... 30
3.3.5 40m Fast Paced Walk Test ... 30
3.4 Exercise Program ... 31
3.5 Data Reduction... 31
3.6 Statistical Analysis ... 32
3.6.1 Test-retest Reliability ... 33
3.6.2 Concurrent Validity ... 33
3.6.3 Longitudinal Validity ... 33
3.6.4 Sample Size Justification ... 34
Chapter 4 ... 35
4 Results ... 35
4.1 Test-Retest Reliability ... 36
4.2 Concurrent Validity ... 38
4.3 Longitudinal Validity ... 39
Chapter 5 ... 44
5 Discussion ... 44
5.1 Test-Retest Reliability ... 44
5.2 Concurrent Validity ... 46
5.3 Longitudinal Validity ... 47
5.4 Limitations ... 50
vii
6 Conclusion ... 51
6.1 Future Directions ... 51
References ... 52
Appendices ... 64
viii
List of Tables
Table 1. Participant demographics for the two objectives of test-retest reliability and longitudinal validity ... 35
Table 2. ICC point estimates and 95% confidence intervals with the corresponding standard error of measurement and minimum detectable change (95% level of
confidence) for all reach directions and legs. 𝑆𝐸𝑀 = 𝑀𝑆𝐸, MDC = SEM x 1.96 x 2 ... 37
Table 3. Pearson correlation coefficients between the raw observed and the motion capture measures of reach for each leg and direction of the SEBT. ... 38
Table 4. Normalized (% of leg length) reach distances, mean change, and standardized response means for the affected stance leg at test 1 and test 3. ... 40
Table 5. Normalized reach distances, mean change, and standardized response means for the unaffected stance leg at test 1 and test 3 ... 41
Table 6. Correlation coefficients between mean change SEBT scores and change in functional and questionnaire outcomes to examine longitudinal validity. ... 41
ix
List of Figures
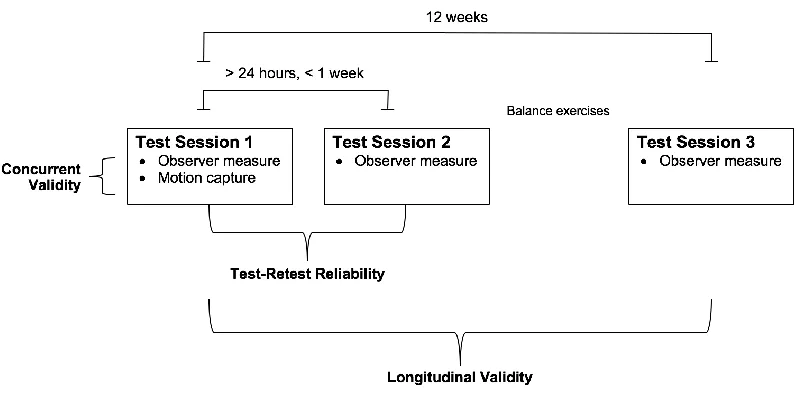
Figure 1. Study design: testing procedures for assessing reliability and validity of the star excursion balance test in patients with knee osteoarthritis. ... 26
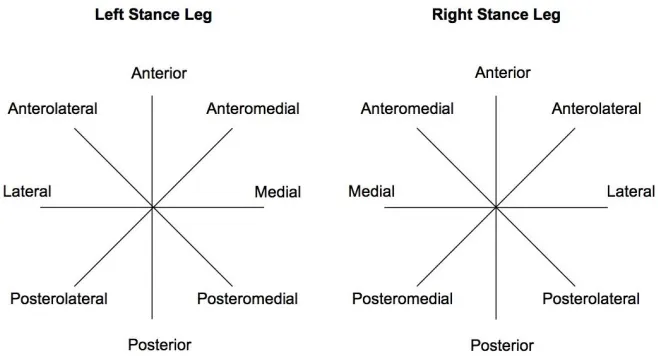
Figure 2. The star excursion balance test set-up for the left and right stance legs. ... 29
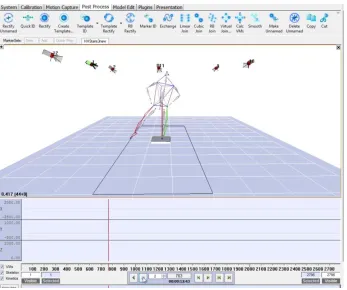
Figure 3. The motion capture computer software used to calculate the maximum reach for concurrent validity of each reach measurement. ... 32
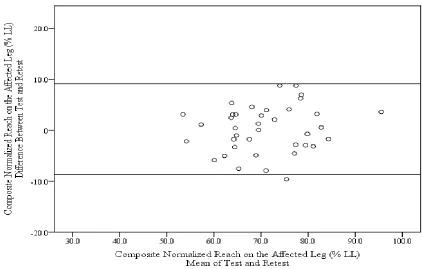
Figure 4. Bland and Altman plot showing the difference between test and retest compared to the mean of test and retest for the composite normalized reach on the affected leg. Horizontal lines indicate the mean ±1.96SD. ... 36
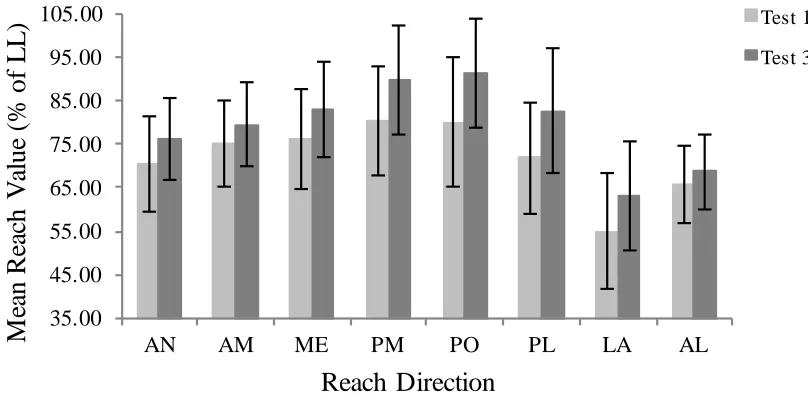
Figure 5. Mean normalized (% of leg length) reach values with standard deviations on the affected leg for all eight reach directions at the first and last test sessions. ... 43
Figure 6. Mean normalized (% of leg length) reach values with standard deviations on the unaffected leg for all eight reach directions at the first and last test sessions. ... 43
x
List of Appendices
Appendix A. Letter of Information and Consent ... 64
xi
List of Abbreviations
ACL Anterior Cruciate Ligament
ADL Activities of Daily Living/Function in Daily Living KOOS subscale
AL Anterolateral Direction of the SEBT relative to stance leg
AN Anterior Direction of the SEBT relative to stance leg
AM Anteromedial Direction of the SEBT relative to stance leg
CAI Chronic Ankle Instability
ICC Intraclass Correlation Coefficient
KOOS Knee Injury and Osteoarthritis Outcome Score
LA Lateral Direction of the SEBT relative to stance leg
LAS Lateral Ankle Sprain
LOS Limits of Stability
MDC Minimum Detectable Change
ME Medial Direction of the SEBT relative to stance leg
OA Osteoarthritis
PL Posterolateral Direction of the SEBT relative to stance leg
PM Posteromedial Direction of the SEBT relative to stance leg
PO Posterior Direction of the SEBT relative to stance leg
QOL Quality of Life
ROM Range of Motion
SEBT Star Excursion Balance Test
SEM Standard Error of Measurement
SRM Standardized Response Mean
Chapter 1
1
Introduction
1.1
Background and Rationale
Knee osteoarthritis (OA) is a musculoskeletal disease that affects over 241 million people worldwide, causing significant pain and disability1. Osteoarthritis is the most common type of arthritis and results in a significant burden on health care systems2–4. The knee is one of the most common joints affected by OA2. Although once considered a disease primarily of the articular cartilage, knee OA is now considered to affect the whole joint4. Knee OA involves the breakdown and abnormalities of cartilage, bone, muscles, and ligaments in the joint. In comparison to healthy individuals, those with OA have decreased quadriceps muscle strength, postural control and joint proprioception5. As a result, individuals experience pain, decreased muscle strength and function, disability, and lowered quality of life.
Although there is presently no cure for OA, there are a variety of treatment options. Initial conservative treatment should include exercise and patient education, with pharmacological treatment options explored if no improvements are seen. Surgical treatments for knee OA are considered when improvements are no longer satisfactory with solely non-operative management options. The main goals of non-operative
treatments are to educate patients, control pain, improve function and potentially slow the progression of disease4,6,7.
Exercise therapy and weight management are the primary non-operative treatment options for knee OA and include aerobic and resistance exercises with patient education regarding diet and managing symptoms. Through exercise, individuals can increase aerobic fitness, assist weight loss, and increase muscle strength and endurance4. Aerobic and resistance exercise can help reduce pain and increase function in individuals with knee OA4. Exercise programs that focus on neuromuscular control of the knee are suggested to be particularly helpful for patients with OA8,9. Such neuromuscular
and postural control exercises, and functional movements such as stepping or lunging with the aim of improving neuromuscular control10,11. Neuromuscular control requires both the coordinated muscle activity to produce the desired movement and functional stability to keep the joint stable during that movement10.
Although neuromuscular exercise has become a mainstay in the treatment of knee OA, there is no widely accepted clinical tool to monitor patient progress in neuromuscular control of the knee8–10. Many tests used in research and clinical settings are appropriate to
monitor disability and function in individuals with knee OA. Commonly used walking and sit to stand tests include the 40m fast-paced walking test, 80m fast-paced walking test, six-minute walk test, timed up and go, and 30-s chair-stand test12. Tests of static balance, the use of force plates to measure postural sway, the Berg Balance Scale, and the Community Balance and Mobility Scale are commonly used to assess standing balance13. However, many of these test static balance, physical function or a combination of
walking and stairs. The Berg Balance Scale has also demonstrated ceiling effects in ambulatory older adults.13 Therefore, there is no widely used clinical test that can be used to assess improvements in neuromuscular control, which requires functional stability and sensorimotor control produced through quality movement9.
We propose that the Star Excursion Balance Test (SEBT), a test of dynamic balance and postural control, may fill this need. The SEBT requires participants to maintain a single leg stance and reach with the other leg as far as possible along a line marked on the ground14,15. The participant makes a light touch at maximal reach, returns to the centre, and repeats this for all eight directions of the star. The maximal reach for each direction is normalized to leg length to provide the measure of performance16. The SEBT is a
challenging dynamic task that requires postural control to maintain balance over the base of support and adequate neuromuscular control of the stance leg to maximize reach distance15.
ankle instability (CAI) and after anterior cruciate ligament (ACL) reconstruction
compared to healthy individuals19–22. A three-direction version of the test (anteromedial, medial, posteromedial) has been used to reduce the amount of time necessary to perform the test and includes the directions most sensitive to reach deficits in individuals with CAI23,24. In individuals with knee OA, improvements were seen on the anterior and
medial directions of the SEBT following a six week lower extremity exercise program25.
1.2
Objectives
The purpose of this study was to estimate the measurement properties of the Star Excursion Balance Test (SEBT) in patients with knee osteoarthritis (OA).
The specific objectives of the study were to:
1) Estimate the relative and absolute test-retest reliability; the agreement between SEBT measurements completed on two separate days within one week
2) Estimate concurrent validity; the association between the observer and motion capture technology measurements of patient performance during the SEBT 3) Estimate longitudinal validity of SEBT measurements in response to 12 weeks of
neuromuscular exercises
1.3
Hypotheses
We hypothesized:
1) Excellent test-retest reliability, characterized by an intraclass correlation
coefficient (ICC) of at least 0.85. We also hypothesize that there will be relatively low standard errors of measurement (SEM) and minimum detectable changes (MDC).
2) Observer and camera measures of performance (distance reached) will be highly correlated (Pearson r>0.75)
3) Performance of the SEBT will improve significantly (p<0.05) following 12 weeks of neuromuscular exercise, with a standardized response mean (SRM) of greater than 0.4 (i.e. a small-to-moderate effect). There will be low-to-moderate
correlations (r=0.2 to 0.5) between improvements in SEBT scores and
Chapter 2
2
Literature Review
2.1
Anatomy of the Knee Joint
The knee joint is the articulation between the tibia, femur, and patella including the menisci and ligaments26. As a modified hinge joint, the tibiofemoral joint and the patellofemoral joint allow flexion and rotation of the lower limb and are supported by ligaments, muscles, and the joint capsule27. The concave medial tibial plateau articulates with the medial femoral condyle and is supported by the medial meniscus, while the lateral tibial plateau articulates with the femoral condyle and has a more convex surface which allows for internal rotation26. The quadriceps muscles, composed of the rectus femoris, the vastus lateralis, the vastus medialis, and the vastus intermedius, act to extend the knee, while the hamstrings, composed of the semitendinosus, semimembranosus, and biceps femoris, act to flex the knee26. The patellofemoral joint articulates with the
trochlea of the anterior femur and acts to increase the lever arm of the quadriceps extensors26.
2.2
Knee Osteoarthritis
Knee osteoarthritis (OA) is a progressive disease of abnormalities and breakdown of the tissues, cartilage, muscles, and ligaments in the knee joint, often leading to pain and disability28. It is the most prevalent kind of arthritis and usually presents as joint pain, causing decreased function or disability for older adults4. There is currently no cure, but total knee replacement is the usual treatment for end-stage knee OA. However, knee OA causes pain, loss of function and disability well before joint replacements are considered. Knee OA is now known to be a whole joint disease, with changes seen in breakdown of the articular cartilage, subchondral sclerosis, osteophyte formation, and changes in the synovium29. Malalignment, muscle weakness, and structural damage can cause further
2.2.1 Diagnosis
Knee OA can be discussed in terms of imaging (x-rays, MRI) and patient-reported
outcomes. The Kellgren-Lawrence (KL) scale used to classify radiographic OA is divided into five categories: no changes, possible osteophytes, definite osteophytes and possible joint space narrowing, moderate osteophytes and definite joint space narrowing, and severe osteophytes with joint space narrowing30. Joint-space narrowing of the
tibiofemoral joint and osteophytes as seen on X-ray evaluation can reflect advanced OA, but this does not represent the full extent of the disease as soft tissues cannot be seen on X-rays4,28. Patient-reported pain and limitations are important; a clinical diagnosis would be made according to a patient’s pain, stiffness, disability, crepitus, reduced movement, and increased age4,31. Although radiographs are the preferred method for diagnosis, many patients can be asymptomatic and therefore clinical criteria to classify patients are also important32. According to the Altman criteria, OA classification by clinical exam requires the patient to have knee pain as well as at least three of six clinical findings; age greater than 50 years, morning stiffness less than 30 minutes, crepitus, bony tenderness on the joint, bony enlargement, and a lack of palpable warmth32. These criteria are 95%
sensitive and 69% specific32. MRI may be used to identify other causes of knee pain, but many patients may have meniscal damage that does not aggravate symptoms4. MRI can be used to quantitatively measure articular cartilage and relaxation time measures may provide further insight into the joint, however these are costly and are not necessary for general diagnosis33.
2.2.2 Epidemiology
A review in 2011 conducted by Pereira et al.31 analyzed 72 articles to examine the differences in prevalence and incidence estimates of knee, hip, and hand OA depending on case definitions. When radiographic definitions were used, prevalence ranged from 7.1% in Croatia to 70.8% in Japan31. Using a symptomatic definition, prevalence ranged from 5.4% in Italy to 24.2% in Korea. The authors suggest that radiographic definitions tend to result in over-estimates of prevalence. Knee OA prevalence was higher in women than in men regardless of the case definition31.
In 2014, Cross et al.3 conducted a systematic review as part of the Global Burden of
Disease study to identify the global disease burden of hip and knee OA. Seventy-two studies were included for knee OA and 45 studies for hip OA. Of the 291 conditions investigated in the overall study, hip and knee OA were identified as 11th for diseases contributing to disability, as measured through years lived with disability (YLD). The global prevalence of radiographically confirmed symptomatic knee OA was 3.8% with a peak at age 503.
2.2.3 Risk Factors for Knee OA
There is a genetic component to OA, but the specific genes involved have not yet been identified4. Other risk factors that are associated with knee OA include increased BMI, age, lower limb malalignment, being female, previous knee injury, overuse, and high bone mineral density29,35–37. Overuse from sports participation is a risk factor for knee osteoarthritis as repetitive joint loading and torque causing knee injuries are associated with joint degeneration35. Smoking does not have a significant association with knee OA
onset36. In addition to being a risk factor for OA, lower limb malalignment and muscle weakness is related to disease progression in those already at risk4,37. Alignment is
increasing malalignment38. Varus alignment increases risk of medial knee OA
progression in people with knee OA and valgus alignment increases risk of lateral knee OA progression38. BMI is one of the few risk factors for OA that can be modified through interventions. Targeting diet, exercise and patient education in the management of knee OA can have a positive impact on BMI and reduce pain and disability39.
2.3
Management of Knee OA
The overall goal for management of knee OA is to educate patients, manage pain, and improve function4. With the rising incidence of OA, mainly as a result of an aging and overweight population, it is becoming increasingly important to diagnose and treat OA early. Although it is difficult to diagnose early in the disease stage, treatment such as exercise and weight management should be considered well before the end-stage of the disease is reached and joint replacement is the primary treatment. Treatment should emphasize patient education and should be individualized according to risk factors, pain, and level of structural damage6,40. Treatment is usually classified as
non-pharmacological, non-pharmacological, and surgical, and often patients will benefit most from combined treatment6,7,33.
2.3.1 Pharmacological Management
Pharmacological treatment usually includes acetaminophen for management of pain in mild to moderate knee OA because it is safe, effective, and can be taken as a first line of treatment4,7,33,39. For individuals who don’t respond to acetaminophen, non-steroidal anti-inflammatory drugs (NSAIDs) may be used with caution but are not indicated for long term use because of their possible negative effects on individuals with cardiorespiratory and gastrointestinal risk factors and their potential toxicity4,7,33,39. Intra-articular (IA) injection of glucocorticoids or hyaluronic acid (HA) can be used to provide longer lasting (one week) pain relief for individuals who don’t respond to analgesics4,7,33. IA
however HA may provide better long lasting relief39. Therefore, with pharmacological treatment options used mainly for pain relief, conservative treatment usually begins with non-pharmacological management including exercise and weight loss.
2.3.2 Non-pharmacological Management
Non-pharmacological treatment includes education, exercise, strength training, and weight management through exercise and diet33,39. Walking aids, braces, and footwear may also be used as part of conservative treatment. Quadriceps muscle weakness is thought to occur in individuals with painful knee OA because of atrophy from disuse, but it has also been seen in individuals without painful OA35. Therefore, as a common
symptom of OA, it is important to target quadriceps strength through exercise programs. Exercise programs, which are often a combination of aerobic activity and muscle
strengthening, provide a small to moderate treatment benefit for patients with knee OA in terms of pain, physical function and quality of life41. Mixed programs are recommended as both aerobic exercise and quadriceps strengthening provide patient improvements on pain and function40,42,43. Neuromuscular programs are recommended to target not only muscle strengthening but also muscle activation and proprioception associated with postural control and functional stability8,10. Biomechanical interventions such as knee braces and orthoses are also included in the guidelines for non-pharmacological management4,7,39.
2.3.3 Surgical Management
Surgical interventions are often considered after non-operative management options fail to provide satisfactory improvements in pain and function. Surgeries include arthroscopy, osteotomy and joint replacement4. Arthroscopic debridement was thought to help with pain and function by removing cartilage and debris in the joint44,45. However,
knee joint loading and patient-reported outcomes for patients with medial knee OA47. It is suggested for younger patients with symptomatic knee OA to delay knee replacement surgery7,47. Knee replacement surgery is now increasingly common, and is cost-effective for treatment of end-stage arthritis when other treatments have failed4,48. Preoperative function is an important indication of function postoperatively, therefore non-surgical management such as exercise should continue even if total joint replacement may eventually be necessary4.
2.4
Research Outcomes in Knee OA
In clinical research of knee OA, both performance-based tests of physical function and self-reported measures are commonly used. The Osteoarthritis Research Society
International has recommended the use of the 30-s chair-stand test, 40m fast-paced walk test, a stair-climb test, timed up-and-go test, and 6-minute walk test for patients with hip and knee osteoarthritis12. The Knee Injury and Osteoarthritis Outcome Score (KOOS)
and WOMAC (Western Ontario and McMaster Universities Osteoarthritis Index) are commonly used self-reported measures for knee OA49,50. It is recommended that both
performance-based tests of physical function and self-reported measures be used in research, as they measure somewhat different parameters. These types of outcome measures often show only moderate correlations with one another. For example, many performance-based tests do not capture the breadth of information covered in a self-reported measure and vice-versa51–53.
2.4.1 Reliability and Validity
determine that measures do not change within a specified amount of time when no change has occurred. Relative reliability gives an estimate of the ratio of subject variability compared to the total variability, which includes subject variability and measurement error55. This enables researchers and clinicians to determine the variability due to error expected beyond the subject variability. Absolute reliability, calculated as the standard error of measurement (SEM), gives an indication of the error of a measurement and is expressed in the same units as the original test54,56. The SEM can be used to
indicate the expected range of scores due to error in retesting and is used to calculate the minimum detectable change (MDC) that would be needed for a true change to occur54. Validity is also important because it provides an indication of the accuracy of an instrument and whether the tool measures what it intends to measure54. Longitudinal validity evaluates the validity of a test over time, which can be related to responsiveness. However responsiveness includes the ability of the tool to detect a meaningful change over time, which involves a minimal clinically important difference54,55. This value is usually determined through clinician expertise, determining whether the change is
significant to the patient, or with the use of an additional health status measure54. Another facet of validity is concurrent validity, which compares the tool against another tool measuring the same construct at the same time54,55. Adequate measurement properties are important to ensure tools being used in rehabilitation and research measure what they intend to measure with low error.
2.5
Postural Control
2.6
Postural Control in Patients with Knee OA
2.6.1 Static Balance
Patients with knee OA performed significantly worse than healthy controls on static (standing) balance tests13. Patients with knee OA demonstrated impaired balance
compared to healthy controls when tested on dynamic and static balance conditions on a Biodex Stability System59. Balance tests that have been used to study patients with knee OA include the Step Test, the Berg Balance Scale, Single Leg Stance Test, and
Functional Reach Test13. However, the Step Test, Single Leg Stance Test, and Functional Reach Test are all primarily measures of static or standing balance13 and their functional relevance is questionable. The Berg Balance Scale measures static and dynamic balance through 14 different tasks, but it has demonstrated ceiling effects in an OA
population13,60.
2.6.2 Dynamic Balance
Individuals with knee OA demonstrate postural control impairments on dynamic balance tasks compared to healthy controls5,61,62. Dynamic postural control can be negatively affected in individuals with knee OA through reduced proprioception, muscle weakness, and joint pain63,64. Individuals with knee OA show greater postural sway compared to healthy controls in both eyes open and eyes closed static and dynamic sway testing65. In addition to greater postural sway, individuals with knee OA also demonstrate frontal and sagittal plane knee instability compared to healthy controls66. Voluntary quadriceps force production is lower in individuals with knee OA compared to healthy controls and
decrease functional abilities and increase fall risk in patients with knee OA. Individuals with knee OA demonstrate static and dynamic balance deficits compared to healthy individuals as a result of many factors including muscle and proprioception deficits. However, there are not many challenging dynamic balance tests that require
neuromuscular control for a population with knee OA. Therefore, it is difficult to evaluate improvements following exercise programs that target lower limb strength and neuromuscular control.
2.6.3 Balance and Neuromuscular Training in Patients with Knee OA
Exercise is one of the most important non-surgical treatment modalities for knee OA, and this includes land exercise, water exercise, and strength training39. Low impact exercise can increase muscle strength, aerobic capacity, and is also important for weight loss and management69. Patients with knee OA have muscle weakness, particularly in the
quadriceps, and functional deficits in postural control10. Neuromuscular training
programs incorporate weight-bearing exercises that often resemble functional activities to build strength and emphasize movement control and quality8,10. Training programs are individualized, with a focus on strength, balance, coordination, and proprioception, while challenging individuals to maintain movement quality during functional tasks8.
Neuromuscular training can be applied to a spectrum of degenerative knee disease, from younger individuals after a major injury to older adults with knee OA8. Neuromuscular training is feasible for patients with knee OA in terms of self-reported pain and shows promise for improvements in self-reported pain and physical function9,10. Individuals
with knee OA have demonstrated improvements in dynamic balance and strength on the affected limb following a six-week exercise program focused on lower extremity
2.7
The Star Excursion Balance Test
The star excursion balance test is a test of dynamic balance that requires participants to maintain a single leg stance and reach with the other leg as far as possible along a line marked on the ground14. The maximum reach is measured for each direction and the scores are interpreted as a measure of dynamic balance14. Eight lines are taped on the floor at 45 to each other, and the participant stands at the centre of the eight lines15. The participant is instructed to reach as far as possible with the non-weightbearing leg in each direction, tap lightly on the tape, and return to the centre. This is performed for all eight directions of the star, which are termed anterior (AN), anteromedial (AM), medial (ME), posteromedial (PM), posterior (PO), posterolateral (PL), lateral (LA), and anterolateral (AL), all relative to the stance leg15. The test challenges the postural control system as the leg reaches outside of the centre of mass, and adequate neuromuscular control is required to increase the excursion distance of the reaching leg15.
Trials are discarded and repeated if the participant lifts or moves the stance foot, loses equilibrium at any point, places considerable support on the reaching foot, does not tap lightly on the line, or fails to return to the starting position15,19. The SEBT is performed in
all eight directions for each stance leg. Reach distances are normalized to leg length, defined as the anterior superior iliac spine to the centre of the ipsilateral medial
malleolus, to control for variation among individuals16. Four practice trials and three test trials are usually conducted17,24.
2.8
Reliability and Validity of the SEBT
Reliability of rehabilitation tests is essential to determine that the measurement error of a test is small enough such that the tool can detect actual changes in the value being
important to provide clinicians and researchers with the information to choose appropriate tests and to interpret when meaningful change has occurred.
2.8.1 Reliability
The first study of the reliability of the SEBT was conducted with 20 healthy young participants who performed the SEBT on two separate occasions, seven days apart14. Five
trials were performed in each of the four directions; anterior, left-anterior, right-posterior, and left-posterior. An average of the three best trials for each direction was used in the analyses. The results demonstrated moderate reliability for the four directions, with estimates of 0.67-0.87. The results from the Spearman Brown prophecy indicated that in order to achieve a reliability estimate of 0.86-0.95, a minimum of six practice sessions would be needed, with the best three of five trials used per direction per session.
A later study was conducted to evaluate the intratester and intertester reliability of the SEBT for two testers, repeated on two days15. Sixteen healthy young participants performed one practice trial in each direction on each leg and three test trials
consecutively in each direction. They performed the full test for the first examiner, and repeated the test on both legs for the second examiner. This was repeated for both examiners one week later. Intratester reliability was estimated from the three trials in each bout on each day using ICCs and standard errors of measurement and intertester reliability was estimated using ICCs and SEMs from the six trials on each day. Estimates of intratester reliability ranged from 0.78 to 0.96 for one tester and 0.82 to 0.96 for the other tester. Estimates of intertester reliability on day one ranged from 0.35 to 0.84, and on day two from 0.81 to 0.93. The results from this study illustrate relatively high
In an effort to simplify the SEBT, Robinson and Gribble conducted a study to determine how many trials were necessary for the SEBT scores to stabilize24. Twenty healthy young adults performed six practice trials and three test trials for each direction of the SEBT on each leg, and the direction of reach was randomized. Reach distances normalized to leg length were used for analysis. All reach directions except AM demonstrated an increase in normalized reach scores across trials. However, the authors concluded that most
directions stabilized within the first four practice trials, leading them to conclude that four practice trials and three test trials may be used.
Further research was done with healthy young adults to examine the intertester and intratester reliability of the SEBT and the relationship between leg dominance and test performance73. Participants performed ten trials of all eight directions of the SEBT on both legs73. No significant differences were found in reach score between the dominant and non-dominant legs, and interrater reliability (ICC>0.99) and intrarater reliability (ICC 0.92-0.99) were high. The reliability values were higher than previous studies, but this was attributed to the placement of the measurement scale on the line rather than being held by the tester, which may have led to more accurate readings. The authors suggest that using the AN, ME, PO, and LA directions may shorten the test and have the same validity as the eight direction test, however it is also suggested that future research is needed to examine different muscle activation for the various directions.
The early reliability studies for the SEBT varied in number of trials and directions used, therefore another study was done to investigate between session reliability and the number of trials needed for measures to stabilize17. The secondary objective was to determine error scores for the SEBT to be able to indicate when true change occurs. Twenty-two healthy participants attended three testing sessions, each separated by a week. Participants performed seven trials in each direction on each leg, with reach direction order and stance leg order randomized, and results were reported normalized to leg length. The results showed no significant differences between males and females or between limbs. Results demonstrated that scores stabilised after 4 trials and ICC values ranged from 0.84 to 0.92, which the authors interpreted as good reliability. The
would fall in this range, and a minimal detectable change would occur if a change of 6.8% or more was demonstrated between tests. However, these results are limited to a healthy university student population.
To further assess reliability, a study was done at two sites with a group of investigators to assess interrater reliability18. Participants performed three test trials in each of the AN,
PM, and PL directions for each of the three raters, with a five-minute rest in between. The average of the three test trials for each direction and a composite score were used as raw data, and scores normalized to leg length were also reported. ICCs ranged from 0.86 to 0.92 for normalized scores, demonstrating excellent reliability, while ICCs for non-normalized scores ranged from 0.89 to 0.94. This study demonstrates that the SEBT can be reliable in the hands of raters of different levels of experience as long as they are trained by an experienced rater.
2.8.2 Construct Validity
2.8.3 Concurrent and Discriminant Validity
Bastien and colleagues75 conducted a study to evaluate the concurrent validity between the observer’s measurement and the motion capture system measurement of maximal reach distance of the SEBT in military personnel with and without lateral ankle sprain (LAS). Secondary objectives were to evaluate discriminant validity of the SEBT maximal reach measurements for the two groups and to determine whether height or leg length was more appropriate for normalization. Ten participants with LAS and ten healthy participants performed a single testing session of three trials in each of the AM, M, and PM directions. The observer maximal reach distance for all three directions was
compared to the motion capture maximal reach distance to assess concurrent validity. Significant correlations were found for the motion capture measurements and the
observer measurements (R2=0.98) and there was excellent agreement for both groups and all three reach directions (ICC=0.99). The SEBT measurements were significantly
different between the healthy and LAS groups for the composite score (6.06%) and for each direction individually, with the A direction showing the largest differences (7.84%). The maximal reach distance for limbs within subjects did not differ significantly. As well, the correlation for height and maximal reach distance was slightly higher than the correlation with leg length. The authors conclude that the observer estimation of maximal reach distance is highly valid and accurate, and that the normalization of reach by height can help increase discriminate validity for LAS participants from healthy participants.
2.9
Kinematics and Muscle Activation of the SEBT
Different movement patterns are seen for each direction of the SEBT and it is suggested that increasing the reach distance in various directions would require an increase in range of motion (ROM) and neuromuscular control at the hip, knee, and ankle76.
the gastrocnemius for the different reach directions (p<0.05)76. The AN direction
demonstrates vastus medialis and vastus lateralis activity, the AL direction demonstrates medial hamstrings, the LA, PL, and PO directions demonstrate biceps femoris and anterior tibialis, and the PM and ME demonstrate tibialis anterior activation76. The authors suggest that these reach differences may be important for clinicians choosing exercises for rehabilitation of specific injuries.
From examining kinematics of the stance leg, results suggest that further reaches are accomplished through greater stance leg hip or knee flexion, or both77. Hip and knee
flexion in combination accounted for 78% and 88% of the variance in the AN and LA reach directions77. In patients with CAI, results demonstrated that frontal plane
displacement of the trunk, hip, and ankle explained 81% of the variance in the maximal AN reach and weightbearing dorsiflexion ROM was significantly correlated with maximal AN reach78. Investigating kinematic data for different reach directions has led authors to conclude that future research is needed to determine which directions are most useful for specific lower extremity injuries. Individuals with lower extremity injuries may use different movement patterns on specific SEBT directions compared to healthy
individuals76,78.
2.10 Simplifying the SEBT to 3 Directions
Hertel and colleagues23 conducted an exploratory study to perform factor analyses on the SEBT to attempt to reduce the number of reach directions and to determine which directions are most affected by CAI. Their results indicated that the PM direction was most representative of the overall performance in both healthy and CAI participants and that the AM, ME, and PM directions demonstrated significant reach deficits for those with CAI compared to the control group. Further research with healthy participants was conducted to investigate how many trials were necessary for the SEBT to stabilize with a secondary purpose of examining sagittal plane movement at the knee and frontal, sagittal, and transverse movement at the hip of the stance leg to determine when movement
suggested that AM, ME, and PM directions could be used to streamline the testing procedure. A commercially available Y Balance Test (YBT) has been compared to the SEBT to determine if differences in reach distance exist between the AN, PM, and PL directions of SEBT79. Participants reached further in the A direction on both legs on the SEBT than the YBT (p<0.005), while no differences were observed in the PM and PL directions79. This may be a result of different visual feedback available, but indicates that reach distance values may not be transferrable from the SEBT to the YBT. The reach distances and associated kinematic patterns of the SEBT and YBT were also explored, with participants reaching further on the AN direction of the SEBT (67.05±4.97) than the YBT (59.74±4.85) but no significant differences seen in the PM and PL directions80. In the anterior direction, hip joint angular displacement was significantly higher on the YBT than the SEBT, while no significant differences in knee and ankle sagittal plane
displacements were observed between the YBT and SEBT80. The differences in reach and hip kinematics on the AN direction of the YBT and SEBT indicate that these tests should not be used interchangeably.
2.11 Ability to Detect Deficits and Improvements
The SEBT requires ankle, knee and hip mobility and adequate strength to perform maximal reaches in eight directions. As a dynamic balance task, it has been used to demonstrate deficits in injured populations compared to healthy controls. It has also been used to assess function before and after rehabilitation and neuromuscular training
programs.
2.11.1 Ankle Injuries
Motte et al. found no significant differences between groups for any of the reach directions (AM, ME, PM), and no significant kinematic differences were seen between groups for the PM direction81. In the AM direction, CAI participants exhibited greater hip flexion (mean difference=-12.95) and trunk rotation (mean difference=26.59) away from the reaching leg than the healthy participants. Pionnier et al. examined the normalized reach as well as the COP, ground reaction forces, and the error of toe touchdown20. They found that participants with CAI had a shorter normalized reach (79.9±9.9% of leg length) than control participants (84.7±7.6% of leg length), as well as an increased error in toe touchdown location compared to control participants. Movement differences observed in those with CAI compared to healthy participants suggests that the SEBT is sensitive to CAI reach deficits and may be useful in rehabilitation programs to assess CAI function and deficits.
Hale et al. examined the effects of a four-week comprehensive rehabilitation program on functional limitations and postural control for those with CAI82. At baseline there were no significant differences in SEBT reach scores between participants with and without CAI, and there were no significant differences between CAI control and intervention groups. The authors reported that the CAI intervention group had greater improvements than the CAI control group and the healthy group on the PM, PL, and LA directions of the SEBT. Doherty et al. conducted a case-control study examining kinematics of the lower
2.11.2 Knee Injuries
Knee injuries, in particular anterior cruciate ligament (ACL) injuries are common in sports. ACL injuries are associated with decreased proprioceptive performance, and therefore postural stability and neuromuscular control is an important focus for injury rehabilitation83. The SEBT is a sufficient challenging functional test to assess dynamic
balance in ACL deficient patients (ACLD)83.
Previous research has been done to investigate if SEBT performance deficits can be detected in ACLD patients and patients who had undergone ACL reconstruction. Significant differences were seen in movement between the ACLD limb and the control group for the AN, PM, and M directions (p≤0.005) with no significant differences between the ACL deficient limb and the uninjured limb of the ACL group for all directions83. In individuals who have had ACL reconstruction, the reach scores for the PM and PL directions were lower for the ACLR group than healthy controls and the ACLR group demonstrated decreased knee flexion on all three directions22. ACLD affects dynamic postural control but more research is needed in this area to investigate the relationship between postural control and predisposition to ACL injury.
2.11.3 Limb Asymmetry
Overmoyer and Reiser conducted a study to examine the relationship between lower-extremity functional asymmetries on various lower-lower-extremity function tasks including the SEBT84. Twenty healthy, recreationally active participants performed three trials of the
SEBT in the AN, PM and PL directions, and the normalized mean and composite score were used. Participants also performed bodyweight squats, quiet standing,
asymmetry and the lower-extremity functional asymmetries of the other tasks as well as between reach distances among bilateral differences.
2.12 Neuromuscular Training Programs
Neuromuscular training programs have been used in rehabilitation and injury prevention contexts to target muscular strength, instability, sensorimotor deficiencies and postural and neuromuscular control8,85. Although many demonstrate patient improvements, very few use the SEBT as a measure of dynamic balance.
Ageberg, Nilsdotter, Kosek and Roos conducted a study to examine baseline measures of a severe knee and hip OA population compared to a reference group and to examine the effects of a neuromuscular training program on patient-reported and functional
outcomes9. The 38 patients with hip OA, 49 patients with knee OA, and 43 reference participants completed the KOOS, chair stands, knee bends per 30 seconds, knee extensor strength, and a 20m walk test at baseline. The OA patients underwent the neuromuscular training program (mean=12 weeks) and repeated the tests prior to total joint arthroplasty. Patients were worse on all measures at baseline compared to the reference group.
Improvements were seen on all outcomes except number of knee bends in 30 seconds. Therefore, neuromuscular training has positive potential for patient important
improvements in function in patients with severe hip and knee OA. However, this before- and-after study did not randomly allocate exercise and control groups and did not directly assess neuromuscular control or dynamic balance. Future research should be done with a larger group of patients with knee OA using measures of dynamic balance.
Filipa, Byrnes, Paterno, Myer, and Hewett conducted a repeated measures study to investigate SEBT performance changes in young female athletes following an eight-week neuromuscular training program85. Nine participants in the intervention group and seven in the control group participated in pre-testing, eight weeks of either bi-weekly
leg using a normalized score for each direction and a composite score as outcomes. Pre-test SEBT scores were not significantly different between groups. There was no
significant change in SEBT scores in the control group after eight weeks, while the training group showed significantly improved composite scores on both limbs (p≤0.04). The mean composite score of the right limb improved from 96.4 ± 11.7% to 104.6 ± 6.1% of leg length and the left limb improved from 96.9 ± 10.1% to 103.4 ± 8.0%. However, no differences were observed in the anterior reach directions for the training group, indicating that different directions may be influenced by different factors. This study demonstrates the longitudinal validity of the SEBT in detecting performance improvements, but cannot be generalized beyond young healthy athletes.
Al-Khlaifat et al. conducted a pilot study to determine the effect of a six-week lower extremity exercise program and patient education on dynamic balance in patients with knee OA25. Prior to this study, the investigators examined the test-retest reliability of the SEBT in 10 healthy volunteers (mean age 46 ± 5.23 years). They reported high reliability (ICC>0.75) and SEM values ranging from 2.34 ± 4.60 %LL to 3.49 ± 6.85 %LL25. The normalized MDC values ranged from 6.5 to 9.69 %LL for the anterior and medial directions. Nineteen participants were enrolled in the study and fourteen completed the study (12 women, 2 men). The main outcomes were balance, pain, and muscle strength, with balance reported from the normalized mean for each of the A and M directions of the SEBT. Pain was measured using the KOOS pain and function in daily living activities subscales, and muscle strength was determined through the average peak torque of the hip abductors, knee flexors and knee extensors. The results showed good adherence to the exercise program (mean attendance was 5.36±0.84 out of 6 sessions). Participants
improved significantly in both the AN (mean difference, -5.06±7.27% of leg length) and ME (mean difference, -6.59±7.77% of leg length) directions on the affected leg, but only in the AN direction (mean difference -5.58±5.35% of leg length) on the unaffected leg. Concentric strength at the knee and isometric strength of the hip also improved
significantly (p≤0.001). Pain and function in daily living significantly improved (p<0.001) at six weeks compared to baseline. Exercise programs that focus on lower extremity strength and balance may help improve dynamic balance, and the star
2.13 Summary
Chapter 3
3
Methods
3.1
Study Design
This study was conducted in the Wolf Orthopaedic Biomechanics Laboratory and the Fowler Kennedy Sport Medicine Clinic at the University of Western Ontario. The study design is illustrated in Figure 1. Two test sessions were completed within one week to assess test-retest reliability. A motion capture system was also used during the initial test session to assess concurrent validity. A third test session was completed after 12 weeks of neuromuscular exercise to assess longitudinal validity. Participants provided written informed consent. The Letter of Information and Ethics Approval Notice are provided in Appendices A and B respectively.
3.2
Participants
3.2.1 Eligibility Criteria
We recruited patients with knee OA from the Fowler Kennedy Sport Medicine Clinic and through poster advertisements. Males and females with clinical knee OA according to the Altman classification were eligible for the study. The Altman classification requires knee pain with at least three of six clinical findings including age greater than 50 years,
morning stiffness less than 30 minutes, crepitus, bony tenderness on the joint, bony enlargement, and lack of palpable warmth32. Participants were recruited after physician diagnosis of knee OA. Exclusion criteria included previous joint replacement,
inflammatory or infectious arthritis of the knee, major neurological disorder, major medical illness, inability to read English, psychiatric illness that limits informed consent, and inability to stand on one limb for five seconds.
3.3
Outcome Measures
The star excursion balance test (SEBT) was performed at all testing sessions using all eight directions of the star15. Pain was assessed immediately before and after each SEBT. The Knee Injury and Osteoarthritis Outcome Score (KOOS) and the 40m fast paced walk test were assessed at the first and last testing sessions. The participant’s age, height, weight and leg length (anterior superior iliac spine to the ipsilateral medial malleolus) were measured at the first test session.
3.3.1 SEBT Test Protocol
maintaining balance on the stance leg. They made a light touch with their toe at the maximal reach, and returned to the original double leg stance position. The participant was required to have their hands on their hips for the entire trial, and the stance foot could not move. A tester monitored the participant’s position and observed and recorded the maximal reach distance for each trial. Trials were discarded and repeated if the observer determined that 1) an appropriate position of the stance limb was not maintained with the knee moving out of line with the toe, 2) the stance foot was lifted or moved from the centre of the grid, 3) the participant did not touch down, or touched down more than once, during the trial, 4) considerable support was put in the reaching leg when touching the ground, or 5) the participant lost balance at any point or failed to return to the starting position.
All participants received verbal and visual instructions before completing the SEBT. One practice trial was performed standing on the unaffected leg in each of the eight directions, and one practice trial was repeated in each direction standing on the affected leg. The order of test direction was performed as follows, relative to stance leg: anterior,
3.3.2 Motion Capture System
A 12-camera motion capture system and motion capture software (Cortex, Motion Analysis Corporation, Santa Rosa, CA) were used to provide a gold standard assessment of the participants’ maximal reach distances during the SEBT. The system was calibrated each morning with a seed and wand calibration. The seed calibration was done with a calibration L-frame set on the force plate to indicate the exact positions of the L frame and the origin of the marker system. The wand calibration was done by waving a wand with three markers at known lengths in the data collection area. This ensures that the measurements made by the cameras match the direct measurement of the wand of known length in the capture area86.
3.3.3 Subject Preparation
Twenty-six markers were placed on anatomical landmarks using adhesive stickers according to a modified Helen Hayes marker set87. Participants performed two standing
“static trials” standing still on a force plate to collect the participant’s mass and assist with building the individualized marker set. Four markers from the medial knee joint line and medial malleolus were removed following the static trial. These markers are used to help define the joint centres of the knee and ankle. The SEBT was then performed, with the first of the two trials in each direction being recorded by the motion capture system. Marker data were captured at a rate of 60 frames per second.
3.3.4 Knee Injury and Osteoarthritis Outcome Score (KOOS)
The Knee Injury and Osteoarthritis Outcome Score (KOOS) is a patient-reported questionnaire comprised of five subscales: pain, symptoms, function in daily living (ADL), function in sport and recreation (Sport/Rec), and knee related quality of life (QOL). Each subscale has a number of questions that are rated with a 5-option Likert scale from zero to four, which is then transformed to a score from 0 to 100. A score of zero indicates extreme knee problems while a score of 100 indicates no knee problems49. The KOOS has been used in male and female populations to assess various knee injuries and degrees of OA and a change of 10 points or more has been suggested to represent a clinical difference88. Participants filled out the KOOS at their first and last test sessions.
3.3.5 40m Fast Paced Walk Test
The 40m Fast Paced Walk Test requires patients to walk four sets of 10m distances. It is the recommended short distance walking test by Osteoarthritis Research Society
International (OARSI) because it is feasible, demonstrates appropriate measurement properties and a range of abilities across degrees of OA12. Participants began at one cone
3.4
Exercise Program
Following testing on the first session, all participants were instructed on balance and strengthening exercises similar to those included in neuromuscular exercise programs for individuals with knee OA10. Patients were instructed to complete the exercises at home three times a week for twelve weeks. Good alignment of the stance knee over the stance foot was emphasized. The exercise program began with range of motion and stretching exercises for the knee. Knee and hip strengthening exercises such as step ups, forward lunges, chair stands, and clam shells were included followed by single and two-leg stance balance exercises. If participants experienced unusual pain or discomfort, we suggested that they stop the exercises and try again the following day.
3.5
Data Reduction
Test-retest reliability and longitudinal validity were estimated using the mean SEBT reach distance, normalized to leg length, for each direction and for a composite score for all eight directions. Concurrent validity was estimated using the raw data (distances) from the first trial of each direction compared to the motion capture measurement.
3.6
Statistical Analysis
The mean of the two maximum reach trials for each direction was calculated for each test session. A normalized value was then calculated by dividing the mean score by lower limb length and multiplying by 100%. A composite reach score was calculated by adding the normalized mean reach for each direction and dividing by 8. The 12-week change scores for SEBT scores, the five domains of the KOOS and the 40m fast paced walk test were calculated from test sessions 1 to 3. All statistical analyses were performed using the Statistical Package for the Social Sciences (SPSS) version 24 (IBM Corp, Armonk, NY).
3.6.1 Test-retest Reliability
We calculated intraclass correlation coefficients (ICC) using a two-way random model for absolute agreement (ICC 2,1)70. We calculated the standard errors of measurement
(SEMs) to find the error associated with an individual’s score. This was estimated by
using the mean square error term from an ANOVA such that SEM = √MSE56. We then used the z value for 95% confidence (1.96) to calculate the error associated with an individual’s SEBT change score (i.e. the minimal detectable change (MDC) at 95%
confidence, where MDC = SEM x 1.96 x √2 )89. We also plotted the difference between
the first and second SEBT measurements against the mean of the first and second
measurements to provide Bland and Altman plots as a visual representation of reliability.
3.6.2 Concurrent Validity
To investigate concurrent validity, we estimated the association between the observer’s measurement of maximum reach and the motion capture maximum reach measurement using Pearson r correlations. This was calculated for each of the eight directions of the star using the raw data for one reach trial and the corresponding measured distance from the motion capture software.
3.6.3 Longitudinal Validity
>0.5 were classified as good, 0.36-0.5 as moderate, 0.2-0.35 as low and r<0.2 as no evidence90.
3.6.4 Sample Size Justification
Chapter 4
4
Results
Participant demographic variables are displayed in Table 1. At this time, 38 participants have completed the first two visits for test-retest reliability and 21 of those participants have completed the third test session for the longitudinal validity outcomes.
Table 1. Participant demographics for the two objectives of test-retest reliability and longitudinal validity
Objective Test-Retest Reliability Longitudinal Validity
(subset of patients)
Number of participants n = 38 n = 21
Sex, male / female 30 / 8 19 / 2
Age, years 58.1 ± 8.3 56.6 ± 1.7
Height, m 1.77 ± 0.08 1.78 ± 0.05
Weight, kg 91.0 ± 17.4 91.0 ± 12.0
BMI, kg/m2 29.0 ± 4.8 28.9 ± 3.5
Leg length, cm 90.3 ± 4.3 90.3 ± 4.1
Days Between Test 1 and 2 6.2 ± 2.5 5.8 ± 6.0
Days Between Test 1 and 3 - 83.7 ± 6.2
4.1
Test-Retest Reliability
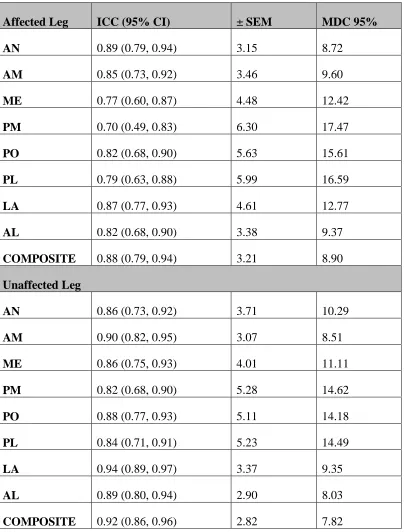
The ICC, SEM, and minimal detectable change values for each direction on both stance legs are reported in Table 2. The test-retest reliability for the normalized reach
measurements for all eight directions on the affected leg was good (ICC 0.70-0.89). On the unaffected leg, the test-retest reliability for the normalized reach measurements of all eight directions was good-to-excellent (ICC 0.82-0.94). Figure 4 shows the Bland and Altman plot for the composite normalized SEBT.
Table 2. ICC point estimates and 95% confidence intervals with the corresponding standard error of measurement and minimum detectable change (95% level of
confidence) for all reach directions and legs. 𝑺𝑬𝑴 = √𝑴𝑺𝑬, MDC = SEM x 1.96 x √𝟐
Affected Leg ICC (95% CI) ± SEM MDC 95%
AN 0.89 (0.79, 0.94) 3.15 8.72
AM 0.85 (0.73, 0.92) 3.46 9.60
ME 0.77 (0.60, 0.87) 4.48 12.42
PM 0.70 (0.49, 0.83) 6.30 17.47
PO 0.82 (0.68, 0.90) 5.63 15.61
PL 0.79 (0.63, 0.88) 5.99 16.59
LA 0.87 (0.77, 0.93) 4.61 12.77
AL 0.82 (0.68, 0.90) 3.38 9.37
COMPOSITE 0.88 (0.79, 0.94) 3.21 8.90
Unaffected Leg
AN 0.86 (0.73, 0.92) 3.71 10.29
AM 0.90 (0.82, 0.95) 3.07 8.51
ME 0.86 (0.75, 0.93) 4.01 11.11
PM 0.82 (0.68, 0.90) 5.28 14.62
PO 0.88 (0.77, 0.93) 5.11 14.18
PL 0.84 (0.71, 0.91) 5.23 14.49
LA 0.94 (0.89, 0.97) 3.37 9.35
AL 0.89 (0.80, 0.94) 2.90 8.03
COMPOSITE 0.92 (0.86, 0.96) 2.82 7.82
4.2
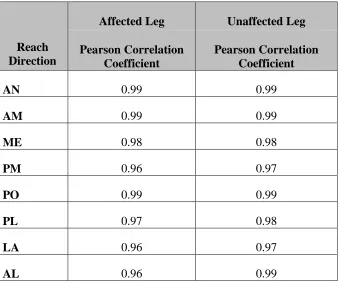
Concurrent Validity
The correlation coefficients between the motion capture measurements and the observer measurements of the reach for both stance legs are shown in Table 3. The motion capture and observer measurements had excellent correlations on both stance legs (r≥0.96).
Table 3. Pearsoncorrelation coefficients between the raw observed and the motion capture measures of reach for each leg and direction of the SEBT.
Reach Direction
Affected Leg Unaffected Leg
Pearson Correlation Coefficient
Pearson Correlation Coefficient
AN 0.99 0.99
AM 0.99 0.99
ME 0.98 0.98
PM 0.96 0.97
PO 0.99 0.99
PL 0.97 0.98
LA 0.96 0.97
4.3
Longitudinal Validity
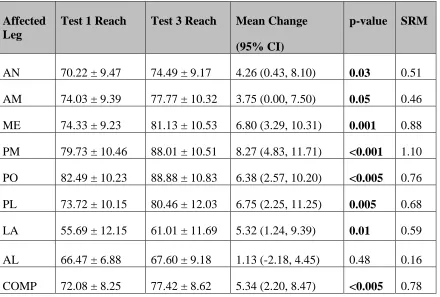
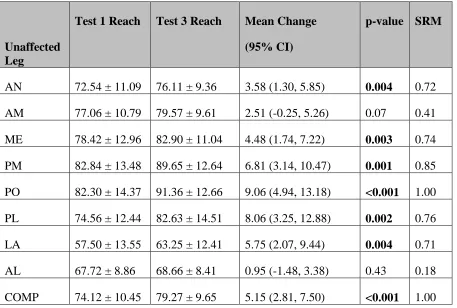
A composite normalized reach value and the mean normalized reach values for each direction on the affected leg are displayed in Table 4 and on the unaffected leg in Table 5. At test session 3, the composite normalized reach on the affected leg (77.42 ± 8.62 %LL) had significantly improved (p=0.002) with a mean change of 5.34% of LL (95% CI 2.20, 8.47) and a standardized response mean of 0.78. The composite normalized reach on the unaffected leg (79.27 ± 9.65 %LL) had also significantly improved (p<0.001) with a mean change of 5.15% of LL (95% CI 2.81, 7.50) and a standardized response mean of 1.00. Significant improvements (p≤0.03) were seen for the anterior, anteromedial, medial, posteromedial, posterior, posterolateral, and lateral directions on the affected leg (Figure 5). On the unaffected leg, significant improvements (p≤0.05) were seen for the anterior, medial, posteromedial, posterior, posterolateral, and lateral directions (Figure 6).
The correlations between the composite normalized change score for each leg and the change in KOOS subscales and 40m walk times are displayed in Table 6 and the
Table 4. Normalized (% of leg length) reach distances, mean change, and standardized response means for the affected stance leg at test 1 and test 3.
Affected Leg
Test 1 Reach Test 3 Reach Mean Change
(95% CI)
p-value SRM
AN 70.22 ± 9.47 74.49 ± 9.17 4.26 (0.43, 8.10) 0.03 0.51
AM 74.03 ± 9.39 77.77 ± 10.32 3.75 (0.00, 7.50) 0.05 0.46
ME 74.33 ± 9.23 81.13 ± 10.53 6.80 (3.29, 10.31) 0.001 0.88
PM 79.73 ± 10.46 88.01 ± 10.51 8.27 (4.83, 11.71) <0.001 1.10
PO 82.49 ± 10.23 88.88 ± 10.83 6.38 (2.57, 10.20) <0.005 0.76
PL 73.72 ± 10.15 80.46 ± 12.03 6.75 (2.25, 11.25) 0.005 0.68
LA 55.69 ± 12.15 61.01 ± 11.69 5.32 (1.24, 9.39) 0.01 0.59
AL 66.47 ± 6.88 67.60 ± 9.18 1.13 (-2.18, 4.45) 0.48 0.16
COMP 72.08 ± 8.25 77.42 ± 8.62 5.34 (2.20, 8.47) <0.005 0.78
Table 5. Normalized reach distances, mean change, and standardized response means for the unaffected stance leg at test 1 and test 3
Unaffected Leg
Test 1 Reach Test 3 Reach Mean Change
(95% CI)
p-value SRM
AN 72.54 ± 11.09 76.11 ± 9.36 3.58 (1.30, 5.85) 0.004 0.72
AM 77.06 ± 10.79 79.57 ± 9.61 2.51 (-0.25, 5.26) 0.07 0.41
ME 78.42 ± 12.96 82.90 ± 11.04 4.48 (1.74, 7.22) 0.003 0.74
PM 82.84 ± 13.48 89.65 ± 12.64 6.81 (3.14, 10.47) 0.001 0.85
PO 82.30 ± 14.37 91.36 ± 12.66 9.06 (4.94, 13.18) <0.001 1.00
PL 74.56 ± 12.44 82.63 ± 14.51 8.06 (3.25, 12.88) 0.002 0.76
LA 57.50 ± 13.55 63.25 ± 12.41 5.75 (2.07, 9.44) 0.004 0.71
AL 67.72 ± 8.86 68.66 ± 8.41 0.95 (-1.48, 3.38) 0.43 0.18
COMP 74.12 ± 10.45 79.27 ± 9.65 5.15 (2.81, 7.50) <0.001 1.00
Reach values are expressed as mean ± SD, % of leg length
Table 6. Correlation coefficients between mean change SEBT scores and change in functional and questionnaire outcomes to examine longitudinal validity.
40m Walk KOOS Pain KOOS Symptoms KOOS ADL KOOS Sport Rec KOOS QOL Mean Change Affected Leg
0.48 0.24 0.30 0.26 0.24 0.26
Mean Change Unaffected Leg
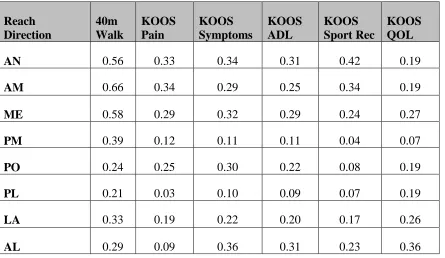
Table 7. Correlation coefficients for the change from test 1 to test 3 in reach on the affected leg and change in the KOOS subscales and 40m walk test.
Reach Direction
40m Walk
KOOS Pain
KOOS Symptoms
KOOS ADL
KOOS Sport Rec
KOOS QOL
AN 0.56 0.33 0.34 0.31 0.42 0.19
AM 0.66 0.34 0.29 0.25 0.34 0.19
ME 0.58 0.29 0.32 0.29 0.24 0.27
PM 0.39 0.12 0.11 0.11 0.04 0.07
PO 0.24 0.25 0.30 0.22 0.08 0.19
PL 0.21 0.03 0.10 0.09 0.07 0.19
LA 0.33 0.19 0.22 0.20 0.17 0.26