ABSTRACT
HERRING, STEPHANIE LAUREN. Effects of Soil Texture and Soil Moisture on
Rotylenchulus reniformis Populations and Cotton Yield in Microplot Systems. (Under the direction of Dr. Stephen R. Koenning.)
= 0.47). Although addition of irrigation did increase yield, the effect on earliness would likely offset any benefits seen from this increase in commercial operation. The
Effects of Soil Texture and Soil Moisture on Rotylenchulus reniformis Populations and Cotton Yield in Microplot Systems
by
Stephanie Lauren Herring
A thesis submitted to the Graduate Faculty of North Carolina State University
in partial fulfillment of the requirements for the degree of
Master of Science
Plant Pathology
Raleigh, North Carolina 2010
APPROVED BY:
_______________________________ ______________________________
BIOGRAPHY
Stephanie Lauren Herring was born in Greenville, SC to Paul and Jackie Herring on July 15, 1985. She spent most of her childhood as a resident of Rose Hill, NC and attended Harrells Christian Academy in Harrells, NC. Following graduation in 2003 she was accepted for general admission to North Carolina State University. She eventually declared her major as Biological Sciences and then added an additional major of Botany before graduation in May 2007. During her time pursuing her Bachelors of Science degrees, Herring found employment within the Department of Plant Pathology working for Dr. Gerald Holmes under direct supervision of Mr. Michael Adams. Herring
cultivated a love for plant pathology during this time and following completing her commitment to the Holmes laboratory decided to pursue a Master of Science also at North Carolina State University. She accepted an offer for a graduate student
ACKNOWLEDGMENTS
The author would like to thank her graduate committee, Dr. Stephen Koenning, Dr. Charles Opperman and Dr. Joshua Heitman for agreeing to serve and for all of their help and support.
Dr. Gerald Van-Dyke, who though he may not remember this one student among many, was instrumental in helping me find my way into the Department of Plant
Pathology when I was a junior looking for an on-campus job.
To all the wonderful professors I have had during my time at North Carolina State during my bachelors’ degrees and especially while pursuing my master’s degree. Your hard work and dedication to your students has not gone unnoticed and will be forever appreciated.
Jack Ward, Jeff Spivey, Jason Greene, and Jim Cole; thank you for all your help with microplot irrigation, running samples and counting tray after tray of nematodes I couldn’t have done this without your help.
James Lanier in Crop Science who ensured I would not slice off any fingers while working the gin over at Reedy Creek and was able to find me cotton seed for my plots.
Adam Howard, thank you for taking the time to go with me and check and recheck and recheck the Moisture•point probes.
Jeffrey Frye thanks for being a great lab mate, it has been quiet around here since you graduated. Thanks for letting me mooch on your parking permit to get to class.
Alex, thanks for being the best room mate I could ask for, but stop being such an over achiever, you make me feel like a slacker.
All the other wonderful friends I’ve made during my time in graduate school and while at NC State. You guys are the best, thank you so much for all your support and for the prodding when it was necessary. Even those of you who aren’t scientist or have no clue what a nematode is except something you heard about on Doug or Spongebob, I appreciate you being there for me to talk to and believing that I would make it.
TABLE OF CONTENTS
LIST OF TABLES...vi
LIST OF FIGURES ...vii
Effects of Soil Texture and Soil Moisture on Rotylenchulus reniformis Populations and Cotton Yield in Microplot Systems ...1
Abstract...1
Introduction...3
Materials and Methods...9
Results...12
Discussion...17
LIST OF TABLES
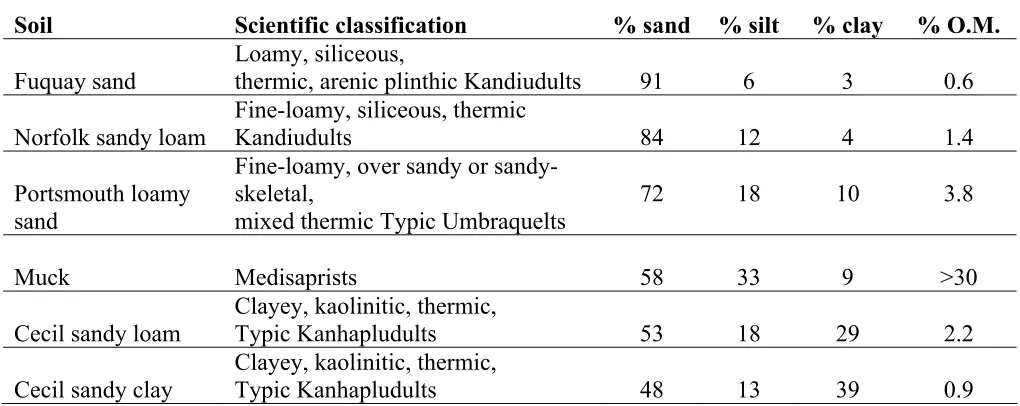
TABLE 1. Scientific classifications of soils along with common name and sand, silt, clay and organic mater percentages of composition...29
TABLE 2. Irrigation, planting and important dates...29
TABLE 3. Mean volumetric soil moisture (θ in m3m-3) at 15cm deep for irrigated (+) and nonirrigated (-) microplots determined on three dates in 2008 for six soil types ... ...30
TABLE 4. Mean volumetric soil moisture (θ in m3m-3) at 15cm deep for irrigated (+) and nonirrigated (-) microplots determined on seven dates in 2009 for six soil types... ...31
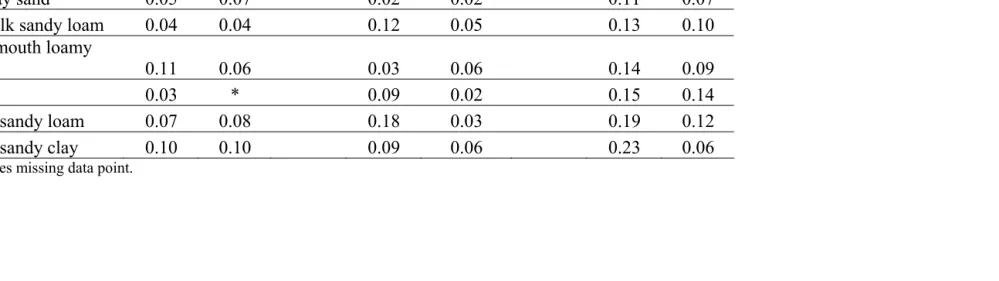
TABLE 5. Mean volumetric soil moisture (θ in m3m-3) at 30cm deep for irrigated (+) and nonirrigated (-) microplots determined on three dates in 2008 for six soil types ... ...32
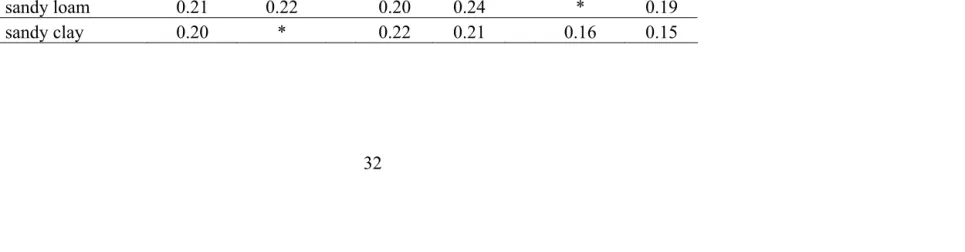
TABLE 7. Partial analysis of variance for effects of soil and irrigation on Rotylenchulus
reniformis population densities for each sample date, at planting (Pi), midseason (Pm),
and cotton harvest (Pf) for 2008 and 2009...33
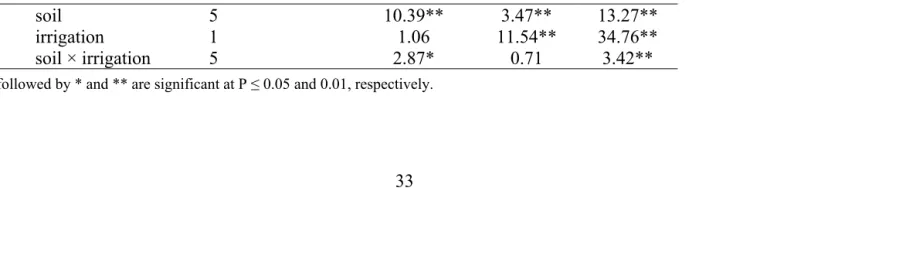
TABLE 8. Partial analysis of variance combined over years 2008 and 2009 for cotton lint yield (g/microplot) ...34
LIST OF FIGURES
FIGURE 1. Life cycle of Rotylenchulus reniformis, originally published in Nematropica
(Robinson et al., 1997). (A) Cotton plant. (B) Verniform female R. reniformis nematode
penetrates cotton root and establishes a feeding site. (C) Male Rotylenchulusreniformis.
(D) Female R. reniformis becomes swollen after feeding and fertilization of oocytes. (E) Fecund female deposits eggs in a gelatinous matrix and egg undergoes cell divisions that lead to development of first-stage juveniles (J1) that molts to form a second-stage
juvenile (J2) that hatches from the egg. (F) J2 through J4 stages are fairly immobile and do not feed (Cuticles are retained from previous molts for J3 and J4 stages... ...36
FIGURE 2. Mean volumetric soil moisture (θ in m3m-3) at 15cm deep for irrigated and nonirrigated microplots determined from all sample dates by soil type. Fuquay specifies Fuquay sand, Norfolk signifies Norfolk sandy loam, Portsmouth is equivalent to
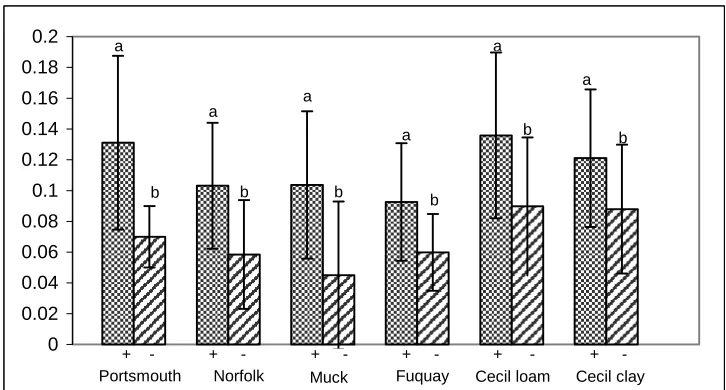
FIGURE 3. Mean volumetric soil moisture (θ in m3m-3) at 15cm deep by soil type determined from all sample dates. Means within a treatment followed by the same letter are not different according to Waller-Duncan k-ratio t test (k-ratio = 100). Fuquay
specifies Fuquay sand, Norfolk signifies Norfolk sandy loam, Portsmouth is equivalent to Portsmouth loamy sand, Cecil loam designates Cecil sandy loam and Cecil clay indicates Cecil sandy clay. ...38
FIGURE 4. Mean volumetric soil moisture (θ in m3m-3) at 15cm deep in irrigated plots by soil type determined from all sample dates. Means within a treatment followed by the same letter are not different according to Waller-Duncan k-ratio t test (k-ratio = 100).
Fuquay specifies Fuquay sand, Norfolk signifies Norfolk sandy loam, Portsmouth is equivalent to Portsmouth loamy sand, Cecil loam designates Cecil sandy loam and Cecil clay indicates Cecil sandy clay ...39
FIGURE 5. Mean volumetric soil moisture (θ in m3m-3) at 15cm deep in nonirrigated plots by soil type determined from all sample dates. Means within a treatment followed by the same letter are not different according to Waller-Duncan k-ratio t test (k-ratio =
FIGURE 6. Mean volumetric soil moisture (θ in m3m-3) at 30cm deep for irrigated and nonirrigated microplots determined from all sample dates by soil type. Fuquay specifies Fuquay sand, Norfolk signifies Norfolk sandy loam, Portsmouth is equivalent to
Portsmouth loamy sand, Cecil loam designates Cecil sandy loam and Cecil clay indicates Cecil sandy clay. – indicates mean among plots receiving no irrigation. + indicates mean among irrigated plots. Means within a soil type treatment followed by the same letter are not different according to Tukey’s Studentized Range (HSD) test (alph = 0.05)... ...40
FIGURE 7. Mean volumetric soil moisture (θ in m3m-3) at 30cm deep by soil type determined from all sample dates. Means within a treatment followed by the same letter are not different according to Waller-Duncan k-ratio t test (k-ratio=100). Fuquay
specifies Fuquay sand, Norfolk signifies Norfolk sandy loam, Portsmouth is equivalent to Portsmouth loamy sand, Cecil loam designates Cecil sandy loam and Cecil clay indicates Cecil sandy clay ...40
FIGURE 8. Mean volumetric soil moisture (θ in m3m-3) at 30cm deep in nonirrigated plots by soil type determined from all sample dates. Means within a treatment followed by the same letter are not different according to Waller-Duncan k-ratio t test (k-ratio =
FIGURE 9. Mean volumetric soil moisture (θ in m3m-3) at 30cm deep in nonirrigated plots by soil type determined from all sample dates. Means within a treatment followed by the same letter are not different according to Waller-Duncan k-ratio t test (k-ratio =
100) Fuquay specifies Fuquay sand, Norfolk signifies Norfolk sandy loam, Portsmouth is equivalent to Portsmouth loamy sand, Cecil loam designates Cecil sandy loam and Cecil clay indicates Cecil sandy clay ...41
FIGURE 10. Mean seed-cotton yield for 2008 at four different harvests. – indicates mean among plots receiving no irrigation. + indicates mean among irrigated plots. Fuquay specifies Fuquay sand, Norfolk signifies Norfolk sandy loam, Portsmouth is equivalent to Portsmouth loamy sand, Cecil loam designates Cecil sandy loam and Cecil clay indicates Cecil sandy clay. ...42
FIGURE 11. Mean seed-cotton yield for 2009 at three different harvests. – indicates mean among plots receiving no irrigation. + indicates mean among irrigated plots. Fuquay specifies Fuquay sand, Norfolk signifies Norfolk sandy loam, Portsmouth is equivalent to Portsmouth loamy sand, Cecil loam designates Cecil sandy loam and Cecil clay indicates Cecil sandy clay. ...43
Cecil sandy clay. Error bars indicate the standard deviation of the mean within that soil type. Means with the same letter do not differ according to Waller-Duncan k-ratio t test
(k-ratio = 100)...43
FIGURE 13. Regression analysis for effects of initial density per 250 cm3 soil (Pi) of
Rotylenchulus reniformis and of irrigation on cotton lint yield of cultivar ST5327B2RF in
Fuquay sand combined for 2008 and 2009. Irrigated = 42 - 6.7x (R2 = 0.23), Nonirrigated = 63 -12.2x (R2 = 0.35) ...44
FIGURE 14. Regression analysis for effects of initial density per 250 cm3 soil (Pi) of
Rotylenchulus reniformis and of irrigation on cotton lint yield of cultivar ST5327B2RF in
Norfolk sandy loam combined for 2008 and 2009. Irrigated = 73 - 11.7x (R2 = 0.42), Nonirrigated = 50.5 - 6.6x (R2 = 0.3)...45
FIGURE 15. Regression analysis for effects of initial density per 250 cm3 soil (Pi) of
Rotylenchulus reniformis and of irrigation on cotton lint yield of cultivar ST5327B2RF in
Portsmouth loamy sand combined for 2008 and 2009. Irrigated = 87.8 - 12.1x (R2 = 0.31), Nonirrigated = 40.5 - 2.9x (R2 = 0.06) ...46
FIGURE 16. Regression analysis for effects of initial density per 250 cm3 soil (Pi) of
Muck combined for 2008 and 2009. Irrigated = 69.4 - 6.2x (R2 = 0.11), Nonirrigated = 52.1 - 7.0x (R2 = 0.26) ...47
FIGURE 17. Regression analysis for effects of initial density per 250 cm3 soil (Pi) of
Rotylenchulus reniformis and of irrigation on cotton lint yield of cultivar ST5327B2RF in
Cecil sandy loam combined for 2008 and 2009. Irrigated = 48.4 – 2.4x (R2 = 0.01), Nonirrigated = 38.1 – 2.3x (R2 = 0.02)...48
FIGURE 18. Regression analysis for effects of initial density per 250 cm3 soil (Pi) of
Rotylenchulus reniformis and of irrigation on cotton lint yield of cultivar ST5327B2RF in
ABSTRACT
HERRING, STEPHANIE L. Effects of Soil Texture and Soil Moisture on Rotylenchulus reniformis Populations and Cotton Yield in Microplot Systems. (Under the direction of
Dr. Stephen R. Koenning).
The effects of soil type, irrigation, on population density of Rotylenchulus
reniformis and cotton were evaluated in a microplot experiment conducted from 2008
through 2009. Six soil types, Fuquay sand (91% sand, 6% silt, 3% clay, 0.6% organic matter), Norfolk sandy loam (84% sand, 12% silt, 4% clay, 1.4% organic matter), Portsmouth loamy sand (72% sand, 18% silt, 10% clay, 3.8% organic matter), Muck (58% sand, 33% silt, 9% clay, >30% organic matter), Cecil sandy loam (53% sand, 18% silt, 29% clay, 2.2% organic matter), and Cecil sandy clay (48% sand, 13% silt, 39% clay, 0.9% organic matter), were arranged in randomized complete blocks with five replications and a minimum of two treatment duplicates per replicate for a total of 240 plots. Irrigation effects on cotton earliness were measured by conducting four separate manual harvests of the crop in 2008 and three separate harvests in 2009. These harvests were combined and ginned to obtain a measure of overall lint yield per plot. Final population (Pf) densities of R. reniformis were greatest in the Portsmouth loamy sand.
However, in spite of R. reniformis population densities, crops planted in this soil did not
have a significant difference in lint yield from a Muck soil that averaged the greatest lint yield per plot. Irrigation did not appear to affect average lint yield for a Cecil sandy clay (P = 0.20), Cecil sandy loam (P = 0.45) or Fuquay sand (P = 0.36). However it did affect
yield in Muck (P = 0.0001), Norfolk sandy loam (P = 0.0001) and Portsmouth loamy
only soil that showed no relationship between yield and Pi was Cecil sandy loam (P =
0.47). Although addition of irrigation did increase yield, the effect on earliness would likely offset any benefits seen from this increase in commercial operation. The
INTRODUCTION
Rotylenchulus reniformis was first described in 1940 by Linford and Oliveira on
the Hawaiian island of Oahu. R. reniformis, also referred to as the reniform nematode due
to the kidney-like shape of the sedentary mature female, has a highly specialized life cycle (Figure 1) (Linford and Oliveria, 1940; Heald and Orr, 1984). Like most plant parasitic nematode species, the first molt takes place while the juvenile is still inside the egg (Sivakumar and Seshadri, 1971; Robinsonet al., 1997). As R. reniformis goes
The rapidity with which it is able to reproduce allows R. reniformis to complete
anywhere from 5-7 generations a year making management of R. reniformis a challenge.
In addition to its rapid reproductive rate, its abilities to colonize deep levels in the soil profile to improve over winter survival and to enter an anhydrobiotic state further complicate management (Koenning et al., 2004; Robinson et al., 2005).
As with most nematode infestations in cotton systems, crop rotation and nematicide use are the major management tactics for R. reniformis. Though rotation is
effective in lowering R. reniformis population density, crop rotation is not a viable
solution in much of the US where cotton is often grown in monoculture (Davis et al., 2003). This is partly due to the broad host range of R. reniformis, which makes it difficult
to select a crop that is economically feasible for growers as well as suitably resistant. In fact since its discovery on cowpea in 1940, Rotylenchulus reniformis has been
demonstrated or reported to reproduce on a number of different host plants. A survey published in 1997 found evidence for reproduction reported on 314 different plant species spanning 77 different plant families.(Robinson et al., 1997) Non-host crops such as resistant soybean, corn, peanut and sorghum are among those investigated as possible rotation candidates for susceptible crops such as cotton and sweetpotato (Thames and Heald, 1974; Heald and Carter, 1985; Cabanillas et al., 1999; Overstreetet al., 2002;
Daviset al., 2003; Koenning et al., 2004; Westphal and Scott, 2005; Koenninget al., 2007; Stetinaet al.,2007; Smithet al.,2009). However many of the soybean cultivars resistant to R. reniformis are still not utilized for economic reasons even though research
crops or the introduction of a fallow period (Thames and Heald, 1974; Heald and Carter, 1985; Cabanillas et al., 1999; Overstreetet al., 2002; Davis et al., 2003; Westphal and Scott, 2005; Stetina et al., 2007; Smith et al., 2009). For example in 2002, Overstreet et al. reported in Louisiana only 25-30% of the cotton crop was rotated to a non-host or a resistant host. On going research, however, demonstrates that reniform nematode
populations rebound very soon after land is returned to a susceptible host crop. Research has also shown that rotation is not significantly more effective than the application of a commercial nematicide and rotation may also result in an increase of other pathogenic nematode species (Thames and Heald, 1974; Heald and Carter, 1985; Cabanillas et al., 1999; Overstreet et al., 2002; Davis et al., 2003; Westphal and Scott, 2005; Koenninget al., 2007; Stetinaet al., 2007; Smithet al., 2009). Nematicide application is an alternative to rotation, but environmental concerns and expense make their usage also problematic.
Due to all these issues related to R. reniformis management, it is important to
understand the factors that can influence the damage caused by this nematode. Soil texture can affect the ability of the host plant to thrive and the subsequent crop-yield suppression caused by plant-parasitic nematodes. The reniform nematode has been associated with soil types having greater silt and (or) clay contents than most plant pathogenic nematodes (Robinsonet al., 1987; Heald and Robinson, 1990; Koenninget al., 1996; Koenning et al., 2004; Mooreetal., 2008). However, at least one study conducted in the Lower Rio Grande Valley of Texas, found no effect of soil type on population densities of R. reniformis, but this may be attributed to the soils investigated
The additional influence of moisture stress on crop yield and nematodes also has the potential to impact the percent of crop loss seen in a given year. Challenges being faced concerning climate change put emphasis on the impact severe drought might play on crop productivity in the presence of nematode pathogens. Keeping these factors in mind, one of the goals of this project was to determine the effect of irrigation and how it interacts with soil texture. In recent related studies, Moore and Lawrence noted such an interaction effect on nematode reproduction and on cotton yield in a microplot system (Moore and Lawrence, 2009). The roles of irrigation and soil texture are also important in the context of recent advances in tactics for nematode management using precision agricultural systems to improve application of fertilizers and pesticides (Vanden Heuvel, 1996; Monfort et al., 2007; Starr et al., 2007). Precision agriculture is of particular
interest in managing nematode populations because nematicide application in particular is problematic due to the tendency toward high mammalian toxicity, potential to
contaminate groundwater, and other non-target effects. Precision application of nematicides using GIS/GPS systems has the potential to lower the costs of nematicides by limiting their placement to portions of fields where they are most beneficial (Monfort et al., 2006). However, more basic knowledge about the impact of soil moisture, soil texture, plant growth, and nematode interactions are required before precision application technology can effectively be utilized.
considered an important crop for many of these farmers who must invest large sums of money for the specialized machinery. In spite of the cost of specialization, cotton
production retains one of the highest farmgate values; surpassed in global returns by only wheat, rice, soybean and maize (Robinson, 2007; Anonymous, 2009b). Upland cotton,
Gossypium hirsutum, accounts for 95 percent of the cotton grown in the United States
and production for the 2008/2009 season was 12.82 million 217.7 kg bales (Edmisten et al., 2005; Anonymous, 2009b). Although cotton is grown and harvested as an annual crop it is a perennial plant giving it characteristics that must be considered in its
management (Edmisten et al., 2005). Cotton is tolerant to drought stress and may become dormant during these periods of moisture stress, resuming growth once favorable
conditions return (Edmisten et al., 2005). Instead of flowering occurring at a separate or distinct growth stage, cotton continues to grow vegetatively as it flowers (Edmisten et al., 2005). Simultaneous vegetative growth and fruiting, coupled with the plant’s tropical origins and its preference for warm to hot growing conditions, also have large impacts on harvesting (Edmisten et al., 2005).
MATERIALS AND METHODS
A soil type and irrigation experiment was conducted in 2008 and 2009 utilizing microplots located at the Central Crops Research Station located near Clayton, NC. Selected plots were previously infested with R. reniformis at various levels including no
infestation (Koenning et al., 1996). Plots each contained one of six soil types; five soils Norfolk sandy loam, Portsmouth loamy sand, Muck, Cecil sandy loam and Cecil sandy clay, collected from the plow layer (Ap horizon material) of other sites and the
indigenous soil, a Fuquay sand (Rich and Barker, 1984; Windham and Barker, 1986; Schmitt et al., 1987; Windham and Barker, 1988; Barker et al., 1988; Barker and Weeks, 1991; Koenning and Barker, 1995; Koenning et al., 1996). The soils were arranged in five randomized complete blocks at the common location in microplots that were 0.76-m-d an0.76-m-d approximately 0.61 meters 0.76-m-deep (Barker et al., 1979). The scientific classification and the sand, silt, clay and organic matter percentages of these soils as taken from their native sites are listed in Table 1.
and Norfolk sandy loam a rate of 26.52 liters/hour and the remaining soil types a rate of 18.95 liters/hour. Low moisture treatments only received irrigation after significant dry periods which threatened the life of the plants (Table 2). All plots were covered with opaque, white plastic tops to reduce the effects of rainfall events.
Moisture•point (Model MP-917, E.S.I. Environmental Sensors Inc., 2071C
Malaview Avenue, Sidney BC V8L 5X6, Canada) probes were installed in 24 of the plots to monitor soil moisture. Plots for probe installation were selected using a random
numbers table. Each population density and moisture regime combination was
represented per soil type and probes remained in selected plots through out the study. Readings were taken prior to the application of any irrigation following two weeks of the plots being covered in 2008 in order to establish a baseline. Readings also were taken at midseason and at the time of final harvest in 2008 (Table 3, Table 5). Following readings in 2008, irrigation was applied to all plots to prepare for soil sampling. Readings began prior to irrigation treatments in 2009 and continued periodically until weather required irrigation be discontinued (Table 4, Table 6).
2008 was determined by conducting four hand harvests over a nine week period, in order to observe any delays in boll set and each harvest was weighed individually. Due to differences in weather conditions only three harvests were conducted over a six week period in 2009. Lint from all four harvests in 2008 were combined by plot and ginned to obtain a total lint yield for the year. Lint yields from the first two harvests were ginned and a total lint yield was calculated based on the ratio of seed cotton yield to lint in 2009.
Samples for nematode assays were collected prior to planting (Pi), mid-season (Pm) and following the final harvest (Pf) in 2008 and 2009. Soil samples comprised of six to eight cores (2.5 cm in diameter) taken to a depth of 15 cm. A 250 cm3 sub-sample was processed by elutriation and centrifugation to extract juvenile nematodes (J2) from soil. (Byrd et al., 1976; Jenkins, 1964)
Analysis of possible interaction effects on nematode population and cotton productivity was conducted using SAS, version 9 (SAS Institute, Cary, NC). Nematode data was transformed log10 (x + 1) to standardize the variance. The Waller Duncan k-ratio test t test and Tukey’s Studentized Range (HSD) test were used for mean separation
RESULTS
When data was combined from both years, soil type affected volumetric water content (θ) independently from irrigation at the 15cm depth (P = 0.0018). The Waller
Duncan k-ratio t test showed the Portsmouth sandy loam and Muck soils had the greatest
differences between irrigated and nonirrigated average θ, but all soils had greater volumetric water content at the 15 cm depth when irrigation was applied (k-ratio = 100) (Figure 2). The combination of both irrigated and nonirrigated plots showed the
Portsmouth loamy sand and the Cecil soils had similar soil volumetric water content at 15 cm (k-ratio = 100) (Figure 3). The Cecil sandy loam differed from the rest of the soil types when compared (k-ratio = 100). The Portsmouth loamy sand and the Cecil sandy clay were similar to the Muck but not to the Norfolk sandy loam or the Fuquay sand (k-ratio = 100). These two soils had equivalent average volumetric water content to but were not entirely dissimilar to Muck (k-ratio = 100).
When only comparing irrigated plots at the 15 cm depth Cecil sandy loam and Fuquay sand differed from each other using the Waller Duncan k-ratio t test (k-ratio =
100) (Figure 4). The Cecil sandy loam had the greatest θ and the Fuquay the lowest of all soil types. The test also showed in nonirrigated plots the Cecil sandy clay and Cecil sandy loam differed from the Muck soil, but no other differences were statistically evident (k-ratio = 100) (Figure 5).
Soil type and irrigation treatment had an interactive effect on θ at 30 cm (P =
volumetric water content (Figure 6) whereas, the Cecil sandy clay, Portsmouth loamy sand and Muck soils had similar θ at this depth (k-ratio = 100). The Norfolk sandy loam and Fuquay had the lowest volumetric soil water content. These two soils were also the only ones which had differences in θ for irrigated versus nonirrigated plots at this depth (k-ratio = 100) (Figure 7). The irrigated Cecil sandy loam had statistically different average θ compared to the other irrigated soils at 30cm (k-ratio = 100) (Figure 8). In the low moisture system the two Cecil soils and Muck had similar average volumetric soil water content (k-ratio = 100) (Figure 9). Norfolk sandy loam and Fuquay sand were also similar and had the smallest average θ (k-ratio = 100).
Soil type was associated with R. reniformis population variation at every sampling
date in both years of the study (Table 7). An interaction between soil type and irrigation affected the initial season population (Pi) and the final population (Pf) in 2009. Both irrigation and soil texture had an effect on the mid-season population (Pm) of this year and the soil type × irrigation interaction was not significant (P ≤ 0.10). The combined data set consistently showed the Portsmouth sandy loam to have a greater reniform nematode population level than all other soil types. Fuquay sand, Muck soil, and Cecil sandy loam generally had lower population levels, however not appreciably from others when comparing using Waller Duncan k-ratio t test (k-ratio = 100).
Nonirrigated Portsmouth sandy loam and Fuquay sand plots produced
while nonirrigated Cecil sandy clay and Cecil sandy loam produced 68% and 59% from the first two harvests. 85% of total average seed cotton yield was harvested from irrigated Muck plots and 84% from irrigated Fuquay sand in 2008. Irrigated Norfolk sandy loam and Portsmouth sandy loam produced 80% of total seed cotton yield on average per plot in this same period. Irrigated Cecil sandy clay had less seed cotton harvested during this period accounting for only 61% on average, however the percentage in irrigated Cecil sandy loam accounting for only 47% on average.
Harvesting began about a week later in 2009 than it had in 2008 due to weather constraints. Nonirrigated Fuquay sand and Muck had an average of approximately 82% of total seed cotton yield in the first and second harvests in 2009 (Figure 11). Data
showed on average in nonirrigated Norfolk sandy loam and Portsmouth sandy loam these harvests were responsible for 78% and 79% of the total seed cotton yield per plot. Cecil sandy loam and Cecil sandy clay nonirrigated plots on average had 67% and 68% of total seed cotton yield in the first two harvests. These harvests were responsible for an average of 85% of the total seed cotton harvested per plot in irrigated Norfolk sandy loam. It also accounted for an average of 73% in irrigated Portsmouth sandy loam, 72% in irrigated Muck, 71% in irrigated Fuquay sand, 70% in Cecil sandy loam and 63% in irrigated Cecil sandy clay.
two year period, but was not different from Cecil sandy loam, Cecil sandy clay, and Norfolk sandy loam (k-ratio = 100).
Soil type (P = 0.05), irrigation treatment (P = 0.0003), and initial nematode
population (P = 0.008) had an effect on average lint yield for the combined data set from
both years and all soils (Table 8). ANOVA by soil type showed an interaction effect between irrigation and Pi for Portsmouth sandy loam (P = 0.01) (Table 9). Irrigation had
no effect on lint yield over the two year period for Cecil sandy clay (P = 0.20), Cecil sandy loam (P = 0.45), and Fuquay sand (P = 0.36). Pi showed no effect on lint yield in
Cecil sandy loam (P = 0.47). Irrigation resulted in increased yield in both the Muck and
Norfolk sandy loam and lint yield was suppressed by R. reniformis Pi in both soils, the
interaction of Pi and irrigation however was NS (P≤ 0.10). Muck soil (P = 0.0001, 0.013,
0.65) and Norfolk sandy loam (P = 0.0001, 0.024, 0.11).
DISCUSSION
The differences established in soil volumetric moisture content were sufficient for the goals of the research project. Higher rates of irrigation were used in the Fuquay sand, Norfolk sandy loam and Muck based on previous experience with the drainage
characteristics of these soils (Koenning and Barker, 1995). Differences in θ associated with irrigation appeared to be more pronounced at 15cm deep in the soil profile than at 30cm. This may have been due to a clay sub-soil beneath most of the plots, which would allow better water retention at this depth. Soils with higher of clay contents, Cecil sandy clay and Cecil sandy loam, had better water retention than very sandy soils such as the Fuquay sand. These two soils showed no effect of irrigation on lint yield. Irrigation water drained rapidly through the Fuquay sand before it could be taken up by the root system so lack of obvious improvement due to irrigation is not surprising. In the Cecil sandy loam and Cecil sandy clay, it is likely that the presence of plant available water even in
nonirrigated plots may have resulted in a similar growth pattern as that of those receiving irrigation, allowing for no statistical differences in lint yield.
captured. However, the percentage of seed cotton harvested on average during the first two harvests of both years was greater in nonirrigated plots than for irrigated plots in all soil types except Norfolk sandy loam in 2009. This calls into question the assumption that additional yield would not be obtained through irrigation since the nonirrigated plants are also producing the bulk of their crop during this period.
Impact of soil type on R. reniformis was similar to results obtained in previous
studies (Koenning et al., 1996). Portsmouth sandy loam was one of the greatest yielding soils in spite of having consistently the greatest nematode population levels. The
Portsmouth was also the only soil in which nematode population and irrigation had an interaction on lint yield. However, regression analysis performed also suggested a Pi × irrigation interaction in Norfolk sandy loam. Fuquay sand regression analysis also suggested an interaction, however, unlike the Norfolk sandy loam and the Portsmouth loamy sand the nonirrigated had a greater intercept and slope than the irrigated. In all other soils these factors appeared to behave independently if there were any effects at all. The appearance of interactions in Norfolk sandy loam and particularly in Portsmouth loamy sand could have been due to the extremely high population levels that were reached in these soils and may explain why this was not also apparent in other soil types. The Fuquay sand does not maintain moisture well and the population and yield potential were not as great as in Norfolk sandy loam or in Portsmouth loamy sand so the
In conclusion, the most significant finding of this research was the interaction of irrigation with Pi in certain soil types. Greater damage caused by reniform nematode with irrigation tended to be in the most productive soils, which may indicate that nematode damage increases with increasing productivity. In these situations control of reniform nematodes becomes more profitable. Koenning et al. found in 2007 it was more cost effective to treat for R. reniformis in situations of high productivity verses in areas with
REFERENCES Anonymous. The Classification of Cotton ,b. 2009a.
Anonymous. Crop Explorer - United States ,c. 2009b.
Apt, W. J. 1976. Survival of reniform nematodes in desiccated soils. Journal of Nematology 8:278.
Asmus, G. L., and Ishima, C. M. 2009. Population fluctuation of Rotylenchulus reniformis in soil cultivated with cotton. Pesquisa Agropecutria Brasileira 44:51-57.
Asmus, G., Inomoto, M., and Cargnin, R. 2008. Cover crops for reniform nematode suppression in cotton: greenhouse and field evaluations. Tropical Plant Pathology 33:85-89.
Barker, K. R., Daughtry, B. I., and Corbett, D. W. 1979. Equipment and techniques for establishing field microplots for the study of soilborne pathogens. Journal of Nematology 11: 10-108.
Barker, K.R., Koenning, S. R., Bostian, A. L., and Ayers, A. R. 1988. Growth and yield responses of soybean to aldicarb. Journal of Nematology 20: 421-431.
Barker, K. R., and Weeks, W. W. 1991 Relationships between soil and levels of
Meloidogyne incognita and tobacco yield and quality. Journal of Nematology 23:82-90. Bird, A. F. 1983. Growth and Molting in Nematodes: Changes in the dimensions and morphology of Rotylenchulusreniformis from start to finish of molting. International
Journal of Parasitology 13:201-206.
Bruce, J. M., and McGawley, E. C. 2006. Egg biology, reproduction and ecology of
Rotylenchulusreniformis isolates. Journal of Nematology 38:264-265 (Abstr.).
Byrd, D., Barker, K., Ferris, H., Nusbaum, C., Griffin, W., and Small, R. 1976. Two Semi-automatic elutriators for extracting nematodes and certain fungi from soil. Journal of Nematology 8: 206-212.
Carpenter, D., Lawrence, K. S., and Boozer, T. V. 2006. Efficacy of abermectin on
Rotylenchulusreniformis nematode development on cotton in various soil types. Journal
of Nematology. 38:265-266 (Abstr.).
Castillo, J. D., and Lawrence, K. S. 2009. Pathogenicity evaluations of nematophagous fungi to control the reniform nematode (Rotylenchulusreniformis) under microplot
conditions. Phytopathology 99:S196 (Abstr.).
Davis, R. 2000. Reniform nematode management in cotton with aldicarb and crop rotation. Phytopathology 90:S18 (Abstr.).
Davis, R. F., Koenning, S. R., Kemerait, R. C., Cummings, T. D., and Shurley, W. D. 2003. Rotylenchulusreniformis management in cotton with crop rotation. Journal of
Nematology 35:58-64.
Diez, A., Lawrence, G. W., and Lawrence, K. S. 2003. Competition of Meloidogyne incognita and Rotylenchulusreniformis on cotton following separate and concomitant
inoculations. Journal of Nematology 35:422-429.
Edmisten, K. L., York, A. C., Yelverton, F. H., Spears, J. F., Bowman, D. T., Bacheler, J. S., Koenning, S.R., Crozier, C. R., Brown, A. B., and Culpepper, A. S. 2005 Cotton Information. North Carolina Cooperative Extension Service College of Agriculture and Life Sciences North Carolina State University.
Eisenback, J. D., Hopkins, N., and Phipps, P. M. 2004. First report of the reniform nematode Rotylenchulusreniformis on cotton in Virginia. Plant Disease 88:683 (Abstr.).
Farias, P. R. S., Barbosa, J. C., Vieira, S. R., Sánchez-Vila, X., and Ferraz, L. C. C. B. 2002. Geostatisical analysis of the spatial distribution of Rotylenchulusreniformis on
cotton cultivated under crop rotation. Russian Journal of Nematology 10:1-9. Faske, T. R., and Starr, J. L. 2006. Sensitivity of Meloidogyne incognita and Rotylenchulus reniformis to abamectin. Journal of Nematology 38:240-244.
Gazaway, W. S., Akridge, J. R., and McLean, K. 2000. Impact of various crop rotations and various winter cover crops on reniform nematode in cotton. Beltwide Cotton
Conference 162 (Abstr.).
Heald, C. M. and Carter, W. W. 1985. Management of the reniform nematode
Rotylenchulusreniformis by crop rotation and nematicides. Journal of Nematology
17:497 (Abstr.).
Heald, C. M. and Heilman, M. D.1971. Interaction of Rotylenchulusreniformis, soil
salinity, and cotton. Journal of Nematology 3:179-182.
Heald, C. M. and Orr, C. C. 1984. Nematode parasites of cotton. Pp 147- 166 in W. R.
Nickle, ed. Plant and Insect Nematodes. M. Dekker, New York.
Heald, C. M. and Robinson, A. F. 1990. Survey of current distribution of Rotylenchulus reniformis in the United States. Journal of Nematology 22:695-699.
Heald, C. M., Thames, W. H., and Wiegand, C. L.1972. Detection of Rotylenchulus reniformis infestations by aerial infrared photography. Journal of Nematology 4:298-300.
Jenkins, W. R.1964. A rapid centrifugal-flotation technique for separating nematodes from soil. Plant Disease Reporter 48:692.
Jones, J. E., Newsom, L. D., and Finley, E.L.1959. Effect of the reniform nematode on yield, plant characters, and fiber properties of Upland cotton. Agronomy Journal 51:353-356.
Jones, J. R., Lawrence, K. S., and Lawrence, G. W. 2006. Evaluation of winter cover crops in cotton cropping for management of Rotylenchulusreniformis. Nematropica
36:53-66.
Kinloch, R. A., and Sprenkel, R. K. 1994. Plant parasitic nematodes associated with cotton in Florida. Journal of Nematology 26:749-752.
Koenning, S.R. 2007. Cultural practices for management of plant parasitic nematodes on cotton. Phytopathology 97:S150 (Abstr.).
Koenning, S. R. and Barker, K. R. 1995. Soybean photosynthesis and yield as influenced by Heteroderaglycines, soil type and irrigation. Journal of Nematology 27:51-62.
Koenning, S. R., Barker, K. R., and Bowman, D. T., 2000. Tolerance of selected cotton lines to Rotylenchulusreniformis. Journal of Nematology 32:519-523.
Koenning, S.R., Kirkpatrick, T. L., Starr, J. L., Wrather, J. A., Walker, N. R., and
Koenning, S. R., Morrison, D. E., and Edmisten, K. L. 2007. Relative efficacy of selected nematicides for management of Rotylenchulusreniformis in cotton. Nematropica
37:227-235.
Koenning, S. R., Overstreet, C., Nowling, J. W., Donald, P. A., Becker, J. O., and Fortnum, B. A. 1999. Survey of crop losses in response to phytoparasicitc nematodes in the United States for 1994. Supplement to the Journal of Nematology 31:587-618. Koenning, S. R., Walters, S. A., and Barker, K.R. 1996. Impact of soil texture on the reproductive and damage potentials of Rotylenchulusreniformis and Meloidogyne incognita on cotton. Journal of Nematology 28:527-536.
Lawrence, G. W., and McLean, K. S. 2000. A survey of plant-parasitic nematodes associated with cotton in northeastern Louisiana. Journal of Nematology 32:508-549. Lawrence, G. W., McLean, K. S., Batson, W. E., Miller, D., and Borbon, J. C. 1990. Response of Rotylenchulusreniformis to nematicide applications on cotton. Supplement
to Journal of Nematology 22:707-711.
Lawrence, K. S., Boozer, T. V., and Carpenter, D. 2006. Efficacy of abermectin on
Rotylenchulusreniformis nematode development on cotton in various soil types. Journal
of Nematology 38:265-266 (Abstr.).
Lawrence, K. S., Lawrence, G. W., and van Santan, E. 2005. Effect of controlled cold storage on recovery of Rotylenchulusreniformis from naturally infested soil. Journal of
Nematology 37:272-275.
Linford, M. B., and Oliveria, J. M. 1940. Rotylenchulusreniformis, nov. gen., n. sp., a
nematode parasite of roots. Proceedings of the Helminthological Society of Washington, D.C. 7:42-44.
Monfort, W. S., Kirkpatrick, T. L., and Mauromoustakos, A. 2008. Spread of
Rotylenchulusreniformis in an Arkansas cotton field over a four-year period. Journal of
Nematology 40:161-166.
Monfort, W. S., Kirkpatrick, T. L., Rothrock, C. S., and Mauromoustakos, A. 2007. Potential for site-specific management of Meloidogyne incognita in cotton using soil
textural zones. Journal of Nematology 39:1-8.
Moore, S. R., and Lawrence, K. S. 2009. Effects of soil types on the reproduction of
Moore, S. R., Lawrence, K. S., Arriaga, F. J., van Santen, E., and Burmester, C. H.,2008. Population dynamics and spatial distribution of Rotylenchulus reniformis upon
introduction into a cotton field. Phytopathology 98:S109-S109 (Abstr.).
Minton, N. A., and Hopper, B. E. 1959. The reniform and sting nematodes in Alabama. Plant Disease Reporter 43:47.
Overstreet, C., McGawley, E. C., and Padgett, B. 2002. Current management strategies employed against the reniform nematode (Rotylenchulusreniformis) in cotton production
in Louisiana, USA. Nematology 4:306-307 (Abstr.).
Palmateer, A. J., Lawrence, K. S., van Santen, E., Morgan-Jones, G. 2004. Interaction of
Rotylenchulusreniformis with seedling disease pathogens of cotton. Journal of
Nematology 36:160-166.
Pettigrew, W. T., Meredith, W. R. Jr., and Young, L. D. 2005. Potassium fertilization effects on cotton lint yield, yield components, and reniform nematode populations. Agronomy Journal 97:1245-1251.
Pontif, M. J.2007. The influence of morning glory, hemp sesbania and Johnsongrass on reproduction of Rotylenchulusreniformis on cotton and soybean. Journal of Nematology
39:76 (Abst.).
Pontif, M. J., and McGawley, E. C. 2005. Impact of three weed species on reproduction of Rotylenchulusreniformis on cotton and soybean. Journal of Nematology 37:388
(Abstr.).
Rich, J. R. and Wright, D. L. 2002. Alternating cotton row patterns to reduce damage from reniform nematodes. Nematropica 32:229-232.
Robbins, R. T. 1982. Phytoparasitic nematodes associated with soybean in Arkansas. Journal of Nematology 14:466 (Abstr.).
Robbins, R. T., Rakes, L. Jackson, L. E., and Dombek, D. G. 1999. Reniform nematode resistance in selected soybean cultivars. Journal of Nematology 31:667-677.
Robinson, A. F. 2007. Reniform in US cotton: When, where, why, and some remedies. Annual Review of Phytopathology 45:263-288.
Robinson, A. F. 2008. Nematode management in cotton. Pp. 149-182. in A. Ciancio and
Robinson, A. F., Akridge, R., Bradford, J. M., Cook, C. G., Gazaway, W. S., Kirkpatrick, T. L., Lawrence, G. W., Lee, G., McGawley, E. C., Overstreet, C., Padgett, B.,
Rodríguez-Kábana, R., Westphal, A., and Young, L. D. 2005. Vertical distribution of
Rotylenchulusreniformis in cotton fields. Journal of Nematology 37:265-271.
Robinson, A. F., and Cook, C. G. 2001. Root-knot and reniform nematode reproduction on kenaf and sunn hemp compared with that on nematode resistant and susceptible cotton. Industrial crops and products 13:249-264.
Robinson, A. F., Cook, C. G., Westphal, A., and Bradford, J. M. 2005. Rotylenchulus reniformis below plow depth suppresses cotton yield and root growth. Journal of
Nematology 37:285-291.
Robinson, A. F., Heald, C. M. 1986. Factors influencing the control of Rotylenchulus reniformis by soil solarization. Journal of Nematology 14:630 (Abst.).
Robinson, A. F., Heald, C. M., and Flanagan, S. L. 1987. Relationships between soil texture and the distributions of Rotylenchulus reniformis, Meloidogyne incognita, and Tylenchulus semipenetrans in the Lower Rio-Grande Valley. Journal of Nematology
19:553 (Abstr.).
Robinson, A. Heald, C. M., Flanagan, S., Thames, W., Amador, J. 1987. Geographical distributions of Rotylenchulus reniformis, Meloidogyne incognita, and Tylenchulus semipenetrans in the Lower Rio-Gande Valley as related to soil texture and land use.
Annals of Applied Nematology (Journal of Nematology 19, Supplement) 1:20-25. Robinson, A. F., Inserra, R. N., Caswell-Chen, E. P., Vovlas, N., and Troccoli, A. 1997.
Rotylenchulus species: Identification, distribution, host ranges, and crop plant resistance.
Nematropica 27:127-180.
Robinson, A. F., Percival, A. E. 2000. State of knowledge regarding sources of resistance to the reniform nematode (Rotylenchulusreniformis) in upland cotton (Gossypium
hirsutum). Journal of Nematology 32:458 (Abstr.).
Robinson, A. F., Westphal, A., Overstreet, C., Padgett, G. B., Greenberg, S. M., Wheeler, T. A., and Stetina, S. R. 2008. Detection of suppressiveness against Rotlyenchulus
reniformis in soil from cotton (Gossypium hirsutum) fields in Texas and Louisiana.
Journal of Nematology 40:35-38
Rodriguez-Kabana, R., Gazaway, W., Weaver, D., King, P., and Weaver, C. 1998. Host suitability of selected tropical legumes and other crops for the reniform nematode,
Sacks, E. J., and Robinson, A. F. 2009. Introgression of resistance to reniform nematode (Rotylenchulusreniformis) into upland cotton (Gossypiumhirsutum) from Gossypium arboreum and a G. hirsutum/Gossypium aridum bridging line. Field Crops Research
112:1-6.
Schmitt, D. P., Ferris, H., and Barker, K. R. 1987. Response of soybean to Heterodera glycines races 1 and 2 in different soil types. Journal of Nematology 19:270-250. Sipes, B. S., Schmitt, D. P., and Chinnasri, B. 2006. Effects of inducers of systemic acquired resistance on reproduction of Meloidogynejavanica and Rotylenchulus reniformis in pineapple. Journal of Nematology 38:319.
Sivakumar, C. V., and Seshardi, A. R. 1971. Life History of the reniform nematode,
Rotylenchulusreniformis Linford and Oliveira, 1940. Indian Journal of Nematology
1:7-20.
Smith, A. 1940. Distribution and relation of meadow nematode, Pratylenchuspratensis,
to Fusarium wilt of cotton in Georgia. Phytopathology 30:710.
Smith, A., and Taylor, A. 1941. Nematode distribution in the 1940 regional cotton-wilt plots. Phytopathology 31:771.
Smith, T. P., Hammond, A., Story, and R., Burris, E. 2009. Evaluation of crop rotations and nematicides for management of reniform nematode in sweetpotato. HortScience 44:574-575 (Abstr.).
Srivastava, A. N., and Sethi, C. L. 1986. Seasonal population fluctuations of Heterodera zeae, Rotylenchulusreniformis, and Tylenchorhynchusvulgaris in Maize-Cowpea-Wheat
rotation. Indian Journal of Nematology 16:16-18.
Starr, J. L., Carneiro, R. G., Ruano, O. 2005. Nematode parasites of cotton and other tropical fiber crops. Pp. 733-750 in M. Luc, Sikora, R. A., and Bridge, J. Plant Parasitic
Nematodes in Subtropical and Tropical Agriculture, ed.2. Wallingford: CABI Publishing. Starr, J. L., Heald, C. M., Robinson, A. F., Smith, R. G., and Krausz, J. P. 1993.
Meloidogyne incognita and Rotylenchulus reniformis and associated soil textures from
some cotton production areas of Texas. Journal of Nematology 25:895-899.
Stetina, S. R., and Young, L. D. 2006. Comparisons of female and egg assays to identify
Rotylenchulus reniformis resistance in cotton. Journal of Nematology 38:326-332.
Stetina, S. R., Young, L. D., Pettigrew, W. T., and Bruns, H. A. 2007. Effect of corn-cotton rotations on reniform nematode populations and crop yield. Nematropica 37:237-248.
Sumner, J. B., and McGawley, E. C. 2005. Egg biology and reproduction of
Rotylenchulus reniformis isolates from the southern United States. Journal of
Nematology 37:397(Abstr.).
Thames, W. H., and Heald, C. M.1974. Chemical and cultural control of Rotylenchulus reniformis on cotton. The Plant Disease Reporter 58:337-341.
United States. Agricultural Research Service, United States. Plant Disease Survey, United States. Bureau of Plant Industry, Soils, and Agricultural Engineering,1923; 1979. The Plant Disease Reporter. Bureau of Plant Industry, U.S. Dept. of Agriculture, Washington, D.C.
Usery, S. R., Lawrence, K. S., Lawrence, G. W., and Burmester, C. H. 2005. Evaluation of cotton cultivars for resistance and tolerance to Rotylenchulus reniformis. Nematropica
35, 121-133.
Usery, S. R., McLean, K. S., Burmester, C. H., van Santen, E., and Meyer, B. A. 2003. Response of selected cotton varieties to the reniform nematode in Alabama. Journal of Nematology 35:368 (Abstr.).
Vanden Heuvel, R. M.1996. The promise of precision agriculture. Journal of Soil and Water Conservation 51:38-40.
Weaver, D. B., Lawrence, K. S., and van Santen, E. 2007. Reniform nematode resistance in upland cotton germplasm. Crop Science 47:19-24.
Wheeler, T. A., Porter, D. O., Archer, D., and Mullinix, Jr., B. G. 2008. Effect of fumigation on Rotylenchulus reniformis population density through subsurface drip
irrigation located every other furrow. Journal of Nematology 10:210-216.
Westphal, A., Robinson, A. F., Scott, A. W., and Santini, J. B. 2004. Depth distribution of Rotylenchulus reniformis under crops of different host status and after fumigation.
Westphal, A., and Scott, A. W. 2005. Implementation of soybean in cotton cropping sequences for management of reniform nematode in South Texas. Crop Science. 45:233-239.
Westphal, A., and Smart, J. R. 2003. Depth distribution of Rotylenchulusreniformis -
Under different tillage and crop sequence systems. Phytopathology 93:1182-1189. Windham G. L., and Barker K. R. 1986. Effects of soil type on the damage potential of
Meloidogyneincognita on soybean. Journal of Nematology 18:331-338.
Windham. G. L., and Barker, K. R. 1988. Winter survival of Meloidogyne incognita in six soil types. Journal of Nematology 20:113-117.
Wreather, J. A., Niblack, T. L., and Milam, M. R. 1992. Survey of plant parasitic nematodes in Missouri cotton fields. Journal of Nematology 24:779-782.
Table 1. Scientific classifications of soils along with common name and sand, silt, clay and organic mater percentages of composition.
Soil Scientific classification % sand % silt % clay % O.M.
Fuquay sand
Loamy, siliceous,
thermic, arenic plinthic Kandiudults 91 6 3 0.6 Norfolk sandy loam
Fine-loamy, siliceous, thermic
Kandiudults 84 12 4 1.4
Portsmouth loamy sand
Fine-loamy, over sandy or sandy-skeletal,
mixed thermic Typic Umbraquelts
72 18 10 3.8
Muck Medisaprists 58 33 9 >30
Cecil sandy loam
Clayey, kaolinitic, thermic,
Typic Kanhapludults 53 18 29 2.2
Cecil sandy clay
Clayey, kaolinitic, thermic,
Typic Kanhapludults 48 13 39 0.9
Table 2. Irrigation, planting and important dates.
Date Notes
June 10, 2008 planting
July 1, 2008 closed plot tops
July 29, 2008 irrigation begun following initial reading September 17, 2008 all plots watered
Table 3. Mean volumetric soil moisture (θ in m3m-3) at 15cm depth for irrigated (+) and nonirrigated (-) microplots determined on three dates in 2008 for six soil types.
July 29, 2008 September 14, 2008 October 31, 2008
+ - + - + -
Fuquay sand 0.05 0.07 0.02 0.02 0.11 0.07
Norfolk sandy loam 0.04 0.04 0.12 0.05 0.13 0.10
Portsmouth loamy
sand 0.11 0.06 0.03 0.06 0.14 0.09
Muck 0.03 * 0.09 0.02 0.15 0.14
Cecil sandy loam 0.07 0.08 0.18 0.03 0.19 0.12
Cecil sandy clay 0.10 0.10 0.09 0.06 0.23 0.06
Table 4. Mean volumetric soil moisture (θ in m3m-3) at 15cm depth for irrigated (+) and nonirrigated (-) microplots determined on seven dates in 2009 for six soil types.
July 29, 2009 August 8, 2009 August 20, 2009
+ - + - + -
Fuquay sand 0.09 0.09 0.12 0.09 0.12 0.03
Norfolk sandy loam * 0.13 0.15 0.11 * 0.04
Portsmouth loamy
sand 0.07 0.05 0.17 0.09 0.16 0.06
Muck 0.06 * 0.14 0.04 0.13 *
Cecil sandy loam 0.09 0.10 0.23 0.19 * 0.10
Cecil sandy clay 0.14 * 0.16 0.18 0.10 0.03
September 3, 2009 September 13, 2009 September 24, 2009 October 8, 2009
+ - + - + - + -
Fuquay sand 0.13 0.04 0.11 0.05 0.13 0.08 0.05 0.06
Norfolk sandy loam 0.14 0.05 0.10 0.03 0.13 0.05 0.05 0.04
Portsmouth loamy sand 0.20 0.10 0.17 0.04 0.18 0.08 0.08 0.08
Muck 0.16 * 0.10 * 0.12 * 0.03 0.03
Cecil sandy loam 0.16 0.09 0.13 0.08 0.16 0.10 0.06 0.06
Cecil sandy clay 0.13 0.09 0.10 0.07 0.15 0.10 0.09 0.09
Table 5. Mean volumetric soil moisture (θ in m3m-3) at 30cm depth for irrigated (+) and nonirrigated (-) microplots determined on three dates in 2008 for six soil types.
July 29, 2008 September 14, 2008 October 31, 2008
+ - + - + -
Fuquay sand 0.02 0.04 0.03 0.02 0.13 0.08
Norfolk sandy loam 0.04 0.04 0.14 0.05 0.14 0.11
Portsmouth loamy sand 0.06 0.11 0.02 0.10 0.21 0.16
Muck 0.05 * 0.11 0.03 0.19 0.17
Cecil sandy loam 0.12 0.17 0.25 0.03 0.22 0.24
Cecil sandy clay 0.10 0.15 0.09 0.08 0.28 0.13
* Indicates missing data point.
Table 6. Mean volumetric soil moisture (θ in m3m-3) at 30cm depth for irrigated (+) and nonirrigated (-) microplots determined on seven dates in 2009 for six soil types.
July 29, 2009 August 8, 2009 August 20, 2009
+ - + - + -
Fuquay sand 0.10 0.07 0.18 0.08 0.18 0.06
Norfolk sandy loam * 0.17 0.16 0.18 * 0.06
Portsmouth loamy sand 0.11 0.12 0.18 0.16 0.17 0.13
Muck 0.04 * 0.15 0.20 0.07 *
Cecil sandy loam 0.21 0.22 0.20 0.24 * 0.19
Table 6. Continued
* Indicates missing data point.
September 3, 2009 September 13, 2009 September 24, 2009 October 8, 2009
+ - + - + - + -
Fuquay sand 0.19 0.09 0.16 0.05 0.19 0.05 0.07 0.06
Norfolk sandy loam 0.15 0.08 0.13 0.06 0.15 0.07 0.10 0.05
Portsmouth loamy sand 0.21 0.12 0.19 0.10 0.19 0.06 0.10 0.10
Muck 0.16 0.18 0.12 0.28 0.11 0.20 0.11 0.22
Cecil sandy loam 0.20 0.19 0.17 0.17 0.19 0.17 0.19 0.18
Cecil sandy clay 0.13 0.17 0.13 0.16 0.13 0.16 0.10 0.17
Table 7. Partial analysis of variance for effects of soil and irrigation on Rotylenchulus reniformis population densities for each sample date, at
planting (Pi), midseason (Pm), and cotton harvest (Pf) for 2008 and 2009.
Source F valuex
2008 DF Pi Pm Pf
soil 5 10.07** 6.98** 10.18**
irrigation 1 1.12 0.02 0.03
soil × irrigation 5 0.66 0.57 1.11
2009 DF Pi Pm Pf
soil 5 10.39** 3.47** 13.27**
irrigation 1 1.06 11.54** 34.76**
soil × irrigation 5 2.87* 0.71 3.42**
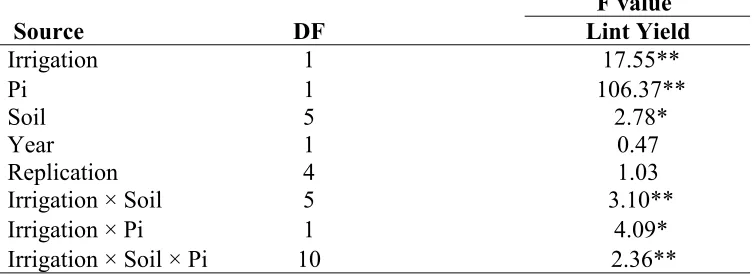
Table 8. Partial analysis of variance combined over years 2008 and 2009 for cotton lint yield (g/microplot).
F valuex
Source DF Lint Yield
Irrigation 1 17.55**
Pi 1 106.37**
Soil 5 2.78*
Year 1 0.47
Replication 4 1.03
Irrigation × Soil 5 3.10**
Irrigation × Pi 1 4.09*
Irrigation × Soil × Pi 10 2.36**
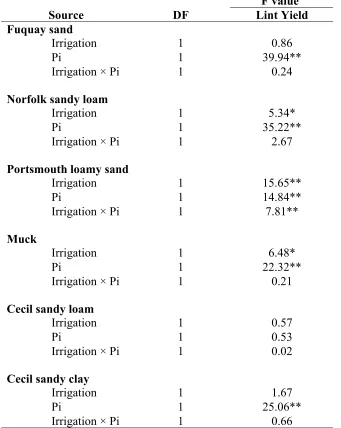
Table 9. Partial analysis of variance combined over years 2008 and 2009 for cotton lint yield (g/microplot).
F valuex
Source DF Lint Yield
Fuquay sand
Irrigation 1 0.86
Pi 1 39.94**
Irrigation × Pi 1 0.24
Norfolk sandy loam
Irrigation 1 5.34*
Pi 1 35.22**
Irrigation × Pi 1 2.67
Portsmouth loamy sand
Irrigation 1 15.65**
Pi 1 14.84**
Irrigation × Pi 1 7.81**
Muck
Irrigation 1 6.48*
Pi 1 22.32**
Irrigation × Pi 1 0.21
Cecil sandy loam
Irrigation 1 0.57
Pi 1 0.53
Irrigation × Pi 1 0.02
Cecil sandy clay
Irrigation 1 1.67
Pi 1 25.06**
Irrigation × Pi 1 0.66
0 0.02 0.04 0.06 0.08 0.1 0.12 0.14 0.16 0.18 0.2
Muck Norfolk
Portsmouth Fuquay Cecil loam Cecil clay
a
a a
a
a
b b b b
b b
+ - + - + - + - + - + -a
Figure 2. Mean volumetric soil moisture (θ in m3m-3) at 15cm depth for irrigated and nonirrigated
0 0.02 0.04 0.06 0.08 0.1 0.12 0.14 0.16 0.18 A v er ag e vo lu m e tr ic w a ter co n te n t c a ab ab bc c
Cecil loam Cecil clay Portsmouth Muck Norfolk Fuquay
Figure 3. Mean volumetric soil moisture (θ in m3m-3) at 15cm depth by soil type determined from all
0 0.02 0.04 0.06 0.08 0.1 0.12 0.14 0.16 0.18 0.2 A v er ag e vo lu m e tr ic w a ter co n te n
t a ab
ab
ab ab
b
Cecil loam Portsmouth Cecil clay Muck Norfolk Fuquay
Figure 4. Mean volumetric soil moisture (θ in m3m-3) at 15cm depth in irrigated plots by soil type
determined from all sample dates. Means within a treatment followed by the same letter are not different according to Waller-Duncan k-ratio t test (k-ratio = 100). Fuquay specifies Fuquay sand, Norfolk signifies Norfolk sandy loam, Portsmouth is equivalent to Portsmouth loamy sand, Cecil loam designates Cecil sandy loam and Cecil clay indicates Cecil sandy clay.
-0.02 0 0.02 0.04 0.06 0.08 0.1 0.12 0.14 0.16 A v er ag e vo lu m e tr ic w a ter co n te n t a a ab ab ab b
Cecil loam Cecil clay Portsmouth Fuquay Norfolk Muck
Figure 5. Mean volumetric soil moisture (θ in m3m-3) at 15cm depth in nonirrigated plots by soil type
0 0.05 0.1 0.15 0.2 0.25 0.3 Av erage vol u m e tri c water content a a a a a a a a a a b b Muck Norfolk
Portsmouth Fuquay Cecil loam Cecil clay
+ - + - + - + - + - +
-Figure 6. Mean volumetric soil moisture (θ in m3m-3) at 30cm depth for irrigated and nonirrigated
microplots determined from all sample dates by soil type. Fuquay specifies Fuquay sand, Norfolk signifies Norfolk sandy loam, Portsmouth is equivalent to Portsmouth loamy sand, Cecil loam designates Cecil sandy loam and Cecil clay indicates Cecil sandy clay. – indicates mean among plots receiving no irrigation. + indicates mean among irrigated plots. Means within a soil type treatment followed by the same letter are not different according to Tukey’s Studentized Range (HSD) test (alpha = 0.05).
0 0.05 0.1 0.15 0.2 0.25 0.3 Average vol u m e tri c water con tent a
b b b
c c
Cecil loam Cecil clay Portsmouth Muck Norfolk Fuquay
Figure 7. Mean volumetric soil moisture (θ in m3m-3) at 30cm depth by soil type determined from all
0 0.05 0.1 0.15 0.2 0.25 0.3 Aver age vol u m etri
c water conten
t a b b b b b
Cecil loam Portsmouth Cecil clay Fuquay Norfolk Muck
Figure 8. Mean volumetric soil moisture (θ in m3m-3) at 30cm depth in irrigated plots by soil type
determined from all sample dates. Means within a treatment followed by the same letter are not different according to Waller-Duncan k-ratio t test (k-ratio = 100). Fuquay specifies Fuquay sand, Norfolk signifies Norfolk sandy loam, Portsmouth is equivalent to Portsmouth loamy sand, Cecil loam designates Cecil sandy loam and Cecil clay indicates Cecil sandy clay.
0 0.05 0.1 0.15 0.2 0.25 Aver age vol u m etri
c water conten
t a a
a
b
c
c
Cecil loam Muck Cecil clay Portsmouth Norfolk Fuquay
Figure 9. Mean volumetric soil moisture (θ in m3m-3) at 30cm depth in nonirrigated plots by soil type
0 20 40 60 80 100 120 140 160
Seed-C
ot
ton Yi
el
d (
g/
M
icropl
ot
)
11-Nov
28-Oct
6-Oct
18-Sep
Fuquay
- + - + - + - + - + - +
Norfolk Portsmouth Muck Cecil loam Cecil clay
0 20 40 60 80 100 120 140 160
Seed-cotton yield (g/Microplot)
26-Oct
9-Oct
24-Sep
Fuquay
- + - + - + - + - + - +
Norfolk Portsmouth Muck Cecil loam Cecilclay
Figure 11. Mean seed-cotton yield for 2009 at three different harvests. – indicates mean among plots receiving no irrigation. + indicates mean among irrigated plots. Fuquay specifies Fuquay sand, Norfolk signifies Norfolk sandy loam, Portsmouth is equivalent to Portsmouth loamy sand, Cecil loam designates Cecil sandy loam and Cecil clay indicates Cecil sandy clay.
0 10 20 30 40 50 60 70 80 A v e ra ge c ot ton l int y ie ld ( g/ M ic ropl ot ) a ab bc bc bc c
Cecil loam Cecil clay
Portsmouth Norfolk Fuquay
Muck
0 1 2 3 4 5 6
Cotton Lint Yield (g/ Mic
roplot)
0 20 40 60 80 100 120 140 160
Irrigated
Nonirrigated
Log10 (Pi + 1)
Figure 13. Regression analysis for effects of initial density per 250 cm3 soil (Pi) of
0 1 2 3 4 5 6
Cotton Lint Yield (g/ Mic
roplot)
0 20 40 60 80 100 120 140 160
Irrigated
Nonirrigated
Log10 (Pi + 1)
Figure 14. Regression analysis for effects of initial density per 250 cm3 soil (Pi) of
0 1 2 3 4 5 6
Cotton Lint Yield (g/ Mic
roplot)
0 20 40 60 80 100 120 140 160
Irrigated
Nonirrigated
Log10 (Pi + 1)
Figure 15. Regression analysis for effects of initial density per 250 cm3 soil (Pi) of
0 1 2 3 4 5
Cotton Lint Yield (g/ Mic
roplot)
0 20 40 60 80 100 120 140 160
Irrigated
Nonirrigated
Log10 (Pi + 1)
Figure 16. Regression analysis for effects of initial density per 250 cm3 soil (Pi) of
0 1 2 3 4 5
Cotton Lint Yield (g/ Mic
roplot)
0 20 40 60 80 100 120 140 160
Irrigated
Nonirrigated
Log10 (Pi + 1)
Figure 17. Regression analysis for effects of initial density per 250 cm3 soil (Pi) of
Rotylenchulus reniformis and of irrigation on cotton lint yield of cultivar ST5327B2RF in Cecil sandy loam
0 1 2 3 4 5 6
Cotton Lint Yield (g/ Mic
roplot)
0 20 40 60 80 100 120 140 160
Irrigated
Nonirrigated
Log10 (Pi + 1)
Figure 18. Regression analysis for effects of initial density per 250 cm3 soil (Pi) of