Particle Swarm Optimization Feature
Selection for Data Stream Mining
Prof. Ram B. Joshi,
Snehal Vilas RodeHead of Department, Dept. of Computer, Indira College of Engineering and Management, SPPU, Pune, India
M.E Student, Dept. of Computer, Indira College of Engineering and Management, SPPU, Pune, India
ABSTRACT: Big data concept is used in every industry or any business. Big data can be characterized by 3Vs: the
extreme volume of data, the wide variety of types of data and the velocity at which the data must be processed. Although big data doesn't refer to any specific quantity, the term is often used when speaking about petabytes and Exabyte of data, much of which cannot be integrated easily. Big data contains not only the challenges that are coming from academic research communities but also commercial IT deployment, the root sources of Big Data are founded on data streams and the curse of dimensionality. It is generally known that data which are sourced from data streams accumulate continuously making traditional batch-based model induction algorithms infeasible for real-time data mining. Feature selection allows us to selection of data through its features we can filter the data using their features. But when the large dataset come the feature selection becomes complicated, and for the high dimension of data the feature which are used to fi9lter are also increased.
KEYWORDS: Particle Swarm Optimization, Swarm Intelligence, Classification, Big data.
I. INTRODUCTION
People tend to invest in stock of a company due to its high rate of return. However, stock prices are continuously changing and most investors including experienced investors fail to understand the market trends. Investors are often influenced by crowd psychology and tend to go with majority decision of buying or selling stock which may be against the current market trend.
Hence, an effective financial system is required which can make objective decision of whether to buy or sell the stock. There are many prediction methods available for making stock prediction such as chartist method, regression analysis and neural networks. This project application uses the PSO for data optimization, feature selection and data mining for modeling the stock because of its ability to learn from the given training data and then generalize a rule.
The principal strength with the network is its ability to find patterns and irregularities as well as detecting multi-dimensional non-linear connections in data. The model is trained using the historical daily stock quotes of at-least two years. The historical stock quotes can be fed directly through the Yahoo Finance Server using internet or from the local database. Once the model is successfully trained, the model can be used to predict the value of share in future. This allows the investors to reduce the risk of investing, and enables easier decision making resulting in maximum financial gain[1].
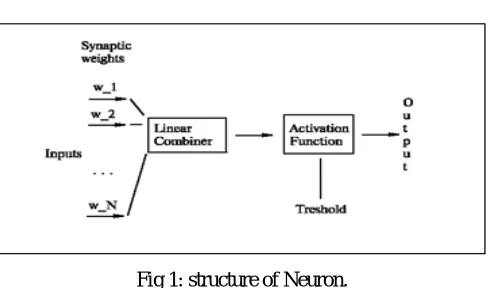
Fig 1: structure of Neuron.
This project mainly focuses on data optimization which will be given input to feature selection, and points out the shortage that exists in current traditional statistical analysis in the stock, then makes use of PSO for data optimization, feature trend selection and then uses Data mining algorithm to predict the stock market by establishing a three-tier structure of the neural network, namely input layer, hidden layer and output layer. After building the data pre-processing set before data mining, lots of widely used stock market technical indicators. Finally, we get a better predictive model to improve forecast accuracy.
In this project, we apply data mining technology to Indian stock market in order to research the trend of price, it aims to predict the future trend of the stock market and the fluctuation of price. Neural network is used to optimized the data,The Neural Networking algorithms (at least some of them) are modeled after the brain (not necessarily - human brain) and how it processes the information. The brain is a very efficient tool. Having about 100,000 times solver response time than computer chips, it (so far) beats the computer in complex tasks, such as image and sound recognition, motion control and so on. It is also about 10,000,000,000 times more efficient than the computer chip in terms of energy consumption per operation.
A neuron is an electrically excitable cell that processes and transmits information through electrical and chemical signals. Our "artificial" neuron will have inputs (all N of them) and one output:Set of nodes that connects it to inputs, output, or other neurons, these nodes are also called synapses.
Specifically, this paper makes the following contributions:
Data optimization of the data which will be given input to the data mining.
Till now Particle swarm optimization is exist only for the ECG system, this paper present PSO for the stock market dataset, so whatever data will be given for feature extraction is already optimized so that the accurate feature will be extracted and the prediction will be more accurate.
This paper continues to exist as follows: section II presents related work Section III is about design details of proposed PSO system. Finally the paper concludes in section V.
Hence, an effective financial system is required which can make objective decision of whether to buy or sell the stock. There are many prediction methods available for making stock prediction such as chartist method, regression analysis and neural networks. This project application uses the PSO for data optimization, feature selection and data mining for modeling the stock because of its ability to learn from the given training data and then generalize a rule.
II. RELATEDWORK
A. COLLABORATIVE FILTERING
Collaborative filtering: This method is based on the user behavior and prediction. The fundamentalconcept is that collect the opinion from the other users, in such a way to provide some prediction aboutthe active user prediction. For example, if one person like item which is like by group of other personthen he will likely agreed upon the item which is like by that same group. Two types of Collaborative
Memory based Collaborative filtering
Another name is lazy recommendation algorithm. It calculates the customer prediction for an objectwhen customers ask for collection of recommendation. Hence algorithms need to store the customerrating information in memory. There are two different algorithm based on k-nearest algorithm: 1.Itembased filtering, 2. Customer based filtering Item based filtering method is based on the most similaritems/objects. The item is considered for similarity when same group of customer ranked them highly.For every item which belong to a current customer, the neighborhood of same object is consideredand every top k-neighbor are put on the list, and recommendation are present to active user. Customerbased filtering compare the active customer/user to the other neighbor which have a past concurrencewith the active user. First all neighbor are find out and then the entire object which belongs to neighborwhich are strange for active customer are regarded as a suggestion.
Model based Collaborative Filtering:
This method is based on the dataset of rating, where we extract information from dataset, and use thatas a model to calculate recommendation with no use of entire dataset which benefits of both speedand scalability.
B. TUPLE BASED RECOMMENDATION SYSTEM
Recommendation system used the query log registry which stored history of every old user who was use this system. And tuple based system used the data which is retrieved from previously executedquery. Every successfully executed query and there result are stored with the all output which containstuple data. The downside of this system is increase complexity. The size of data increases linearlywith increasing session summary. And every time we want to compare the current user session data with previous user stored data.
C. FRAGMENT BASED RECOMMENDATION SYSTEM
This method implementation is same as the Tuple based recommendation method. The main difference is in method of session data comparison. In fragment base system, we use fragments of queryinstead of the witness means all tuple included data. In this method entered query is fragmented and those fragments are used to comparison. This method gives better result than tuple based recommendation.
D. TRADITIONAL AND INCREMENTAL APPROACH
III.SYSTEMARCHITECTURE
Fig.2. System Architecture
In this system the data input is downloaded from the server and given to the normalize module, the data is also given to the PSO and BPSO module which will optimize the data , the combination of both normalize data and the output of PSO and BPSO is given as a input to the feature extraction module. Technical parameters are nothing but the graphical comparison of data it will check the data by graph and the analysis or the differences are taken from the measure, so the feature extraction contains the input of the normalize, PSO & BPSO , technical parameters the output of the feature extraction module are given to the back propagation algorithm which will contains the activation function which is summation of weights, the output is given to the training module which contains the patterns that are occurring against the time of period according to that the training dataset is created and given back to the module, then the classification is done for the calculating the price means the pattern is checked for the classification and then the trending price will be given to the end user.
IV.PSEUDO CODE
Algorithm 1: Backpropagation Algorithm
1) Assign all network inputs and output
2) Initialize all weights with small random numbers, typically between -1 and 1 3) Repeat
3.1) for every pattern in the training set 3.2) present the pattern to the network 3.3) for each layer in the network for every node in the layer
1. Calculate the weight sum of the inputs to the node 2. Add the threshold to the sum
End
3.4) for every node in the output layer calculate the error signal End
3.5) for all hidden layers for every node in the layer 1. Calculate the node’s signal error
2. Update each node’s weight in the network End
End End
While ((maximum number of iterations i than specified) AND (Error Function than specified))
Algorithm 2: Calculating weight using neural network
1) Randomly choose the initial weights 2) INITIALIZE ERROR VAL
3) NORMALIZE STOCK VALUE STKVAL = STKVAL/MAX VAL
4) LOOP While error is too large ( ERROR VAL = 0.5) For each training pattern (Set Input 4 Value and Set Desired )
5) Apply the inputs to the network
6) Calculate the output for every neuron from the input layer, through the hidden layer(s), to the output layer 7) Calculate the error at the outputs
8) Use the output error to compute error signals for pre-output layers 9) Use the error signals to compute weight adjustments
10) Apply the weight adjustments 11) END LOOP
12) Periodically evaluate the network performance
Algorithm 3: Particle swarm optimization
1) Initialize the particles with random velocities and positions in a given Dimension.
2) Compute the fitness of all particles using the desired benchmark function, choose the lowest one as global best and assign the current positions of all particles as their best.
3) Calculate the next velocities and positions using the equations 1 and 2.
4) Calculate the fitness of all particles using the updated velocities and positions. If the new fitness is less than the particles best fitness, the new fitness is considered the best one. In the same way the new position is considered the particle best position.
5) In the same way if the new particle’s best fitness is less than the overall global best fitness, it is considered the new best global fitness and its corresponding position is considered new global best position.
6) Repeat third step for desired number of function evaluations.
V. MATHEMATICALMODEL
The proposed system S is defined as follows: S = I, O, F Where I: Input O: Output F: Functions U: User Where I= R, ND, OD Where
OD= Optimized data
O = OD, FS, CD, TT, TP Where
OD = Optimized data FS = Features Set. CD = Classified data. TT = Training tuple. TP = Trending Price.
F = PSO, BPSO, BP Where
PSO = Particle swarm optimization
BPSO = B-Positive Particle Swarm Optimization BP= Back Propagation
VI.SIMULATION RESULTS
System Implementation (Pre-processing)
The prototype of the proposed system is implemented using java.
Filter
The Data collected by the sensor is filtered using High Pass and Low Pass Filter. The filtered data is further given for Feature extraction Process
Feature Extraction Normalization Process
The Filtered data is normalized using the below featureextraction methods
I. Standard deviation of the NN The simplest variable to calculate is the SDNN that is the squareroot of variance. Since variance is mathematically equal to total power of spectral analysis, SDNNreflects all the cyclic components responsible for variability in the period of recording. In many studies,SDNN is calculated over a 24 hours period and thus encompasses both short-term high frequencyvariation, as well as the lowest frequency components seen in a 24-hours period, as the period ofmonitoring decreases, SDNN estimates shorter and shorter cycle lengths. It should also be noted thatthe total variance increases with the length of analyzed recording. Thus SDNN is not a well-definedstatically quantity because of its dependence on the length of recording period. Thus, in practice, it isinappropriate to compare SDNN measures obtained from recordings of different durations.
II. Standard deviation of differences between adjacent NN intervals. The most commonly used measures derived from interval differences include the standard deviationof differences between adjacent NN intervals. Calculation of standard deviation is show in aboveequation.
Fig 3 : Stock analysis based on time period
Fig 3, illustrate that when the authenticate user login to the system, he will able to see the different companies and their stock prices history, here user can select the duration such as last 1 month, last 6 month, according to that system will fetch the data and display it to user.
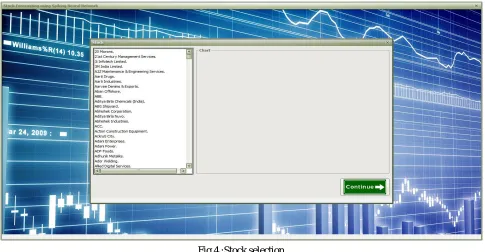
Fig 4 :Stock selection
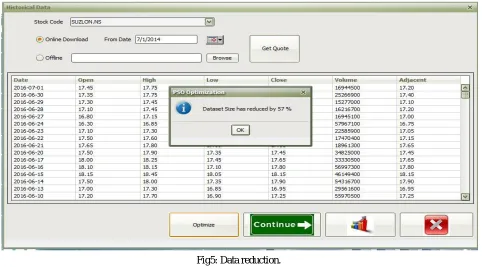
Fig5: Data reduction.
In Fig 3, we have selected “SUZLON” as a company, now in Fig 4, after selection of past duration for which I need to get quote, system will represent the data on daily basis, so each row contain open price, high price, low price, closing price for that day etc. after that I selected option “optimize” to optimize or to reduce data. Here I applied my algorithm Particle swarm optimization to the neural network (data). So we will get result, in this particular example, I have get result, data reduction by 57%.
Fig 6, indicates the predicition of stock data using default mode. This will take 780 ms to analyze the data. These chart contains the two lines red line indicates the prediction of the stock and red line indicates actual price.
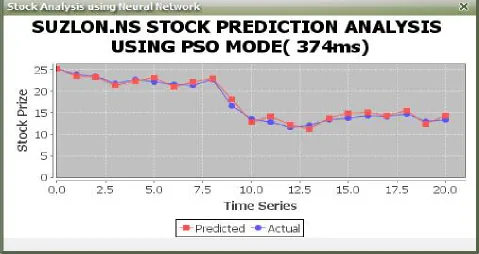
Fig 7 :Prediction with using PSO (Time difference).
Fig 7, contains information after applying particle swarm optimization algorithm to data. In fig 6 and fig 7 we can see the time differnce,without using PSO it is taking 780 ms and with using PSO it is taking 374ms which will reduce the time by 406ms. This indicates that PSO reduces the data and hence time required to calculate the analysis is also minimized. We can also see that after reduction also the result or data remains same.
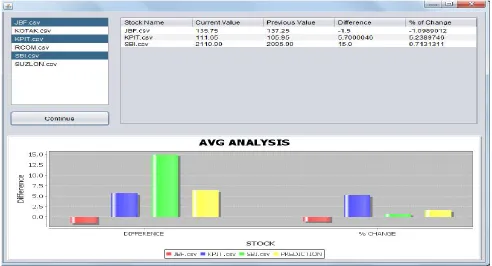
Fig 8: Mutual fund result analysis.
Fig 8, shows the analysis of data for multiple of companies, here I have combined three companies so AVG Analysis graph shows that the difference between each stock price and also last yellow bar is showing the average differnce between 3 companies. Same for the percentage of change.
VII. CONCLUSION
My present working is based on the optimizing the data that is feed to the prediction system and that will help people in analyzing the market condition. Challenging task is the amount of data daily feed into system is tremendous, and the share of different companies changes continuously so it need to be real time and the data must be updated according to time. There are different types of attribute which vary according to industry type so that parameter also need to be taken into consideration. The multi-objective PSO-based feature selection approach to better explore the Pareto front of non-dominated solutions in feature selection problems. To investigate the use of B-positive multi-objective PSO for feature selection and compare its performance with that of continuous multi-objective PSO.
ACKNOWLEDGEMENT
Thanks to all those who helped me in completion of this work knowingly and unknowingly, all those who directly or indirectly the researchers, my lectures and friends.
REFERENCES
1. Ping-Feng Pai, Tai-Chi Chen, "Rough set theory with discriminant analysis in analyzing electricity loads", Expert Systems with Applications 36 (2009), pp.8799–8806
2. Simon Fong, Raymond Wong, and Athanasios V. Vasilakos, Accelerated PSO Swarm Search Feature Selection for Data Stream Mining Big Data IEEE TRANSACTIONS ON JOURNAL NAME, MANUSCRIPT ID
3. S. Ray, R.H. Turi, Determination of Number of Clusters in K-Means Clustering and Application in Color Image Segmentation, Proceedings of the 4th International Conference on Advances in Pattern Recognition and Digital Techniques (ICAPRDT'99), Calcutta, India, 137-143, 1999. 4. Hart, P. E., Nilsson, N. J., & Raphael, B., 1968. A Formal Basis For The Heuristic Determination OfMinimum Cost Paths. SystemsScience and
5. Hereford, J. M. (2006). A distributed particle swarm optimization algorithm for swarm robotic applications. Paper presented at the Evolutionary Computation, 2006. CEC 2006. IEEE Congress on.
6. Eberhart, R., & Kennedy, J. (1995). A new Optimizer using particle swarm theory. Paper presented at the Micro Machine and Human Science, 1995. MHS'95., Proceedings of the Sixth International Symposium on.
7. S. Ray, R.H. Turi, Determinati on of Number of Clusters in K-Means Clustering and Application in Color Image Segmentation, Proceedings of the 4th International Conference on Advances in Pattern Recognition and Digital Techniques (ICAPRDT'99), Calcutta, India, 137-143, 1999. 8. I.H. Witten, E. Frank, Data mining: practical machine learning tools and techniques with Java implementations, Morgan Kaufmann (2005),
J.SBridle, “Probabilistic Interpretation of Feedforward Classification Network Outputs, with Relationships to Statistical Pattern Recognition,” Neurocomputing—Algorithms, Architectures and Applications, F. Fogelman-Soulie and J. Herault, eds., NATO ASI Series F68, Berlin: SpringerVerlag, pp. 227-236, 1989.
9. S. Fong, X.S. Yang, S. Deb, Swarm Search for Feature Selection in Classification, The 2nd International Conference on Big Data Science and Engineering (BDSE 2013), 2013, 3-5 Dec. 2013.
10. Quinlan, J.R., C4.5: Programs for Machine Learning. Morgan Kauf-mann Publishers, 1993.
11. Arinto Murdopo, "Distributed Decision Tree Learning for Mining Big Data Streams", Master of Science Thesis, European Master in Distributed Computing, July 2013.
12. Xin-She Yang, Suash Deb, Simon Fong, Accelerated Particle Swarm Optimization and Support Vector Machine for Business Optimization and Applications, The Third International Conference on Networked Digital Technologies (NDT 2011), Springer CCIS 136, 11-13 July 2011, Macau, China, pp.53-66.