An Efficient Automatic Clustering using
Fuzzy Kernel Mapping with Density
Clustering Algorithm
M. Kanchana1, M. Mohanraj 2
M. Phil Research Scholar, Dept. of Computer Science, Dr. SNS Rajalakshmi College of Arts and Science, Coimbatore, India
Assistant Professor, Dept. of Computer Applications, Dr. SNS Rajalakshmi College of Arts and Science, Coimbatore, India
ABSTRACT: Clustering is the application of data mining techniques to discover patterns from the datasets. In this
paper presents, “Fuzzy kernel mapping with density clustering algorithm (FKMDC)” incorporates clustering concept, which is the process of deriving the information from the similarity from the unsupervised dataset. The proposed method is to establish a unified framework for FKDC on both supervised and unsupervised data sets. Also, we examine some important factors, such as the clustering quality and assortment of basic partitioning, which may affect the performances of FKDC. Experimental results on various synthetic and real world data sets demonstrate that FKDC is highly efficient and is equivalent to the state-of-the-art methods in terms of clustering index quality.
KEYWORDS: Fuzzy; Kernel mapping; density cluster; cluster quality
I. INTRODUCTION
Clustering is an important technique of exploratory data mining, which divides a set of objects (instances or patterns) into several groups (also called clusters) in such a way that objects in same group are more similar with each other in some sense than with the objects in other groups. It has been widely used in different disciplines and applications, such as machine learning, pattern recognition [2], data compression [3], image segmentation [4], [5], time series analysis [6], [7], information retrieval, spatial data analysis, and biomedical research.
Clustering is an unsupervised pattern recognition technique which automatically seeks to gather objects in "natural" groups. In addition to providing a natural classification, clustering gives an insight into the underlying structure of the data. The goal is that the objects in each cluster are similar while the different clusters are dissimilar. To do this we need to define a proximity measure that quantifies what we mean by these terms. A proximity measure is either a similarity measure or a dissimilarity measure, where a much used example of the latter is the Euclidean distance. The different ways of defining proximity is part of the reason why many different clustering procedures have been developed, ranging from simple heuristics suitable for a particular type of dataset to general iterative schemes which seeks to optimize some associated optimality criterion. Ideally one should use a clustering approach that produce good results in a wide variety of situations, since the general assumption for clustering is that we know little or nothing about the data in advance.
we need to re-calculate k new centroids as vary centers of the clusters resulting from the previous step. After we have these k new centroids, a new binding has to be done between the same data set points and the nearest new centroid.
The rest of this paper is organized as follows. In Section 2 review the existing related work. The proposed models and descriptions are described in Section 3. Finally conclude the paper in Section 4.
II. RELATED WORK
In [1] authors discussed the cluster analysis is aimed at classifying elements into categories on the basis of their similarity. Its applications range from astronomy to bioinformatics, bibliometrics, and pattern recognition. The authors proposed an approach based on the idea that cluster centers are characterized by a higher density than their neighbors and by a relatively large distance from points with higher densities. In [2] authors illustrated the clustering analysis has been applied in a wild variety of fields such as biology, medicine, economics, etc. For time series clustering, dimension reduction methods like data sampling or piecewise aggregate approximation (PAA) algorithm are often applied to reduce data dimension before clustering. Consequently, the information of subsequence may be overlooked. Nevertheless, some properties of time series with the same sampling data may result in different clustering results after considering the subsequence information. In [3] authors presented clustering is a division of data into groups of similar objects. Each group, called cluster, consists of objects that are similar between themselves and dissimilar to objects of other groups. Representing data by fewer clusters necessarily loses certain fine details (akin to lossy data compression), but achieves simplification. It represents many data objects by few clusters, and hence, it models data by its clusters. In [4] authors analyzed the issue of determining “the right number of clusters” in K-Means has attracted considerable interest, especially in the recent years. Cluster intermix appears to be a factor most affecting the clustering results. The authors proposed an experimental setting for comparison of different approaches at data generated from Gaussian clusters with the controlled parameters of between- and within-cluster spread to model cluster intermix. In [5] authors considered the problem of unsupervised clustering (vector quantization) of multidimensional numerical data. To propose a new method for determining an optimal number of clusters in the data set. The method is based on parametric modeling of the quantization error. The model parameter can be treated as the effective dimensionality of the data set. In [6] authors proposed a two-stage genetic clustering algorithm can automatically determine the proper number of clusters and the proper partition from a given data set. The two-stage selection and mutation operations are implemented to exploit the search capability of the algorithm by changing the probabilities of selection and mutation according to the consistence of the number of clusters in the population. In [7] authors proposed a new multi-objective (MO) clustering technique (GenClustMOO) is proposed which can automatically partition the data into an appropriate number of clusters. Each cluster is divided into several small hyper spherical sub-clusters and the centers of all these small sub-clusters are encoded in a string to represent the whole clustering. For assigning points to different clusters, these local sub-clusters are considered individually.
III.PROPOSED ALGORITHM
The proposed method called “Fuzzy based kernel mappings with Density clustering in high dimensional data (FKDC) ”, which takes as key measures of correspondence between pairs of data points. The proposed method is to establish a unified framework for FKDC on both supervised and unsupervised data sets.
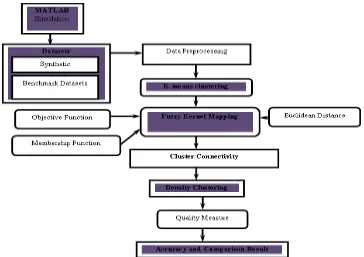
A. DATA PREPROCESSING
A “feature” or “attribute” or “variable” refers to a portion of the data points. Typically before collecting data, features are specified or preferred. Features can be discrete, continuous, or insignificant. Feature selection for high-dimensional data clustering is the task of disregarding irrelevant and redundant terms in the vectors that represent the hubs, aiming to find the smallest subset of terms that reveals “natural” clusters of hubs. To Searching for the small subset of relevant terms will speed up the clustering process, while avoiding the curse of dimensionality.
Fig 1.1: Proposed System Architecture Diagram.
B. KERNEL MAPPING DATA CLUSTERS
The Kernel mapping data clusters method is performing with Fuzzy logic clustering technique to learn the data points as cluster centroid has to the finest membership link, and typicality is used for improving the disagreeable effect of anomalies. The function is composed of two expressions.
The fuzzy clustering function and uses a Euclidean distance exponent,
The fuzzificaion weighting function exponent; but the two coefficients in the objective function are only used as exhibitor of membership link and typicality.
C. FUZZY KERNEL MAPPING CONNECTIVITY
The fuzzy kernel mapping connectivity method specified with a kernel k value that is directly applied to the similarity matrix. It is shown that the generated clusters can still be monotonic depending on the used linkage measure even though the induced dissimilarity measures are no longer ultra metrics. Using the pair-wise merged clusters; an additional shrinking process is proposed to generate topic related groups with more than two cluster elements.
The process of determining the degree to which a value belongs in a kernel set The value returned by a Neighbour cluster
Most variables in a data point-based system have multiple data points attached to them
Kernel mapping that variable involves passing the crisp value through each neighbour attached to that value
Clusters are groups of similar data elements. Resemblance coefficient represents the degree of similarity and non similarity between the items. The main aim of clustering analysis is identify and quantification of these architecture elements. Identifying the membership and location center of the clusters is main process in the cluster analysis. Some time data in the cluster is well packed. But due to the complex nature of the components the data may not be packed well in the clusters. Some of the elements lie outside the cluster region.
D. DENSITY CLUSTERING PROCESS
The Density clustering algorithm executes the information passing among data points. Each data points receive the availability from others data points (from pattern) and send the responsibility message to others data points (to pattern). Sum of responsibilities and availabilities for data points identify the cluster patterns.
The high-dimensional data point accessibilities ACC(j, k) are zero: ACC (j, k) = 0, D(j, k) is set to the input similarity between point j and point k as its pattern, minus the largest of the similarities between point j and other candidate patterns. To calculate the density cluster distance matrix that chooses a subset of the compound space which consists only compounds which have sufficient number of close neighbours. This is obtained based on the descriptor chosen in the earlier step. The similarity measures often used in calculation of similarity between chemical compounds are Euclidean measures. The similarity measure chosen is the Euclidean distance, which is based on the triangle inequality.
IV.PERFORMANCE EVALUATION
The research work performed the experiments on three kinds of datasets namely (i) Lung cancer; (ii) Breast Cancer Wisconsin Diagnostic (WBC); and (ii) UCI benchmark datasets: Iris, 20 News groups and Shape sets. The clustering quality in these experiments was measured by quality indices, the Rand index [23], which measures a percentage of k-neighbor points that are clustered together. In the first experimental setup, the UCI machine learning data set (https://archive.ics.uci.edu/ml/datasets.html) was used for evaluation. Each part consists of 569 instances having 32 dimensions. Results were compared for various predefined numbers of clusters in algorithm calls.
The Rand index [23] or Rand measure in statistics, and in particular in data clustering, is a measure of the similarity between two data clustering's. A form of the Rand index may be defined that is adjusted for the chance grouping of elements; this is the adjusted Rand index.
= = (1)
best overall cluster quality on this data set. Only one quality estimate is given for FKMDC, as it automatically determines the number of clusters on its own.
Dataset RLClu STClu FKMDC
Lung Cancer 0.0556 0.8673 0.8698
WDBC 0.5065 0.4296 0.5563
Iris 0.7352 0.7338 0.7451 20
Newsgroups
0.5347 0.5596 0.5955
V. CONCLUSION AND FUTURE WORK
In this paper presents proposed the Fuzzy kernel mapping with density clustering algorithm (FKMDC) algorithm for the soft clustering algorithm is in core variations of fuzzy based Neighboring clustering algorithm using different weight measures applied to the vector of base-level clustering’s baseline on both synthetic and real-world data, as well as in the presence of high levels of artificially introduced noise. This initial evaluation suggests that using data points both as cluster prototypes and points guiding the centroid-based search is a promising new idea in clustering unsupervised data. Also, global data point estimates are generally to be preferred with respect to the local ones. The kernel map with neighbor clustering can easily be extended to incorporate additional pair-wise constrains such as requiring points with the same label to come into view in the same cluster with just an extra layer of function hubs. To apply to the real data sets we need to refine the adjacency matrix by the hard-thresholding, say, and this area is worth pursuing as future research.
REFERENCES
1. A. Rodriguez and A. Laio, “Clustering by fast search and find of density peaks,” Science, vol. 344, no. 6191, pp. 1492–1496, 2014.
2. C.-P. Lai, P.-C. Chung, and V. S. Tseng, “A novel two-level clustering method for time series data analysis,” Expert Systems with Applications, vol. 37, no. 9, pp. 6319–6326, 2010.
3. P. Rai and S. Singh, “A survey of clustering techniques,” International Journal of Computer Applications, vol. 7, no. 12, pp. 156–162, 2010.
4. M. M.-T. Chiang and B. Mirkin, “Intelligent choice of the number of clusters in k-means clustering: an experimental study with different cluster spreads,” Journal of classification, vol. 27, no. 1, pp. 3–40, 2010.
5. A. Kolesnikov, E. Trichina, and T. Kauranne, “Estimating the number of clusters in a numerical data set via quantization error modeling,” Pattern Recognition, vol. 48, no. 3, pp. 941–952, 2015.
6. H. He and Y. Tan, “A two-stage genetic algorithm for automatic clustering,” Neuro-computing, vol. 81, no. 1, pp. 49–59, 2012.
7. S. Saha and S. Bandyopadhyay, “A generalized automatic clustering algorithm in a multi-objective framework,” Applied Soft Computing, vol. 13, no. 1, pp. 89– 108, 2013.
0 0.2 0.4 0.6 0.8 1
RLClu STClu FKMDC
R
an
d
I
n
d
e
x
Algorithms
Clustering Quality on the UCI machine learning datasets Lung Cancer
WDBC Iris