Power Price Forecasting In the Smart Grid
Using Differential Evolution Based SVM
Classifier
Ramya Devi. C1, Amudha. L 2
P.G. Student, Department of Computer Science and Engineering, K.Ramakrishnan College of Engineering,
Samayapuram, Trichy, Tamilnadu, India1
Assistant Professor, Department of Computer Science and Engineering, K.Ramakrishnan College of Engineering,
Samayapuram, Trichy, Tamilnadu, India2
ABSTRACT: Power price forecasting is a significant part of smart grid because it makes smart grid cost efficient.The
existing methods for price forecasting may be difficult to handle with huge price data in the grid since the redundancy from feature selection cannot be averted. To solve such a problem, a novel electricity price forecasting model is Hybrid feature Selection, Feature Extraction and Classification (HSEC) are integrated into a single framework design. In this novel model, first, a Grey Correlation Analysis (GCA) based Hybrid Feature Selector (HFS), combining Relief-F algorithm and Random Forest (RF) is designed to calculate the feature importance and control the feature selection. For feature extraction, Kernel Principle Component analysis is used to further reduce the redundancy among the selected features. Finally, design a differential evolution (DE) based Support Vector Machine (SVM) classifier for to forecast the price accurately.
KEYWORDS: Price forecasting; Feature Selection; Classification; Smart grid
I. INTRODUCTION
One of the main goals of smart grid is to reduce power peak load and to balance the gap between power supply and demand [1]. Customers are able to partake in the operations of smart grid, where the energy cost can be reduced by energy preservation and load shifting. In this case, dynamic pricing is a key indicator of users’ switching load [1].Generally, accurate point price forecasting is expected because of the requirement of economy and industry [2].As for customers, they are actually eager to know whether the electricity price exceeds the specific customer-defined thresholds, which they used to decide to turn the load on or off. Under this circumstance, customers require the electricity price classification. Hence, some specific thresholds based on point price forecasting algorithms are used to classify the electricity price. Function approximation techniques are the fundamental of point price forecasting algorithms, in which the basic process of price formation is imitated by a price model [3]. Moreover, price classification requires lower accuracy. Thus, electricity price classification becomes a key priority in the price forecasting.
II. RELATED WORK
ARIMA, a neural network (NN), a compound classifier and a k-nearest neighbor model (k-NN) to separately implement normal price and price spikes forecasting processes. In [6] authors WT deals with non-stationary by decomposing the price series into less volatile components. The ARIMA model captures cyclicality of the series clearly exhibiting hourly and weekly patterns.
III.PROPOSED ALGORITHM
To enhance the accuracy of the proposed framework, first develop a parallelized hybrid feature selector (HFS), a Kernel Principal component analysis (KPCA) and a Differential Evolution based Support vector Machine (SVM). HFS based on Grey Correlation Analysis combining Random Forest (RF) and Relief-F algorithm. These two algorithms are used to calculate the feature importance and control the feature selection. Then KPCA is applied to perform the non linear dimension reduction. KPCA will be performed in the selected features for further removal of redundant features.Finally, the selected features is sent to build SVM. The support vector is a classifier that tries to find a hyper plane which can divide data into the correct classes .Since SVM is controlled by several super parameters(cost penalty, insensitive loss function parameter and kernel parameter) so that DE algorithm is used to tune the super parameters. SVM is an underpinned framework that can predict the price efficiently.
Power Price Forecasting has modules are • Hybrid Feature Selection • Hybrid Feature Extraction • Clustering
• Classification • Predicted Data
A. Hybrid Feature Selection
Feature selection is performed based on GCA algorithm. It is kind of preprocessing of a dataset value. That will remove noisy inconsistent data. Thus GCA can provide a quantitative measure of the closeness between the electricity prices.
B. Hybrid Feature Extraction
The features selected by HFS can be considered that have no irrelevant features, but also have redundant features. Kernel Principle Component Analysis (KPCA) for feature extraction ,which reduce the redundancy among features.
C. Clustering
Clustering is the grouping of a particular set of objects based on their characteristics, aggregating them according to their similarities.
D. Classification
Support Vector Machine (SVM) underpinned framework that can predict the price efficiently.SVM is a classifier which can divide features into the correct classes. The four main procedures run repeatedly until the optimal parameters are obtained.
1. Initialization
This stage forms the first population randomly. We make the first population obey the uniform distribution.
2.Mutation
The target of mutation operation is to generate new individuals.
3. Crossing
4.Selection
The selection operation selects the individuals that make SVM more accurate.
E. Predicted Data
In this module, can get our predicted data by performing above methodologies from huge amount of dataset.
IV.PSEUDOCODE
Input: WR[Tk] 0:0;WF [Tk] 0:0;A[];R[n]
Output: WR[Tk];WF [Tk]
1 begin
2 initialization: set all weight
WR[Tk] <- WF[Tk] <- 0:0, read data from A[]
3 Evaluator &:
4 begin
5 for k from 1 to m do
6 for i from 1 to n do
7 calculate errOBB1i using corresponding OBB data set of decision tree[i]
8 randomly add noise to all OBB data on feature Tk
9 calculate errOBB2i using corresponding OBB data set of decision tree[i]
10 end
11 calculate the importance of feature WR[Tk] <- (errOBB2i errOBB1i)/n
12 end 13 end
14 Evaluator _ :
15 begin
16 for k from 1 to m do
17 select an item in class (Ci) by random
18 find k nearest hits item Hj(Ci)
19 for each class (Cj) != class(Ci)
20 find k nearest miss item Mj(Cj)
21 end
22 for i from 1 to m do
23 update WF [Ti]
24 end 25 end
26 Selector:
27 begin
28 normalize WR,WF
29 perform feature selection
30 end 31 end
V. SYSTEMARCHITECTURE
FIG 1.SYSTEM ARCHITECTURE
VI.RESULTANDOUTCOME
The result describes forecasting the all the price and predict the final price.FIG 2 describes the dataset selection. The electricity data set can be selected and it is stored in to the database.
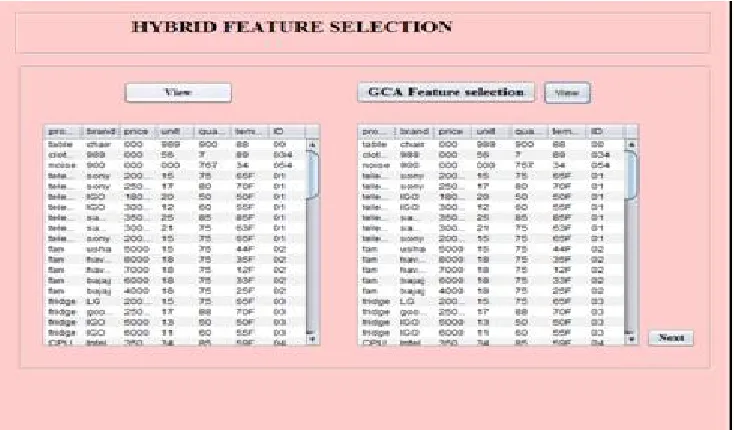
FIG 3 describes the hybrid feature selection. The features are to be selected from the dataset. Grey correlation analysis (GCA) is used to select the features and remove the redundancy among the features.
FIG 3: HYBRID FEATURE SELECTION
FIG 4 describes hybrid feature extraction.The features selected by hybrid feature selector can be considered that have no irrelevant features, but also have redundant features. In power price forecasting data requires non-linear mapping to find an appropriate low dimensional value. Kernel Principle Component Analysis (KPCA) uses kernel function to deal with high dimensional and low dimensional data.
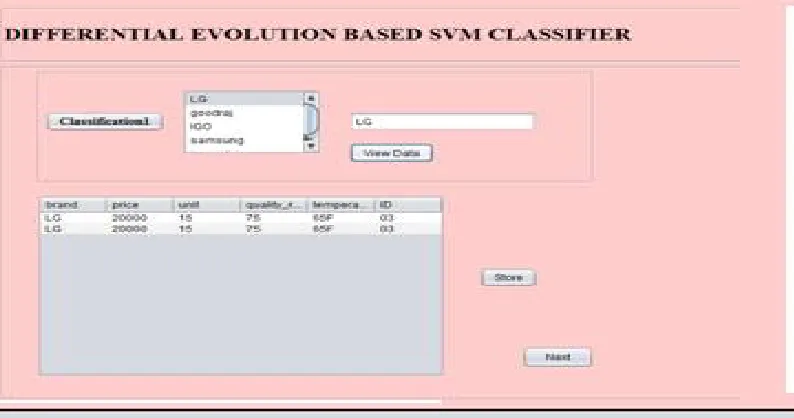
FIG 5 describesthe classification, which can done on the extracted features for accurate price forecasting.
FIG 5: CLASSIFICATION
FIG 6 describes the predicted data.The predicted power price is showed from the classification results.
VII. CONCLUSION AND FUTURE WORK
An electricity price forecasting framework, which consists of two-stage feature processing and improved SVM classifier. The end result produces the predicted electricity price. For future work, location based dataset is used. This method using the extracted model instances to find the most two similar regions between two cities by Spatial Distribution.The result will show that the regions are both more consistent with the data in terms of predictive performance.
REFERENCES
1. Abedinia. O., Amjady. N., and Zareipour. H., A new feature selection technique for load and price forecast of electrical power systems, IEEE Transactions on Power Systems, DOI: 10.1109/TP-WRS.2016.2556620, 2016.
2. Alsheikh, M.A., Niyato. D., Lin S., Tan. H.P., and Han. Z., Mobile big data analytics using deep learning and Apache Spark, IEEE Network, Vol. 30, No. 3, May.-Jun. pp. 22-29, 2016.
3. Erol-Kantarci. M., and Mouftah. H.T., Energy-efficient information and communication infrastructures in the smart grid: a survey on interactions and open issues, IEEE Communications Surveys and Tutorials, Vol. 17, No. 1, pp. 179-197, 2015.
4. Li. J., Ding. L., and Ying X., Differential evolution based parameters selection for support vector machine, IEEE International Conference on Computational Intelligence and Security, pp. 284-288, 2013.
5. Qiu. Z W., Multivariable mutual information based feature selection for electricity price forecasting, in Proceedings of International Conference on Machine Learning and Cybernetics, pp. 168-173, 2012.
6. Shiri A., Afshar. M., Rahimi-Kian A., and Maham. B., Electricity price forecasting using Support Vector Machines by considering oil and natural gas price impacts, IEEE International Conference on Smart Energy Grid Engineering (SEGE), pp.1-5, 2015.
7. Wang K., Li H., Feng Y., and Tian G., Big data analytics for system stability evaluation strategy in the energy internet, IEEE Transactions on Industrial Informatics, Vol. PP, No. 99, pp.1-1, 2017.
8. Wang K., Zomaya A., Xu C., Zhang Y., Robust Big Data Analytics for Electricity Price Forecasting in the Smart Gri, 2017.