University of Windsor University of Windsor
Scholarship at UWindsor
Scholarship at UWindsor
Electronic Theses and Dissertations Theses, Dissertations, and Major Papers
2-3-2016
Developing a Consumer Oriented Metric for Measuring Corrosion
Developing a Consumer Oriented Metric for Measuring Corrosion
on Vehicles.
on Vehicles.
Dehua Hu
University of Windsor
Follow this and additional works at: https://scholar.uwindsor.ca/etd
Recommended Citation Recommended Citation
Hu, Dehua, "Developing a Consumer Oriented Metric for Measuring Corrosion on Vehicles." (2016). Electronic Theses and Dissertations. 5643.
https://scholar.uwindsor.ca/etd/5643
This online database contains the full-text of PhD dissertations and Masters’ theses of University of Windsor students from 1954 forward. These documents are made available for personal study and research purposes only, in accordance with the Canadian Copyright Act and the Creative Commons license—CC BY-NC-ND (Attribution, Non-Commercial, No Derivative Works). Under this license, works must always be attributed to the copyright holder (original author), cannot be used for any commercial purposes, and may not be altered. Any other use would require the permission of the copyright holder. Students may inquire about withdrawing their dissertation and/or thesis from this database. For additional inquiries, please contact the repository administrator via email
Developing a Consumer Oriented Metric for
Measuring Corrosion on Vehicles
by
Dehua Hu
A Thesis
Submitted to the Faculty of Graduate Studies
through the Department of Civil and Environmental Engineering
in Partial Fulfillment of the Requirements for
the Degree of Master of Applied Science
at the University of Windsor
Windsor, Ontario, Canada
2016
Developing a Consumer Oriented Metric for
Measuring Corrosion on Vehicles
by
Dehua Hu
APPROVED BY:
______________________________________
Daniel Green, PhD, PEng
Department of Mechanical, Automotive, and Materials Engineering
______________________________________
Nihar Biswas, PhD, PEng
Department of Civil and Environmental Engineering
________________________________________
Edwin Tam, PhD, Peng, Advisor
Department of Civil and Environmental Engineering
DECLARATION OF ORIGINALITY
I hereby certify that I am the sole author of this thesis and that no part of this
thesis has been published or submitted for publication.
I certify that, to the best of my knowledge, my thesis does not infringe upon
anyone’s copyright nor violate any proprietary rights and that any ideas, techniques,
quotations, or any other material from the work of other people included in my
thesis, published or otherwise, are fully acknowledged in accordance with the
standard referencing practices. Furthermore, to the extent that I have included
copyrighted material that surpasses the bounds of fair dealing within the meaning of
the Canada Copyright Act, I certify that I have obtained a written permission from
the copyright owner(s) to include such material(s) in my thesis and have included
copies of such copyright clearances to my appendix.
I declare that this is a true copy of my thesis, including any final revisions,
as approved by my thesis committee and the Graduate Studies office, and that this
thesis has not been submitted for a higher degree to any other University or
ABSTRACT
New technologies and materials are utilized by the automobile manufacturers to
prevent and treat corrosion on vehicles. Vehicle owners can choose a variety of
after-market anti-rust products to protect their vehicles from corrosion, such as spray-on
rust inhibitor and anti-rust coating. A metric for measuring the corrosion on vehicle
is required to effectively benchmark the extent of corrosion, as well as the
effectiveness corrosion treatment products. This research develops a metric to
measure the corrosion on vehicles and model the corrosion condition against
ACKNOWLEDGEMENTS
Firstly, I would like to express my sincere gratitude to my advisor Prof. E. Tam
for his continuous support of my Mater’s study and related research, for his patience,
motivation, and immense knowledge. His guidance helped me in the research and
writing of this thesis. I could not have imagined having a better advisor and mentor
for my Master study.
Beside my advisor, I would like to thank Dr. S. Sawyer-Beaulieu. She taught
me how to undertake data analysis and helped me during the field sampling. As a
non-native English speaker, I made a lot of mistakes in thesis writing. Dr. Susan
reviewed and corrected my thesis word by word. I cannot imagine what my thesis
would have been without her help.
I would also like to thank G. Bertotti. She provided significant assistance for
the initial stage of my research and helped lay a solid foundation for the research. I
wish everything goes well for her in Brazil.
I would like to thank the rest of my thesis committee - Prof. N. Biswas and Prof.
D. Green - for their insightful comments and encouragement, and also for their
questions which incentivized me to widen my research perspective.
My sincere, heartfelt thanks also goes to Craig Shuttleworth, John Eckmire, and
all technicians and managers from Krown Corporation, OK Santing, A&L, and
Standard AutoWreckers. Their support, commitment, and cooperation made this
TABLE OF CONTENTS
DECLARATION OF ORIGINALITY ... iii
ABSTRACT ... iv
ACKNOWLEDGEMENTS ... v
LIST OF TABLES ... viii
LIST OF FIGURES ... xi
LIST OF APPENDICES ... xiv
LIST OF ABBREVIATIONS/SYMBOLS ... xv
1. Introduction ... 1
2. Literature Review ... 3
2.1. Corrosion Occurrence and Prevention ... 3
2.2. Corrosion Prevention and Treatment ... 4
2.3. Documenting and Assessing Corrosion ... 5
2.4. Types of Corrosion ... 11
3. Methodology ... 15
3.1. Sampling and Analysis ... 15
3.2 Measuring the Corrosion on Vehicles... 20
3.3 Regression Analysis ... 21
4. Findings ... 22
4.1 First Stage Sampling ... 22
4.2 Second Stage Sampling... 25
4.4 Data Analysis ... 32
4.5 Linear Regression Analysis ... 49
4.6 Corrosion Levels ... 72
5. Conclusions and Recommendations ... 85
REFERENCES ... 91
APPENDICES ... 94
Appendix A - Corrosion evaluation questionnaire ... 95
LIST OF TABLES
Table 1- Comparison of rusted area on cross member of two vehicles. ... 23
Table 2 - Vehicle classes from third round sampling. ... 31
Table 3 - Vehicles with corrosion on their brake/fuel lines. ... 49
Table 4 - Regression statistics for treated vehicles (16 - 15 years old) Corrosion Index. ... 52
Table 5 - ANOVA test result for treated vehicles (16 - 15 years old) Corrosion Index 1. ... 52
Table 6 - ANOVA test result for treated vehicles (16 - 15 years old) Corrosion Index 2. ... 52
Table 7 - Regression statistics for treated vehicle (with 5+ treatments). ... 56
Table 8 - ANOVA test result 1 for treated vehicles (with 5+ treatments). ... 56
Table 9 - ANOVA test result 2 for treated vehicles (with 5+ treatments). ... 56
Table 10 - Regression Statistics for untreated vehicles from Standard and A&L (6 – 15 years old) Corrosion Index. ... 58
Table 11 - ANOVA test result 1 for untreated vehicles from Standard and A&L (6 – 15 years old) Corrosion Index. ... 58
Table 13 - Regression statistics for treated vehicle underbody Corrosion Index.
... 62
Table 14 - ANOVA test result 1 for treated vehicle underbody Corrosion Index. ... 62
Table 15 - ANOVA test result 2 for treated vehicle underbody Corrosion Index. ... 62
Table 16 - Regression statistics for untreated vehicle underbody Corrosion Index. ... 64
Table 17 - Table 19 – ANOVA test result 1 for untreated vehicle underbody Corrosion Index. ... 64
Table 18 - ANOVA test result 2 for untreated vehicle underbody Corrosion Index. ... 65
Table 19 - Regression statistics for mileage & vehicle age test. ... 67
Table 20 - ANOVA test result 1 for mileage & vehicle age test... 67
Table 21 - ANOVA test result 2 for mileage & vehicle age test... 67
Table 22 - Regression Statistics for amount number of treatments & vehicle age test. ... 68
Table 23 - ANOVA test result 1 for amount number of treatments & vehicle age test. ... 68
Table 25 - Regression analysis conclusion. ... 70
Table 26 - Corrosion level classification for body panels. ... 75
Table 27 - Vehicle age and mean body corrosion level for treated vehicles.... 78
Table 28 - Vehicle age and mean body corrosion level for untreated vehicles.
... 79
Table 29 - Corrosion level classification for underbody parts. ... 81
Table 30 - Vehicle age and mean underbody corrosion level for treated vehicles.
... 81
Table 31 - Vehicle age and mean underbody corrosion level for untreated
LIST OF FIGURES
Figure 1 - Holes drilled on the door seam during the Krown treatment process.
... 17
Figure 2 - Example of exterior body panel where sampling was conducted. .. 19
Figure 3 - Example of under the hood where sampling was conducted... 19
Figure 4 - Example of under body where sampling was conducted. ... 19
Figure 5 - Treated 2009 Ford F150 Cross member. ... 23
Figure 6 - Untreated 2011 GMC Sierra Cross member. ... 23
Figure 7 - Color analysis test on the control arm. ... 24
Figure 8 - Count of each car type. ... 26
Figure 9 - Count of vehicle brand. ... 26
Figure 10 - Ford and Dodge body panels corrosion index. ... 27
Figure 11 - Ford and Dodge underbody parts corrosion index. ... 28
Figure 12 - Ford body panels corrosion index. ... 28
Figure 13 - Ford underbody parts corrosion index. ... 29
Figure 14 - Dodge body panels corrosion index. ... 29
Figure 15 - Dodge underbody parts corrosion index. ... 30
Figure 16 - Amount of sampled vehicles from 3 locations. ... 33
Figure 18 - Count of vehicle model year ... 34
Figure 19- Overall Corrosion Index vs. vehicle age (linear fit) ... 35
Figure 20 - Overall Corrosion Index vs. vehicles age (polynomial fit) ... 36
Figure 21 - Corrosion Index vs. vehicle age for body panels ... 37
Figure 22 - Corrosion Index vs. vehicle age for underbody parts. ... 38
Figure 23 - Corrosion trend for perforation. ... 39
Figure 24 - Corrosion trend for blistering. ... 39
Figure 25 - Corrosion trend for surface rust. ... 40
Figure 26 - Untreated Corrosion Index from 3 sampling locations. ... 41
Figure 27 - Untreated Corrosion Index from 3 Sampling Locations (Underbody Parts). ... 42
Figure 28 - Krown Treated vs. Standard, A&L Untreated (Body Panel) ... 43
Figure 29 - Corrosion Index for hood. ... 44
Figure 30 - Corrosion Index for fenders. ... 44
Figure 31 - Corrosion Index for doors. ... 45
Figure 32 - Corrosion Index for quarter panels ... 45
Figure 33 - Corrosion Index for rocker panels. ... 46
Figure 34 - Corrosion Index for cross members. ... 47
Figure 36 - Corrosion Index for fuel/brake lines. ... 48
Figure 37 - Treated vehicles (6 - 15 years old) corrosion line fit plot. ... 51
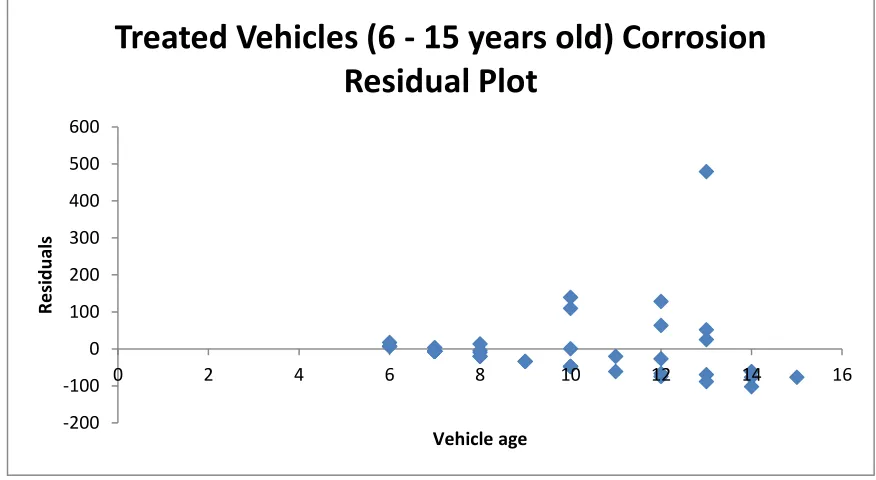
Figure 38 - Treated vehicles (6 - 15 years old) corrosion residual plot. ... 51
Figure 39 - Treated vehicle (with 5+ treatments) corrosion line fit plot. ... 55
Figure 40 - Treated vehicle (with 5+ treatments) corrosion residual plot. ... 55
Figure 41 - Untreated vehicles from Standard and A&L (6 - 15 years old) corrosion line fit plot. ... 57
Figure 42 - Untreated vehicles from Standard and A&L (6 - 15 years old) residual plot. ... 58
Figure 43 - Treated vehicle underbody corrosion line fit plot. ... 61
Figure 44 - Treated vehicle underbody corrosion residual plot. ... 61
Figure 45 - Untreated vehicle underbody corrosion line fit plot. ... 63
Figure 46 - Untreated vehicle underbody corrosion residual plot. ... 64
Figure 47 - Level 2, corrosion index=8.7 cm2 ... 75
Figure 48 - Level 4, corrosion index=12.8cm2 on the hood. ... 76
Figure 49 - Level 4, corrosion index=53.9 cm2 on the doors. ... 76
Figure 50 - Level 4, corrosion index=241.3 cm2on the quarter panels. ... 77
Figure 51 - Level 5, a perforation area of 32.6cm2. ... 77
Figure 52 – Body panel corrosion level. ... 80
LIST OF APPENDICES
LIST OF ABBREVIATIONS/SYMBOLS
SAE ...Society of Automotive Engineers
NACE ...National Association of Corrosion Engineers
EIS ...Electrochemical impedance spectroscopy
ADI ...AnalyzingDigitalImages
SVM ...Support vector machine
k-NN ...k-nearest neighbor
MLP ...Multiplayer perceptrons
RBF ...Radial basis function
ACAP ...Automotive corrosion and prevention
CPAC ...Corrosion prevention and control
DoD ...Department of Defense
A&L ...A&L Auto Recycler
Standard ...Standard Auto Wrecker
Wp ...Weighting scale of perforation
Wb ...Weighting scale of blistering
1.
Introduction
Corrosion is a major concern for vehicles, especially in the regions of southern Canada
and northern United States because of the high humidity and the use of deicing chemicals
which accelerate the process of corrosion dramatically. A 2001 report prepared for the
Federal Highway Administration (Koch et. al. 2001) shows that the cost of corrosion in
transportation is $29.7 billion, and 79% ($23.4 billion) contributed by the corrosion of
motor vehicles. Corrosion increases the cost of maintenance and manufacturing, and a
rusted vehicle could lead to different risks such as: depreciation in value, reduced
reliability, safety issues, increased premature repair, and the loss of recoverable and
recyclable materials (Shi et al., 2013).
Before the late 1950s, corrosion concerns related to motor vehicles were limited to
marine areas, but due to the increasing usage of deicing chemicals, corrosion has become
more severe around the snowbelt regions in North America (Johnson 2001). After the
1970s, vehicle manufacturers improved their manufacturing process to increase the
corrosion resistance of their vehicles. There are also a number of aftermarket corrosion
prevention and treatment products and applications available now to vehicle owners and
operators. Now, a vehicle may have less rust than before, but evaluating the effectiveness
of an anti-corrosion process, or assessing the degree of corrosion on a vehicle remains an
industry-wide challenge. Moreover, there appears to be no single method for evaluating
corrosion at the consumer/aftermarket level that has been adopted industry wide.
The objective of this research is to develop a metric for assessing the extent of corrosion
serve as a benchmark for comparing the corrosion condition of different vehicles. Such a
metric can also be used to evaluate the effectiveness of corrosion prevention and treatment
2.
Literature Review
2.1.Corrosion Occurrence and Prevention
Shreir (2010) defines corrosion as: “the undesirable deterioration of a metal or alloy,
that is, an interaction of the metal with its environment that adversely affects those
properties of the metal that are to be preserved”. The rusting process can be accelerated
significantly under certain conditions, such as high humidity and contact with certain
chemicals. In snowbelt areas, deicers (e.g., salt) are commonly used in winter. On the
vehicle surface, salt absorbs humidity and becomes a salt-bridge between metal and air.
The process of rusting occurs more easily in salt water. Different deicers could have
different impacts on vehicles (Shi et al., 2013).
Several experiments have been conducted by Xi and Xie (2002) to measure the
corrosion rate of metal under different deicing-chemicals. They conducted two different
types of tests: 1) the SAE (Society of Automotive Engineers) test; and 2) the NACE
(National Association of Corrosion Engineers) test. They tested the corrosion rate with two
commonly used deicing-chemicals: NaCl and MgCl2.
The SAE test is a cyclic test that places a metal specimen in an enclosed chamber and
exposes it to an in-service simulated changing environment, including humidity (humid
stage), salt-application and evaporation (dry stage). The NACE test consists of applying a
chemical deicer solution onto the surface of a coupon. The coupon is cyclically immersed
into the chemical deicer solution with 10 minutes exposure in the solution, followed by 50
minutes exposure in the air. The two experiments resulted in two conflicting conclusions.
NACE test showed that the metal is more likely to rust in a NaCl solution. After comparing
the two different methods, the researchers considered the SAE method could be a more
realistic test method as it simulates the in-service environment of a vehicle, especially for
high humidity areas. The reason the MgCl2 tended to have more impact could be because
its solution viscosity is higher than that of NaCl so it is more likely to remain on the metal
surface and precipitate out as the surface dries. Also MgCl2 has a higher crystallization
potential and stronger hydrophilicity, so it can adhere to a surface for a longer period and
likely be re-dissolved under suitably wet conditions. This provides perfect conditions for
corrosion: electrolyte, oxygen, and water (Xi and Xie 2002). There are of course a variety
of other conditions under which corrosion can occur, but the presence of deicing chemicals
in adverse weather represents one of the harsher scenarios for vehicles.
2.2.Corrosion Prevention and Treatment
There are several popular products on the market used for corrosion protection. Shi et
al. (2013) evaluated the performance of 14 different rust-proofing products on the market,
including four coating products, four spray-on inhibitors and six salt removers, and all
products were separated into 3 groups by types. A screen test was conducted first using the
electrochemical impedance spectroscopy (EIS) method. This test indicated that the
following products Rust Bullet, Lubra-Seal, Krown, Rust Oleum, HoldTight and ChlorRid
exhibited good anti-corrosion properties. Then these six products were immersed into a 3%
MgCl2 solution for two weeks continuously. The results indicated that a durable protection
layer formed on the surface of the coupons by using Rust Bullet, Krown, HoldTight and
ChloRid. The HoldTight was selected for the wet-dry test as it was the best performing
solution for 40 minutes and they were dried in the air for 22 hours. After a 30-second power
washing with soapy water and HoldTight solution, they were immersed again into the
solution. A total of 8 cycles was performed during the third round of tests. The results
showed that all four products have significant impacts on protecting carbon steel substrates
from corrosion against the MgCl2 solution. However, power-washing with the salt remover,
HoldTight, didn't show a significant benefit for the aluminum alloy substrate, and once the
corrosion has occurred, the power-wash could do nothing to stop the corrosion (Shi et al.,
2013).
An environmental exposure test was performed by the Southwest Research Institute.
The Krown spray-on corrosion inhibitor, performed best to decrease the dry-wet exposure
cycle, which is the period when the most severe corrosion usually happens. The periodic
use of the Krown spray-on corrosion inhibitor and the one-time application of the Rust
Bullet protective coating are both proving effective for corrosion protection, potentially
reducing the corrosion rate by as much as 99%. But how long the coatings could last is
unknown and would need to be further investigated (Shi et al., 2013).
2.3.Documenting and Assessing Corrosion
The common method for evaluating the corrosion of vehicles is by visual observation.
A technician inspects the car and informs the customer which part is rusted and what kind
of problems could arise. This method, however, may not be reliable due to: 1) the lack of
measurement and performance standards; 2) questionable accuracy and effectiveness,
which depend on the technician's experience; and 3) the variability of results as a
consequence of different environmental conditions like illumination (Yamana et al., 2005).
method to detect the corrosion and evaluate its extent should be developed in order to
provide vehicle owners an objective assessment of the corroded condition of their vehicle.
There are various materials testing approaches for assessing corrosion. Bardal and
Drugli (2004) evaluated several corrosion detection methods including visual inspection,
radiography, ultrasonic (manual/auto), and Eddy current. Radiography uses short wave
electromagnetic beams generated from radioactive isotopes to detect the thickness of the
material (Bardal et. al., 2004). The ultrasonic method is similar to the radiography method
but using ultrasonic wave instead of electromagnetic beams. The Eddy current method is
based on the measurement of impedance, or the apparent opposition to the flow of an
electrical alternating current. The change of impedance causes a measurable electrical
signal which is proportional to the distance of the measurement object (the object whose
movement, position, dimension or temperature is to be measured) to the sensor
(Micro-Epsilon, 2015). Bardal and Drugli (2004) showed that radiography is suitable both for
accessible surfaces and non-accessible areas.
Visual inspection is suitable for accessible surfaces but can do nothing for interior
areas. The ultrasonic and eddy current methods could be helpful for the inspection of
non-accessible areas, but are not applicable for the non-accessible surfaces. However, given the
practical constraints on how to assess consumer vehicles on an efficient and cost effective
basis – and the fact that corrosion is often first detected by sight by the owner or an
automotive technician – a method based on visual inspection likely offers the most
advantages.
There is also a possibility that a higher degree of rust may not extend over a significant
surface roughness. Data representing these parameters is required in order to determine
whether they are suitable indicators or not. Presently, three alternative methods are
considered to be valuable for measuring the corrosion on vehicles: 1) thickness analysis
process; 2) surface-roughness analysis process; and 3) digital image analysis process.
1) Thickness analysis process
This method focuses on the amount of metal lost due to corrosion. An eddy current
instrument has already been utilized for detecting the rust on aircraft (Olympus,
2015). Because corrosion products are not electrically conductive, the thickness
could be measured by this test. But in some cases, rust may also expand the metal
and form into several thin layers, affecting the accuracy of the thickness gauge. This
method is suitable for detecting whether there is rust or cracks on vehicles, but due
to the size of its probe, it is not suitable for measuring the total amount of rust on
vehicles.
2) Surface-roughness method
Several tests will be required to assess if the surface-roughness method is a reliable
method for corrosion assessment before it is utilized for this project. In order to
measure the surface roughness of a vehicle part (mainly the bottom of the vehicle),
a suitable surface roughness tester is needed which will meet the following
requirements:
1) It should be portable - a small tester is preferred.
2) A non-contact, areal-type tester is preferred to avoid actual physical contact
dust, mud or grease on it, which may damage the expensive tester. Also,
physical contact may damage the surface of the vehicle. Areal type means the
degree of roughness in the surface is measured over an arbitrary rectangular
range, giving a more accurate grasp of the state of the surface.
3) The measurement range should be large enough for a rusted metal surface.
Some rusted surfaces may have a large surface roughness that may be too rough
to be measured by some roughness measurement devices. The roughness test
method may only be utilized on the metal surface which is slightly rusted. Since
the experiment to measure the actual roughness of a rusted metal surface has
yet to be undertaken, some parameters from other metal surfaces can be used
as references; for example, a surface made by a circular saw will have a surface
roughness in the range Ra(μm)12.5~50 (Gao, 2015).
3) Digital Image Analysis Process
Digital image analysis has been used successfully by prior researchers to study
corrosion on different machines and products made of metal; for instance, civil
engineers use it to detect the rust on steel bridges; the electrical team use it to make
decisions on whether to reuse the rusted crossarms base on their rust conditions.
(Sharma, et al., 2013). This method is using the information from a picture (such
as: texture, color, size, etc.) taken by a digital camera, to detect and analyze the
rusted area with specialized image analysis software. This method was considered
as a fast, accurate, convenient and objective way to measure the rust on devices.
(Sharma, et al., 2013). For vehicles, a digital imaging process could assess vehicle
1. Take pictures of the corroded parts and materials using a digital camera (or
iphone/ipad/smart phone/tablet).
2. Analyze the digital images using software to evaluate the corrosion level:
a. Detect the presence of rusted areas in each digital image taken of each vehicle
part.
b. Determine the extent of rust and calculate the total rusted area versus
non-rusted area within each image.
3. Evaluate the overall corroded condition of the vehicles studied relative to vehicle
make, model, model year, history of corrosion treatment, and history of vehicle use
and care.
A key aspect to the success of such an analysis will depend on which suitable software
is chosen to analyze the digital images. Two commonly available software packages were
reviewed: 1) MATLAB (Matrix Laboratory) and 2) AnalyzingDigitalImages (ADI).
MATLAB is suitable for numeric computation, data analysis and visualization,
programming and algorithm development, application development and deployment.
(MathWorks, 2015). Therefore, MATLAB could be programmed to accomplish the digital
image analysis work, and to also execute the rust detection and analysis. This, however,
requires sophisticated coding and associated coding expertise. In addition, before
developing the coding, the programmer needs to learn how to detect the rusted areas,
develop mathematical expressions to represent them, and then “teach” the software how to
accomplish the rust detection and analysis work. The complexity of a digital image (for
may influence the accuracy of the rust detection and analysis, and, hence increase the
difficulty to develop an algorithm to model the rust detection and analysis with repeatable
accuracy.
The ADI software is designed for image analysis. It is freeware, and was initially
developed by John Pickle and Jacqueline Kirtley, Museum of Science, Boston (ADI, 2012).
It supports a program called Digital Earth Watch which used to measure the growth of
forests. The software provides several useful tools that can be applied to corrosion detection
and analysis. The Enhance Colors tool and Mask Colors tool can help to isolate the rusted
area with its color features and the Spatial Analysis tool can be used to measure the area.
To be more specific, the Mask Color tool can be used to isolate the color within the
range desired (could be colors representing different degrees of rust), and then the Spatial
Analysis tool measures the areas defined by the isolated colors. However, it would be
difficult to detect the rusting areas accurately if the background contains a variety of colors,
and consequently the estimated area of rust could be inaccurate.
The automatic rust detection based on digital images has been utilized for some
research applications. For example, Yamana, et. al. (2005) developed a digital image
analysis methodology to assess the corroded condition of utility pole crossarms and
evaluate their suitability for direct reuse, reuse after plating, or for retirement. In this
research, digital pictures of utility pole crossarms were taken showing different levels of
rust. The images were input into a computer, compared and classified into three groups,
according to crossarm reusability: reuse, retire, and reuse after plating. This computer
database of inputted pictures was used as a prototype classification and reuse judgment
judgement system, four different pattern classification methods - support vector machine
(SVM), k-nearest neighbor (kNN), radial basis function (RBF) network, and multilayer
perceptrons (MLP) - were used in the reuse judgment system and tested using compressed
images of the original pictures. The use of compressed images (e.g. 640×480 pixels
compressed to 20x15 pixels) improved the discrimination accuracy of the pattern
classification methods used. Based on the testing of the four pattern classification methods,
the SVM method provided the highest accuracy and greatest reliability in the researchers’
corrosion-based crossarm reuse judgment system.
2.4.Types of Corrosion
Corrosion in motor vehicles could be present in several forms. The most common and
obvious form is the general corrosion of the painted steel body panel (Johnson, 2001). Other
types of corrosion include:
1. Pitting corrosion, which occurs when metal contacts with chemicals like chlorides,
cause a small pit, and could potentially produce cavities and cause leaks;
2. Galvanic corrosion occurs in the area between two dissimilar metals, where one is
more electrochemically active than the other. This type of corrosion could be prevented by
careful design, especially by using different materials; and
3. Crevice corrosion occurs in the tight spaces of vehicles (e.g., between a washer and
the steel beam) where fluid might be trapped and accelerates the corrosion process
(Johnson, 2001).
The next challenge is to classify the degree of rust. A parking lot survey in Detroit area
Committee of the Society of Automotive Engineers (SAE) to measure the rusted area on
car body panels starting in 1985. In this survey, they classified the rust on vehicle into 3
categories: perforations, blisters, and surface rust. (Bryant, et. al., 1989). A perforation
was defined as a visible hole caused by the corrosion, or a complete penetration of the sheet
metal on the vehicle body panel. A blister was later defined as any bubbling on the paint.
Surface rust was defined as any visible rust on the metal surface in an area where the surface
paint had been removed.
The Corrosion Prevention and Control (CPAC) department of the U.S. Department of
Defense (DoD) developed a Corrosion Category Code to classify the corrosion degree for
ground combat and combat support vehicles of the U.S army. (Wang et. al., 2006). This
code is based on the level of maintenance required to return each asset to an operational
ready state. A check list of forty questions is provided to be worked through and results in
a level between 1 and 5, indicating level of corrosion repair/maintenance required. The five
categories are:
Category 1: Item requires no corrosion repair or preservatives, and has been
assessed within the past 6 months. The goal at this level is to maintain the item
as a category 1.
Category 2: Item requires surface preparation, spot paint, and preservation at
the operator and/or organizational level. The goal of this effort is to return the
item to category 1.
Category 3: Item requires maintenance performed beyond the operator level.
Spot painting has arrested the corrosion, but the item is now in a condition that
“Corrosion Control and Coating” (C3) program for repair. The goal of this
effort is to also return the unit to a category 1 condition.
Category 4: Item requires repair to sheet metal, major frame components, paint,
blasting and undercoating (e.g., replacement or repair of components such as
doors, fenders, and chassis frame rails, or battery boxes due to corrosion). The
goal of this effort is to immediately induct the item into the C3 program so that
it will return to the unit in a category 1 condition.
Category 5: The item is degraded to a degree that requires depot level repair
and replacement based on the deterioration caused by corrosion. (Wang, et. al.,
2006).
These five categories could serve as reference model for this research. It has the
potential to be modified for classifying corrosion in light-duty vehicles, as well as being
easier for a technician to apply.
Lastly, ASTM D 610-01 provides a standard method for evaluating corrosion, or in
their case, assessing the grade of rust on painted metal surfaces. In brief, this method
evaluates corrosion into ten grades of rust, corresponding to percentages of rust appearing
within a subject area. There are also four different categories of rust in terms of distribution:
spot, general, pinpoint, or hybrid. Finally, it provides illustrated examples of how the rust
might appear. Interestingly, this method does not seem to be widely known in the corrosion
prevention industry, nor does it seem to have been adapted to vehicle surfaces in any way.
It does not explicitly refer to perforations, which would be critical to protecting
the vehicle. Instead, the method states it is for quantifying the amount and
distribution of visible surface rust.
It would require the user to make judgments constantly to compare the
percentage of rust against the provided guidelines. Furthermore, there are at
least 30 identification combinations because of the ten grades of rust and the
variations in the rust patterns. This might be difficult to interpret, and even
comparing the rust seen against the examples they provide might be
challenging, especially if the area is not well lit.
Nevertheless, the concept of area comparison leading to gradations of rust – as with the
CPAC method described earlier - is likely a more useful approach to consider for this
3.
Methodology
3.1.Sampling and Analysis
In general, the amount of corrosion will be measured from a sampled vehicle in order
to develop a metric that shows various states of corrosion. The vehicles that have been
treated with corrosion prevention by Krown (or by some other treatment if identifiable) will
be classified as treated; all other vehicles will be classified as untreated.
In reality, practically all modern vehicles when sold have received anti-corrosion
treatment at the manufacturing stage. However, such production treatment might vary from
manufacturer to manufacturer, and furthermore, such treatments may not be identifiable by
the consumer. And of course, many vehicles do exhibit corrosion at some point during their
life, depending on the circumstances of their use, and there are a number of anecdotes on
how one make or model of vehicle “rusts more” than others; hence the aftermarket products
and applications for preventing corrosion. Technically, there are no untreated modern
vehicles. However, this research focuses on the aftermarket scenarios and so treated and
untreated refer exclusively to aftermarket applications of corrosion prevention products
and/or processes.
Some of vehicles may have been treated by aftermarket anti-corrosion treatment other
than the Krown process (e.g., “black” coatings), but they may be difficult to identify by
visual observation alone. A survey was provided to owners to collect their vehicles’
information and included questions about aftermarket treatment. Interestingly, there were
no other treatment methods stated by the owners. As a result, all treated vehicles in this
vehicles will be sampled from Krown’s treatment facilities. In addition, vehicle owners
were surveyed to obtain more information of the history of the vehicle and how the vehicle
was maintained (see Appendix A: Corrosion Evaluation Questionnaire). This survey was
approved by the University of Windsor’s Research Ethics Board. Conversely, data for
untreated vehicles come from:
1. Vehicles coming into the Krown’s facility for other treatment rather than anti-rust
treatment (e.g., tire change, oil change);
2. Vehicles which are first-time treated by Krown; and
3. Scrapped vehicles in an auto-recycling facility. Although the vehicle history is not
known, during the Krown treatment process, holes are drilled on the door seam and
then plugged. This plug or hole can be used to identify whether it is a treated vehicle
or not (see sample picture in Figure 1). Other corrosion treatment processes also
Figure 1 - Holes drilled on the door seam during the Krown treatment process.
Approximately 200 vehicles need to be sampled for this project in order to provide a
robust sampling set that covers a variety of vehicle make, models, and possible conditions.
200 vehicles is an achievable number of samples. Some sampling locations are outside of
Windsor, and may require extensive travel. Overall, 200 vehicles would be a realistic
number for the research.
Image analysis using photos taken for each vehicle’s body panels will be the primary
method to measure the corrosion (or lack of corrosion) on vehicles. A stick with scales is
used as a reference to determine the area of rust. The angle of taking the picture may
influence the accuracy of measurement, so the pictures should be taken as vertical to the
Pictures will be taken to provide the evidence of corrosion on different parts of
vehicles. Several typical car parts will be isolated during the first and second sampling
rounds and will be classified as corrosion prone areas. The amount of rusted area is a
measure of the degree of rust. This assumes fundamentally that a larger amount of rusted
area indicates a greater degree of rust.
Before taking the pictures of the vehicles, the sample number, car make, model, model
year, and treated or untreated condition will be recorded. Pictures will be taken for each
body panel, with a T-square ruler used as an established, comparative reference of length.
(see Figure. 2). Pictures will also be taken of the hood and the under hood parts (see
Figure. 3). If any components are observed to be corroded, more pictures will be taken for
those components to observe them in detail.
After the vehicle is hoisted, pictures will be taken of the underbody parts with the T
square again as a reference (see Figure. 4). The underbody parts that will be taken into
consideration include the cross member, control arm, brake and fuel lines, wheel well,
rocker panel and the exhaust system.
Each picture will eventually be analyzed to measure the rusted area for the different
categories: perforations, blisters, and surface rust. These data and the results from the
Figure 2 - Example of exterior body panel where sampling was conducted.
Figure 3 - Example of under the hood where sampling was conducted.
3.2 Measuring the Corrosion on Vehicles
The approach in the Corrosion Category Code developed by CPAC (Wang et. al., 2006)
is a useful basis to initially begin with. The analysis needs to be done first so that the data
could support the classification of each body panel (and other corroded parts and
assemblies) of the sampled vehicle into one of the five degrees of corrosion. The area of
each category of corrosion (perforations, blisters, surface rust) will be measured for each
body panel (and other corroded parts and assemblies). A weight will be assigned for each
corrosion category: for example, the weight for perforations, blisters, and surface rust are
designated Wp, Wb and Ws, respectively. The overall corrosion index can be calculated
as:
P * Wp + B * Wb + S * Ws = Corrosion Index ………. Eq. 1
P = perforation area; Wp = weighting assigned to perforations
B =blister area; Wb = weighting assigned to blistering
S = surface rust area; Ws = weighting assigned to surface rust
The value of the weights above represent the severity of each corrosion category
compared to one another. In general, blistering would be considered the mildest form of
corrosion because the paint is still present and offers some protection, although corrosion
has started beneath the painted surface. Surface rust would be more severe because the
protective coatings have essentially failed, and the metal is now corroding. Perforation is
the most severe because the metal has lost part of its integrity and for the perforated area
as surface rust, and blister is considered to be half severe as surface rust, the weighting
values will be set as Wp = 2, Ws = 1 and Wb = 0.5.
3.3 Regression Analysis
Regression analysis is a statistical tool to determine the relationship between variables.
(Sykes, 1993). For this case, the regression analysis can help determine a model to quantify
the effects of different vehicle information such as vehicle age, anti-corrosion treatment,
mileage, etc., and predict the amount of corrosion on the vehicle using the given
information. The software that is selected for this project is Microsoft Excel. An add-in was
4.
Findings
4.1 First Stage Sampling
The main objective for the first round sampling was to familiarize ourselves with how
vehicle rust usually appears, and what would be the practical limitations to sampling
vehicles. The first round of sampling was conducted at OK Santing, Windsor, Ontario. This
facility runs a business mainly based on servicing and replacing tires, but is also a
franchisee of Krown Corporation’s anti-rust treatment. Five to ten vehicles daily undergo
the Krown treatment. Most of the vehicles sampled are coming in for the Krown treatment,
but a number of vehicles coming for a tire change have also been sampled. The purpose of
sampling vehicles not coming in for any sort of corrosion treatment was to build an
inventory of how vehicles under a variety of driving conditions would corrode. It was
anticipated that vehicles that had undergone some sort of corrosion treatment would not
provide a true indicator of how corrosion would otherwise develop under typical
circumstances.
Typical car parts which are most likely to have rust were also identified. During the
six-day sampling, a total of 26 vehicles were sampled, including 7 treated vehicles and 19
untreated vehicles. From the pictures and consulting with OK Santing’s technician
responsible for applying the Krown treatment, six typical vehicle parts were isolated as
parts particularly vulnerable to rust. They are: control arm, cross member, rocker panel,
wheel well, hood seam and exhaust system.
A comparison between the treated vehicles and untreated vehicles was conducted for
corrosion than an untreated vehicle. Pictures were analyzed using the spatial analysis tool
in the ADI software to measure the rusted area on the cross member of a treated (T) 2009
Ford F-150 (Figure. 5) and an untreated (UT) 2011 GMC Sierra (Figure. 6), and the results
are shown in Table 1.
Table 1- Comparison of rusted area on cross member of two vehicles.
T 2009 Ford F150 UT 2011 GMC Sierra
Total Area (cm2) 842 554
Rusted Area (cm2) 13.2 77.2
% of area as rust 1.6 13.9
Figure 5 - Treated 2009 Ford F150 Cross member.
The spatial analysis tool permitted the area of corrosion to be accurately measured. In
order to conduct this analysis, a picture must be cropped to isolate the target area and then
the ADI software Polygon tool is used to measure the total area of the target part and the
rusted area.
A color analysis process was also conducted using the ADI software. A photo of the
control arm was selected for this test, as illustrated in Figure 7.
Figure 7 - Color analysis test on the control arm.
In this picture, the color of the rusted areas are mostly within the range of 25~50% of
red intensity. Using the mask tool and adjusting the red intensity range to 25~50%, the
turn white. After the rusted area was isolated within the picture, the spatial analysis tool
was used to automatically measure the black area to get the percentage of the rusted area
from the picture. For Figure 7, the rusted area occupies 30% of the picture. This method is
less time-consuming compared with the spatial analysis method, but also has its weakness:
the color analysis requires a picture with uniform lighting brightness, which is hard to
achieve in a treatment facility.
Only three to five vehicles came for Krown treatment every day at OK Santing, which
is insufficient to meet the 200-vehicles target. Vehicle histories were not collected for the
first stage sampling: only the vehicle make, model, model year and treated/untreated were
recorded. It would be valuable to collect more detailed information of the vehicles’ history.
Manual measurement of the corrosion area using the spatial analysis tool will be used in
the research because of its accuracy.
4.2 Second Stage Sampling
The second stage sampling involved collecting data for a larger number of vehicles and
much more detailed information of the vehicles’ history. The vehicles were sampled at
Krown’s treatment facilities in both north and south London, Ontario. Each facility treats
10 to 15 vehicles daily during the spring. A total of 98 vehicles were sampled and each
owner of a sampled vehicle completed a survey to provide the information of the vehicle’s
history. All data collected from the survey has been entered into an excel file.
All sampled vehicles were classified into five different car types: Sedan, SUV, Truck,
Figure 8 - Count of each car type.
Due to the similarity of the vehicle structure, SUV will be considered equivalent to a
sedan. Figure 9 shows the number of each vehicle brand that was brought into the facilities
to be treated using the Krown process.
Figure 9 - Count of vehicle brand.
The corrosion resistance of different vehicles may vary from different vehicle
manufacturers. Anecdotally, there often claims that one vehicle make and/or model rusts
SEDAN SUV TRUCK VAN COUPE
Total 35 22 21 14 6
0 5 10 15 20 25 30 35 40 Ford Che vrol et Dod ge Toyo ta Hon da Pont iac Chry sler Niss an Hyu ndai Buic k Jeep Volk swa gen Suba ru Linc oln Maz da Kia Infin iti Volv o Olds GM C Total 28 10 10 8 8 7 3 3 3 3 3 2 2 2 1 1 1 1 1 1
0 5 10 15 20 25 30
more easily or more severely than another. Based on the data availability to date at this
point in the research, Ford and Dodge models are selected for initial tests to demonstrate
the general trend of vehicle corrosion versus vehicle age from the same manufacturer. The
corrosion index is calculated using equally weighted corrosion categories for body panels
initially, given that there is no detailed information to justify changing the weights at
present. Figures 10 to 11 show the trend for combined data of both Ford and Dodge, and
Figures 12 to 15 show the trend for Ford and Dodge separately.
Figure 10 - Ford and Dodge body panels corrosion index. -500
0 500 1000 1500 2000 2500 3000
0 5 10 15 20 25 30
CO
R
R
O
SIO
N
IN
DE
X
AGE OF VEHICLE
FORD AND DODGE BODY PANELS
CORROSION INDEX
TREATED
UNTREATED
Linear (TREATED)
Figure 11 - Ford and Dodge underbody parts corrosion index.
Figure 12 - Ford body panels corrosion index. -500 0 500 1000 1500 2000 2500 3000 3500 4000 4500 5000
0 5 10 15 20 25 30
CO R R O SIO N IN DE X
AGE OF VEHICLE
FORD AND DODGE UNDERBODY PARTS
CORROSION INDEX
TREATED UNTREATED Linear (TREATED) Linear (UNTREATED) -500 0 500 1000 1500 2000 2500 30000 5 10 15 20 25 30
CO R R O SIO N IN DE X
AGE OF VEHICLE
FORD BODY PANELS CORROSION INDEX
TREATED
UNTREATED
Linear (TREATED)
Figure 13 - Ford underbody parts corrosion index.
Figure 14 - Dodge body panels corrosion index. -500 0 500 1000 1500 2000 2500 3000 3500 4000 4500 5000
0 5 10 15 20 25 30
CO R R O SIO N IN DE X
AGE OF VEHICLE
FORD UNDERBODY PARTS CORROSION
INDEX
TREATED UNTREATED Linear (TREATED) Linear (UNTREATED) -1000 -500 0 500 1000 1500 2000 2500 30000 5 10 15 20 25
CO R R O SIO N IN DE X
AGE OF VEHICLE
DODGE BODY PANELS CORROSION INDEX
TREATED
UNTREATED
Linear (TREATED)
Figure 15 - Dodge underbody parts corrosion index.
All six figures show the treated vehicles tend to have less rust on both body panels and
underbody parts. But the poorly clustered data and less fitted trend line show this test cannot
provide a definitive conclusion with respect to corrosion versus a particular make or model.
It is conceivable that different vehicle makes have different corrosion resistance
performances, but 200 vehicle samples do not provide enough data to test the performance
of each individual vehicle make or model.
Overall, while the collected data so far was useful, corrosion was rarely found on the
vehicle bodies from the first and second stage sampling. More untreated vehicles that
exhibited rust were needed for the research. The third stage of sampling involved visiting
facilities other than Krown’s to reach the amount of 200 vehicles.
4.3 Third Stage Sampling
The vehicle data from the previous samplings provided significant information about
treated vehicles from Krown’s facilities. In order to obtain more data for the corrosion of
0 100 200 300 400 500 600 700 800 900
0 5 10 15 20
CO R R O SIO N IN DE X
AGE OF VEHICLE
DODGE UNDERBODY PARTS CORROSION
INDEX
TREATED
UNTREATED
Linear (TREATED)
vehicles, especially from vehicles which have not been treated by rust proof products, a
third round of sampling is required. The sampling locations are A&L Auto Recycler (A&L)
in Lakeshore, Ontario, and the Standard Auto Wrecker (Standard) in Port Hope, Ontario.
The vehicles that were sampled in these two facilities are all end-of-life vehicles (ELV),
and they can be classified into two types: the high salvage ELVs and the low salvage ELVs.
The high salvage ELVs are relatively newer vehicles involved in collisions. Based on the
information provided by the technicians, vehicles are delivered to the facility after the
collision, then they are dismantled for usable parts. Most of the vehicles do not remain in
the storage yard for more than two weeks; therefore high salvage ELVs remain essentially
in the same corrosion conditions as during their operational stage. On the other hand, the
low salvage ELV represents vehicles which are relatively old, and often have less reusable
and in-demand materials and parts. Low value ELVs may have stayed in the yard for a
much longer time after the retirement than the high salvage ELVs. More rust is expected to
be found on the low salvage vehicles because the lack of maintenance and older age.
Table 2 - Vehicle classes from third round sampling.
Location
Vehicle type
A&L Auto Recycler Standard Auto Wrecker
High salvage ELV 3 53
4.4 Data Analysis
All pictures are analyzed by the ADI software using the spatial analysis tool. The
amount of rusted area from each target vehicle part are entered into a spread sheet. The
vehicle parts include the hood, fenders, doors, quarter panels and rocker panels. Three
different types of corrosion are recorded for each body panel: perforation, blistering and
surface rust. Underbody parts include the control arms, cross members and brake/fuel lines.
A total amount of 202 vehicles were sampled, but only 193 vehicles are included into
the analysis. Among them are 115 vehicles from Krown’s facilities, 25 vehicles from A&L
Auto Recycler, and 53 vehicles from Standard Auto Wrecker. Of the Krown vehicles, 68
vehicles were actually treated by Krown, and the rest of the sampled vehicles are considered
as untreated vehicles. The amount of sampled vehicles for each vehicle maker is shown in
Figure 17, and the amount of sampled vehicles for each individual model year are shown
Figure 16 - Amount of sampled vehicles from 3 locations.
Figure 17 - Count of vehicle makes
115 25
53
Amount of sampled vehicles from 3 locations
Krown's facilities A&L Auto Recycler Standard Auto Wrecker
0 5 10 15 20 25 30 35 40
Figure 18 - Count of vehicle model year
An overall data analysis shows the trend of corrosion on vehicles. All corrosion areas
for each vehicle include the body panels and the underbody parts are added up for an overall
corrosion area as original shown in Equation [1]. As an initial analysis, the three corrosion
types (perforation, blistering and surface rust) are given by the same weighting scale (Wp :
Wb : Ws = 1 : 1 : 1). At this point then, the Corrosion Index is the aggregate of all observed
areas exhibiting one of the three types of corrosion. The result is shown in Figure 19:
0 5 10 15 20 25 30
1986 1987 1988 1989 1990 1991 1992 1993 1994 1995 1996 1997 1998 1999 2000 2001 2002 2003 2004 2005 2006 2007 2008 2009 2010 2011 2012 2013 2014 2015
Figure 19- Overall Corrosion Index vs. vehicle age (linear fit)
Figure 19 shows the overall trend of corrosion on vehicles: the amount of rusted area
increases with the age of vehicle, and furthermore, treated vehicles tend to have a slower
rate of increase of corrosion than untreated vehicles. Based on the sampling to date, it is
observed repeatedly that corrosion features between vehicle body panels and underbody
parts are quite different. From this point onwards, separate analyses for these two different
vehicle parts will be performed. Lastly, the data are highly distributed, resulting in a very
low R-square value. Figure 21 and Figure 22 show the corrosion trends for the vehicle body
panels and underbody parts separately.
The linear fit is selected initially as a “first cut”; in some cases, it well modeled the
general trend of corrosion index vs. vehicle age. The logarithmic, exponential and power
fit cannot be selected from the Excel statistical analysis because the data contains zero
values. Of course, there are more powerful or alternative statistical analyses available, but
at this stage, it was considered important to work with the data using the most
straightforward approaches possible. There is relatively little prior research to reference,
y = 72.876x - 71.077 R² = 0.1966 y = 127.71x - 18.232
R² = 0.3008
-1000 0 1000 2000 3000 4000 5000 6000 7000
0 5 10 15 20 25 30 35
COR ROSION IN DE X VEHICLE AGE
OVERAL CORROSION INDEX (BODY PANEL + UNDERBODY
PARTS) VS. VEHICLE AGE
and so justifying more elaborate analyses is not warranted. However, the data was also
tested with the polynomial fit, and Figure 20 shows the result.
Figure 20 - Overall Corrosion Index vs. vehicles age (polynomial fit)
From Figure 20, the trend lines show it does not fit the plot better than linear fit,
especially for the older vehicles. While the R2 value is slightly improved, the line suggests
that older, untreated vehicles will rust less. This does not make sense physically. It could
be further argued that the vehicles at ages 25 and 30 should be discarded as outliers.
However, at this stage, there is no reason to assume why they differ radically from any
other vehicle, and furthermore, they are untreated and so would presumably be subject to
the same conditions as any other untreated vehicle. One possible explanation is that such
vehicles are collector vehicles and so are better maintained, but this cannot be confirmed
with the data provided, and even if they were, would constitute a very small subset.
Therefore, at this stage of research, the linear fit is considered as the best choice to
demonstrate the corrosion trend on vehicles.
y = -2.2331x2+ 121.27x - 267.72
R² = 0.2076 y = -5.5828x2+ 242.91x - 413.45
R² = 0.3527
-1000 0 1000 2000 3000 4000 5000 6000 7000
0 5 10 15 20 25 30 35
COR ROSION IN DE X VEHICLE AGE
OVERAL CORROSION INDEX (BODY PANEL + UNDERBODY
PARTS) VS. VEHICLE AGE
Figure 21 - Corrosion Index vs. vehicle age for body panels
Figure 21 shows a significant difference between the treated and untreated vehicles.
The treated vehicles show relatively small amounts of rust on their body panels.
Conversely, untreated vehicles start to show rust on their body panels after 5 years, and the
data tends to be much less clustered after 15 years old. Corrosion on untreated vehicles
therefore seems more widespread in terms of area coverage over time for all sampled
vehicles.
y = 4.7938x - 11.824 R² = 0.0815 y = 61.501x - 213.61
R² = 0.2834
-500 0 500 1000 1500 2000 2500 3000
0 5 10 15 20 25 30 35
COR
ROSION
IN
DE
X
VEHICLE YEAR
CORROSION INDEX VS. VEHICLE AGE FOR BODY PANELS
Figure 22 - Corrosion Index vs. vehicle age for underbody parts.
Figure 22 shows that corrosion occurs earlier on underbody parts than on body panels.
The low salvage vehicles from A&L are not included in this test as some of the underbody
parts had already been removed before the sampling. The trend lines for treated and
untreated underbody parts show less difference than in Figure 21 which focused only on
the body panels, but the untreated vehicles still show greater rust than the treated ones.
The data were also analyzed to compare three different corrosion types on the body
panels for the treated and untreated vehicles respectively. Figures 23, 24, 25 show the
different trends for three corrosion types on vehicle body panels. All scales on the Y axis
are set to the same scale.
y = 72.876x - 71.077 R² = 0.1966 y = 127.17x - 15.945
R² = 0.2999
-1000 0 1000 2000 3000 4000 5000 6000 7000
0 5 10 15 20 25 30 35
COR
ROSION
IN
DE
X
VEHICLE YEAR
CORROSION INDEX VS. VEHICLE AGE FOR UNDERBODY
PARTS
Figure 23 - Corrosion trend for perforation.
Figure 24 - Corrosion trend for blistering.
-500 0 500 1000 1500 2000 2500 3000
0 5 10 15 20 25 30 35
Corro sion In d ex Vehicle Age
Treated VS. Untreated for Perforation (Body Panel)
Treated - perforation
Untreated - perforation
Linear (Treated - perforation)
Linear (Untreated -perforation) -500 0 500 1000 1500 2000 2500 3000
0 5 10 15 20 25 30 35
Corro sion In d ex Vehicle Age
Treated VS. Untreated for Blistering (Body Panel)
Figure 25 - Corrosion trend for surface rust.
The result from the three figures shows that for blistering (Figure 24), it has the smallest
coverage from the sampled vehicles, and that the difference between treated and untreated
vehicles appears relatively insignificant. In Figure 25, there again appears to be noticeable
differences between treated and untreated vehicle surface rust coverage, and this is
consistent with our earlier observations from prior figures. In Figure 23, perforation
differences can be seen between treated and untreated vehicles, although this might not be
as easily apparent. However, perforation is considered as the most severe rust condition
because the vehicle metal has been fully compromised, while blistering is the least severe
because the paint is still intact. More differences will be shown between the treated and
untreated vehicles in forthcoming analyses.
The vehicles sampled from Krown’s facilities are all operational vehicles: most are
expected to be operating for some time yet. However, the vehicles from A&L Auto
-500 0 500 1000 1500 2000 2500 3000
0 5 10 15 20 25 30 35
Corro
sion
In
d
ex
Vehicle Age
Treated VS. Untreated for Surface Rust (Body Panel)
Treated - Surface Rust
Untreated - Surface Rust
Linear (Treated - Surface Rust)
Recycler and Standard Auto Wrecker are all ELVs. Furthermore, most of the vehicles from
A&L Auto Recycler are low salvage ELVs, only three of them are high salvage ELVs.
There could therefore be differences among the vehicles from the three different locations.
Figure 26 shows the different trends for the untreated body panels from the three locations,
while Figure 27 shows the different trends for the untreated underbody parts from Krown
versus the high salvage vehicles from standard and A&L.
Figure 26 - Untreated Corrosion Index from 3 sampling locations.
Figure 26 shows that there are noticeable differences between the untreated body
panels from vehicles sampled at Krown’s facilities and the other two locations. The
Krown’s untreated vehicle body panels tend to have less corrosion compared with those
from the other two locations. Because corrosion treatment cannot actually recover metal
from corrosion, it is conceivable that a vehicle owner will not bother to bring in a vehicle
that already has significant rust for corrosion treatment. Therefore, the untreated vehicle
data from Krown will likely not represent the average corrosion condition of body panels
-1000 -500 0 500 1000 1500 2000 2500 3000
0 5 10 15 20 25 30 35
Corro
sion
In
d
ex
Vehicle Age
Untreated Corrosion Index from 3 Sampling Locations (Body
Panel)
Krown Untreated Standard Untreated A&L Untreated
found on untreated vehicles in the general vehicle population. In this respect, vehicles
sampled at Krown – even if they are untreated – are likely self-selected to be in “better
condition” than a typical untreated vehicle of comparable age.
Figure 27 - Untreated Corrosion Index from 3 Sampling Locations (Underbody Parts).
However, Figure 27 shows that the differences in underbody parts from vehicles
sampled at Krown and the high salvage ELVs at Standard and A&L are not as significant.
This could be for three reasons: 1) customers are usually not aware of the condition of the
underbody of their vehicle; 2) most of the routine maintenance (e.g., washing and waxing)
cannot access the underbody parts; and 3) it was noticed that even for practically new
vehicles coming in for treatment, underbody parts would already have some corrosion
present.
0 500 1000 1500 2000 2500 3000 3500 4000 4500
1 6 11 16 21 26 31
Corro
sion
In
d
ex
Vehicle Age
Untreated Corrosion Index from 3 Sampling
Locations (Underbody Parts)
High salvage ELVs (Standard and A&L)
Untreated from Krown
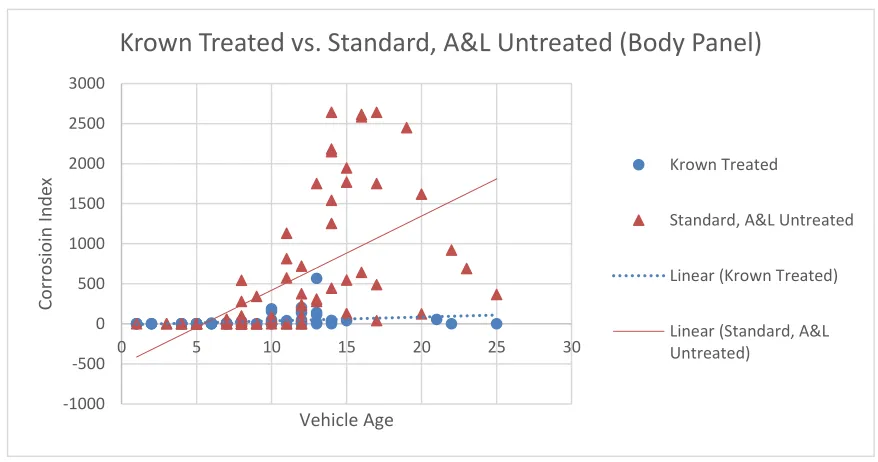
Because the untreated body panels from Krown facilities likely do not represent typical
corrosion, they are removed from further analysis. Instead, Figure 28 shows the differences
between body panels between treated vehicles (from Krown) and the untreated vehicles
(from A&L and Standard locations). Based on the trends exhibited, body panels from
untreated vehicles display noticeable more corrosion than untreated vehicles, especially in
the 8 to 20 year age range. Given the slight increase in the average duration of vehicle
ownership to 11.5 years, corrosion will likely be an increasingly important issue to vehicle
owners particularly if the longevity of a vehicle continues to rise (IHS Automotive, 2015).
Figure 28 - Krown Treated vs. Standard, A&L Untreated (Body Panel)
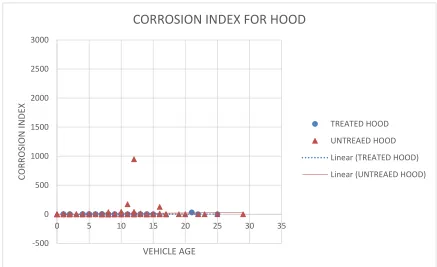
Another set of analyses shows the different corrosion trends for each body panel
separately, which are the hood, fenders, doors, quarter panels and rocker panels, in Figures
29 through to 33.
-1000 -500 0 500 1000 1500 2000 2500 3000
0 5 10 15 20 25 30
Corro
sioin
In
d
ex
Vehicle Age
Krown Treated vs. Standard, A&L Untreated (Body Panel)
Krown Treated
Standard, A&L Untreated
Linear (Krown Treated)