Analysis of ECG Signal for Detecting Heart
Blocks Using Signal Processing Techniques
Ch.Tanmaya1, N.Syamala2, P.Rajesh3, B.Pavannadh4 , B.Sridhar5
B. Tech Student, Department of Electronics and Communication Engineering, LIET, Jonnada, JNTUK, India1,2,3,4
Professor, Department of Electronics and Communication Engineering, LIET, Jonnada, JNTUK, India5
ABSTRACT:ECG is one of the accurate methods for examining the heart and plays a significant role in detection of
size of the blocks and identifies its precise location in heart. In general signal generated using electrodes which convert physical energy to electrical signal superimposed a random noise on the signal. Signal noise is carefully removed and especially R-R peaks of ECG signal to be restored by using Savitzky-golay filtering techniques and Walsh hadamard transform, it will be used to extract quantitative information from ECG signals. After a frequency domain based FIR filter is applied on extracted information to get the accurate values by calculating beat count and peak analysis of R- R intervals. The proposed method is to be stimulated on MATLAB and to test with patient ECG data signal.
KEY WORDS: Savitzky-Golay filter, signal processing, Walsh-hadamard transform, de-noising, spike free ECG.
I.INTRODUCTION
An electrocardiogram (ECG) records the electrical activity of heart. The automatic analysis of electrocardiogram (ECG) has been subject of intense research during the last three decades and is well-known in Bio medical engineering field. The particular interest in the ECG analysis comes from its role as an efficient noninvasive investigative method which provides useful information for the detection, diagnosis and treatment of cardiac diseases [1].
The ECG signal has a time periodicity allowing defining an elementary beat composed by specific waveforms, appearing periodically in time. Fig 1.shows the heartbeat and its respective waveform labels. The study of the waveform amplitudes and patterns constitutes the basis of ECG analysis.
Fig 1.Heartbeat observed on an ECG with an elementary waveforms and intervals identified.
easy-to- implement MATLAB model that generates ECG and gives us mathematical control over the ECG signal. Our model fuses mathematical functions in MATLAB with psychological data
Peter kovacs [4] presents an algorithm which generates realistic synthesis ECG signals, this algorithm, among others, can be used to testing the new methods in ECG processing. By using numerical and Geometrical parameters, which are diagnostically importance the generated signal can be interpreted as Bio medical signal with important diagnostically intervals such as QRS, QT, PR etc. On the other hand this method gives us a strict mathematical control over the signal.The details and importance of the ECG wave form given in the table 1.1 and1.2, based on this data the radiologist can estimated the of the heart of the human. The proposed method consist the simulation of generate of ECG wave in order to consideration of heart blocks.
Fig 2 schematic representation of normal ECG waveform
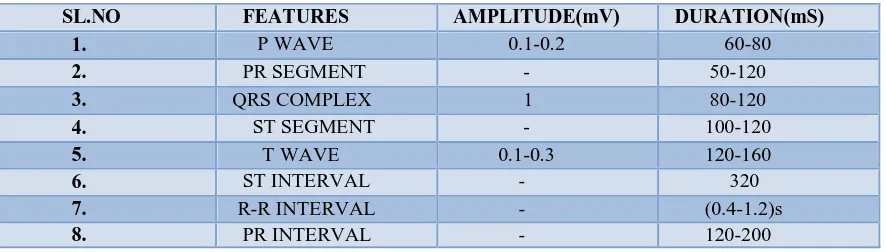
Table 1.1.shows the features of P wave, QRS complex and T wave in amplitude and duration of each R-R interval is 0.4-1.2s.
WAVES REPRESENTATION
P WAVE
The amplitude level of this voltage signal wave is low and represents depolarization and contraction of right and left atria clear P wave before QRS complex. Analyzing of p waves with a high signal-to-noise ratio in ECG signal.
QRS COMPLEX
The Largest voltage deflection of approximately 10-20 mV can be occur in QRS complex but may vary in size depending on age; gender.the voltage amplitude of QRS complex gives us the information on cardiac diseases. The time for ventricles may depolarize and may give information about conduction problems in ventricles, during the QRS complex.
T WAVE It represents the ventricular repolarization.large T wave may represents Ischemia and Hyperkalaemia.
Table 1.2. Amplitude and duration of waves, intervals and segments [6], [7], [8] of ECG signals.
SL.NO FEATURES AMPLITUDE(mV) DURATION(mS)
1. P WAVE 0.1-0.2 60-80
2. PR SEGMENT - 50-120
3. QRS COMPLEX 1 80-120
4. ST SEGMENT - 100-120
5. T WAVE 0.1-0.3 120-160
6. ST INTERVAL - 320
7. R-R INTERVAL - (0.4-1.2)s
II.NOISE IN THE ECG
Generally the recorded ECG signal is often contaminated by different types of noise and artifacts that can be within the frequency bands of ECG signal which may change the characteristics of ECG signal. Hence it is difficult to extract the information of the signal. The corruption of ECG signal can be occurring due to following major noises[12]. POWERLINE INTERFERENCES
Power line interferences contain 60 Hz picks up (in U.S) or 50Hz picks up (in India) because of improper grounding. And will appear as an additional spike at integral multiples of fundamental frequency[12]. Its frequency content is 50 Hz/60 Hz and its harmonics, amplitude is up to 50 percent of peak to peak ECG Signal amplitude. A 60 Hz Notch filter can be used to remove the power line interferences.
BASELINE DRIFT
Baseline drift may be caused in chest-lead ECG signals by coughing or breathing with large movement of chest, when an arm or leg is moved in case of limb lead acquisition [12].Baseline drift can sometimes caused by the variations in temperature and bias in the instrumentation and amplifier shown in the fig 3. Its Frequency ranges generally below 0.5 Hz. To remove baseline drift a high pass filter with cut-off frequency 0.5 Hz is used.
Fig 3. Baseline drifts in ECG signal
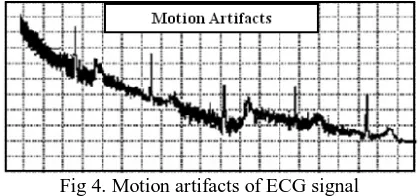
MOTION ARTIFACTS
Motion artifacts are transient baseline change due to electrode skin impedance with electrode motion. It can generate larger amplitude signal in ECG waveform shown in fig 4.. The peak amplitude of this artifact is 500 percent of peak to peak ECG amplitude and its duration is about 100-500 ms.An adaptive filter can be used to remove the interference of motion artifacts[12].
Fig 4. Motion artifacts of ECG signal ECG NOISE
During the ECG recordings, the signal may be corrupted by the low and high frequency noise that alters the waveform of the ECG trace from its original structure. To eliminate the noise the most common types of noise and artifacts must be considered [5][12].
QUALITY MEASUREMENT: Extraneous noise in the ECG trace may be caused by a variety of noise sources including perspiration, respiration, body movements and poor electrode contact. The magnitude of the noise may be exceeding the amplitude of the QRS complex by several times, but its spectral content is usually confined to an interval below 1 Hz. .
ELECTROMYOGRAPHY NOISE (EMG NOISE): EMG noise is caused by the electrical activity of the skeletal muscles during the periods of contraction or owing to a sudden body movements.Although, the frequency components of EMG overlaps considerably with that of QRS complex, it also extends into the higher frequencies. As a result, the processing of ECG trace to remove these noises affects naturally results in some distortion of the signals.
III. MEASURING OF HEART BEAT
There are three simple methods to determine the heart rate (HR):
The square counting method:
The square counting method is ideal for regular heart rates. Use the sequence 300-150-100-75-60-
50-43-37.count from the first QRS complex, the first thick line is 300, the next thick line 150 etc.Stop the sequences at the next QRS complex. When the second QRS complex is between two lines, take the mean of two numbers from the sequence or use the fine tuning method listed below:
Use a calculator:
Count the small (1mm) squares between two QRS complexes. This method can works well for tachycardia, which is lower than 100 beats/minute. The ECG paper runs at 25 mm/sec through the ECG Printer; therefore: Heart rate (beats/min) =300/ (number of squares)
The marker method:
Non regular rhythms are best determined with the “3 second marker method”. Count the number of QRS complexes that fit into 3 seconds (some ECG writers print this period on the ECG paper). Multiply this number by 20 to find the number of beats/minute.
IV.PROPOSED METHOD
ECG signal can be recorded by the electro cardiograph, which can generates the signal of ECG shown in block diagram fig.5. ECG signal with various conditions can also generate using above tables 1&2 data[]
BLOCK DIAGRAM:
Fig 5. Block diagram of the proposed method of ECG Signal processing
In general the filter can be chosen a odd number value then signal , which can also named as Savtizky-Golay filter and the denoising of the ECG signal.The sampled ECG data undergoes for the beatcount,to calculate the heart rate
i.e., heart rate (beats/min) = 300/(number of squares)
After calculating the beat count, The peak of ECG signal can be calculated by a signal process technique that is a FFT based FIR filtering process technique. In this process undergone a continuous repeated operations until to get a R-R peaks above the normal values those peaks will super impose on the input ECG wave form. This waveform has give a information whether human heart have the blocks or he is in normal conditions.
the ECG after denoising can be superimposed on the original ECG signal. Further it can be used to detect the peak analysis, can various risk factors can be identified after the analysis of PQRST Complex waveforms. Finally the spike free ECG output can be obtained after filtering ,risk factor calculation, analyzing peak analysis, beat count measurement etc.
V.RESULTS AND EXPLANATION
It is output of original ECG signal which is obtained by giving default values in MATLAB coding similarly, different wave forms can be produced with different values. Figure 6 shows the complete signal input and this can be further processed for the filtration techniques for deducing the noise.
Fig6: Generated ECG signal Fig:7 sampled signal
The signal sampled by using a sampling process technique as shown fig 7. Then the wave form decimated with ecg as shown in fig 8.
Fig7: Decimated ECG signal Fig: 8 spectrum comparison of noise, de-noise signal
Fig: 10 Detection of peaks of the ECG signal
EXPERIMENTAL RESULTS ON R WAVE PEAK DETECTION:
Figure11: shows R Peak Detection The detection of R peak is the first step of feature extraction. The R-peak has a largest amplitude corresponds to other peaks.
Fig:11a&b. superimpose the peak on signal
Hence amplitude of .5 has been taken as a threshold to detect R peak and finally we detect the R peak location and the difference between two R peaks is the R-R interval with reference to x axis. From the R wave detection we can calculate the heart beat .R peak is essential part in ECG wave .The high-resolution electrocardiography has become an important clinical tool for analyzing the high-frequency content of electrocardiograms (ECGs). Recent emphasis has been on the detection of ventricular late potential activity due to its ability to predict ventricular tachycardia (VT) in myocardial infarction (MI) patients. To accentuate the high-frequency components, the signal-averaged ECG data are filtered using high-pass filters. Two types of filters used in commercial systems, bidirectional Butterworth and Fourier transform filters, are compared using a common signal-averaged ECG data base. Signal-averaged ECG data acquired at two clinical sites (Mayo Clinic and Bowman Gray School of Medicine) using the MAC15 HIRES system were filtered using a 40-Hz fast Fourier transform (FFT) filter with a 6 dB/octave roll off on an IBM-compatible personal computer. The same average data were filtered using a 40-Hz bidirectional Butterworth filter with similar roll off. Using a common algorithm, outputs of both filters were used to compute vector magnitude and to obtain the measurements to quantify high-frequency, low-amplitude (HFLA) signals. The measurements include total QRS duration, duration of HFLA signals, root mean square voltage, and mean voltage in the terminal 40 msec. The results were very similar and both filters were found to be functionally equivalent.
VI. CONCLUSION
REFERENCES
[1]. Rodrigo V. Andreão, Bernadette Dorizzi, and Jérôme Boudy ECG Signal Analysis Through Hidden Markov Models IEEE Transactions On Biomedical Engineering, Vol. 53, No. 8, August 2006 1541
[2]. .Joseph Ackora-Prah, Anthony Y. Aidoo “An Artificial ECG Signal Generating Function in MATLAB”, Applied Mathematical Sciences, Vol. 7, 2013, no. 54, 2675 - 2686 HIKARI Ltd
[3]. .P´eter Kov´acs ECG Signal Generator Based On Geometrical Features Annales Univ. Sci. Budapest., Sect. Comp. 37 (2012) 247–260 [4]. . Zhidong Zhao , Lei Yang , Diandian Chen and Yi Luo A Human ECG Identification System Based onEnsemble Empirical Mode
Decomposition Sensors 2013, 13, 6832-6864; doi:10.3390/s130506832
[5]. A. Cohen, “Hidden Markov models in biomedical signal processing,”in Proc. Annu. Int. Conf. IEEEEngineering in Medicine and Biologysoc., Hong Kong, 1998.
[6]. D. A. Coast and G. G. Cano, “QRS detection based on hidden markov modeling,” in Proc. Annu. Int. Conf. IEEE Engineering in Medicine and Biology Soc., Seattle, WA, 1989.
[7]. C. Li, C. Zheng, and C. Tai, “Detection of ECG characteristic points using wavelet transforms,” IEEE Trans. Biomed. Eng., vol. 42, no. 1, Jan. 1995.
[8]. R. V. Andreão, B. Dorizzi;, P. C. Cortez, and J. C. M. Mota, “Efficient ECG multilevel wavelet classification through neural network dimensionality reduction,” in Proc. IEEE Workshop on Neural Network for Signal Processing, Martigny, Suisse, 2002, pp. 395–404.
[9]. A.Kadish, “ACC/AHA clinical competence statement on electrocardiography and ambulatory electrocardiography,” J. Am. Coll. Cardiol., vol. 38, no. 7, 2001.
[10].J. L Willems, “Influence of noise on wave boundary recognition by ECG measurement program-ms,” Comput. Biomed. Res., vol. 20, no. 6,pp. 543–562, 1987.
[11].B.-U. Köhler, C. Hening, and R. Orglmeister, “The principles of software QRS detection,” IEEE Engineering in Medicine and Biology Mag., vol. 21, no. 1, 2002.
[12].Jaya prakash sahoo, “Analysis _of_ECG_signal_for _detection_of _cardiac_arrhythmias,” NIT, Rourkela, 2011.
[13].P. Laguna, “A database for evaluation of algorithms for measurement of QT and other waveform intervals in the ECG,” in Proc. Computers in Cardiology, 1997, pp. 673–676.
![fig.5. ECG signal with various conditions can also generate using above tables 1&2 data[] BLOCK DIAGRAM:](https://thumb-us.123doks.com/thumbv2/123dok_us/1459288.1178797/4.595.189.408.459.699/signal-various-conditions-generate-using-tables-block-diagram.webp)