ABSTRACT
KELLEY, CHRISTOPHER MICHAEL. Feedback Support Requirements for Learning a Cognitive Task: The Role of Cognitive Resources and Task Complexity. (Under the direction of Dr. Anne Collins McLaughlin.)
The amount of feedback required to learn a new task has been investigated for decades with mixed results (cf. Schmidt & Bjork, 1992; Van Merrienboer & Sweller, 2005). One possible explanation is the learner’s cognitive resources and demands imposed by the task may determine feedback requirements (McLaughlin, Rogers, & Fisk, 2006). To test this model, a study was conducted that accounted for the learner’s cognitive resources by
comparing samples of populations with known differences, older and younger adults (Horn & Cattell, 1967; Salthouse & Babcock, 1991). To account for task demands, a simple rule-based cue learning task was created. The task required participants to learn how to identify fake Windows popups using two different cues, a visual cue and a verbal cue. Participants used different cognitive abilities to identify the cues. The visual cue required the use of fluid abilities while the verbal cue drew from participants’ crystallized intelligence. Varying levels of feedback support were provided throughout the learning process. Results indicated
Feedback Support Requirements for Learning a Cognitive Task: The Role of Cognitive Resources and Task Complexity
by
Christopher Michael Kelley
A thesis submitted to the Graduate Faculty of North Carolina State University
in partial fulfillment of the requirements for the Degree of
Master of Science
Psychology
Raleigh, North Carolina 2010
APPROVED BY:
_______________________________ ______________________________ Dr. C. B. Mayhorn Dr. S. D. Neupert
________________________________ Dr. A. C. McLaughlin
ii
BIOGRAPHY
Christopher M. Kelley was born in San Diego, CA on September 11, 1982. His family moved to Garner, NC in March of 1998 where he lived until finished with his last two years of high school. After a year of attending East Carolina University, he transferred to Appalachian State University where he graduated in 2005 with a Bachelor of Science in Business Administration – Computer Information Systems.
iii
ACKNOWLEDGMENTS
I would like to thank my advisor, Dr. Anne McLaughlin, for her guidance, support, and providing me with the tools necessary to complete this thesis. I would also like to thank my committee members, Dr. Christopher Mayhorn and Dr. Shevaun Neupert, for their help and guidance along the way.
iv
TABLE OF CONTENTS
LIST OF TABLES ... vi
LIST OF FIGURES ... vii
INTRODUCTION ...1
Literature Review...3
Feedback Characteristics ...3
Task Complexity ...4
Learner Characteristics ...5
Historical Development of Feedback Theory ...6
Interim Summary ...10
Age Related Decline of Cognitive Abilities ...12
Feedback Research with Older Adults ...13
Feedback Research with Simple Tasks ...14
Feedback Research with Complex Tasks ...16
Study Objectives ...19
Hypothesis...20
Predicted Pattern of Results ...20
METHOD ...20
Participants ...20
Experimental Task ...27
Feedback Conditions ...29
Learning Stages ...30
Materials ...33
Design ...33
Procedure ...33
RESULTS ...36
Interim Summary ...36
Transfer Test ...38
Interim Summary ...38
Analysis by Cue ...40
Post Hoc Analysis for Cue ...44
Exit Interview ...51
DISCUSSION ...54
Limitations of the Current Experiment ...60
Future Research ...60
Application ...62
v
APPENDICIES ...69
Appendix A. Consent Form ...70
Appendix B. Technology and Computer Experience Questionnaire ...73
Appendix C. Instructions ...77
vi
LIST OF TABLES
Table 1. Participant Characteristics divided by Feedback Condition and
Age ...24 Table 2. Multivariate Analysis of Variance for Ability tests on Feedback
and Age ...26 Table 3. Icons used for Cue 1 - Color Condition ...28 Table 5. Repeated Measures Analysis of Variance for Cue divided by
Feedback and Age ...41 Table 6. Younger Adults Summary of Repeated Measures Analysis of
Variance for Cue divided by Feedback ...50 Table 7. Older Adults Summary of Repeated Measures Analysis of
vii
LIST OF FIGURES
Figure 1. Feedback research results recategorized by cognitive resources
and task complexity. ...9
Figure 2. Feedback support requirements as a function of task complexity and cognitive resources. ...11
Figure 3. Expected interactions of feedback support and age. ...21
Figure 4. Example of lower feedback support. ...29
Figure 5. Example of higher feedback support. ...30
Figure 6. Example of far transfer test visual stimuli. ...32
Figure 7. Example of far transfer test verbal stimuli. ...32
Figure 10. Accuracy divided by Feedback, Cue and Age where younger adults benefited from increased feedback while older adults’ accuracy was higher with less feedback for the Verbal Cue and more feedback for the Visual Cue. ...42
Figure 11. Accuracy by Cue and Feedback where more feedback support was beneficial for the Visual Cue and less feedback support for the Verbal Cue. ...42
Figure 12. Accuracy divided by age group where younger adults increased their accuracy more from acquisition to retention than older adults. ...43
Figure 13. Accuracy divided by cue and age group where older adults’ accuracy was higher for the Verbal Cue was than their accuracy for the Visual Cue. ...44
viii
Figure 15. Verbal Cue Accuracy divided by Feedback and Age where more feedback support benefited younger adults and less
feedback support benefited older adults. ...46 Figure 16. Older adult accuracy divided by Cue and Feedback where
higher feedback support was resulted in higher accuracy for the Visual Cue while lower feedback support was beneficial for
the Verbal Cue. ...50 Figure 17. Older adult accuracy divided by Cue where accuracy
increased from acquisition to retention for the Verbal Cue
1
INTRODUCTION
Despite 100 yrs of research the amount of feedback that should be given during training or learning is still disputed by researchers (see Schmidt & Bjork, 1992), but most would agree some amount of feedback is required (see McLaughlin, 2007 for a review). Feedback can be defined as information from an external source about performance (Kluger & Denisi, 1996). Studies have traditionally looked at feedback in terms of “more” or “less” information. However, these terms have been used ambiguously and inconsistently. For the purpose of this manuscript, more or less feedback will be defined as providing more or less support, or specific guidance, to the learner during acquisition (McLaughlin, 2007). The results of feedback research are split into two categories; one category contends less feedback facilitates more learning, while the other says more feedback should be provided (cf. Schmidt & Bjork, 1992; Sweller, 1988).
One hypothesis for the mixed findings of feedback research is that feedback support is a function of the available cognitive resources of the learner (McLaughlin, 2007;
2
According to the Administration on Aging (2007), the number of persons 65 years or older will number approximately 71.5 million by the year 2030 and represent roughly 20% of the U.S. population. It is imperative to understand how age-related declines in cognitive resources, such as working memory capacity, affect older adults’ ability to learn new tasks (Salthouse & Babcock, 1991).
3
Literature Review
Feedback Characteristics
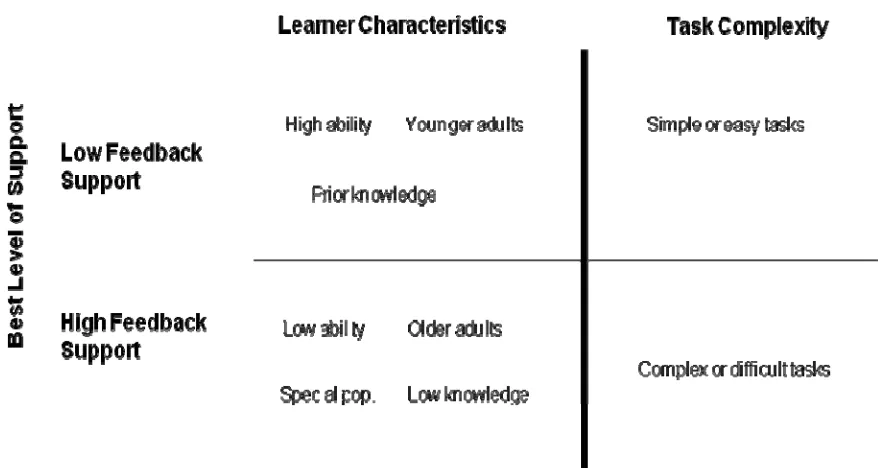
A number of feedback variables will be referred to in this manuscript including content, frequency and complexity. Previous research results on each variable is mixed, prompting the variables be recategorized by the amount of support offered to the learner (McLaughlin, 2007). This helped to reorganize the research literature. When looked at in terms of providing more or less support to the learner, studies finding less feedback support beneficial generally used high ability learners, young adults, or were simple tasks. Support is the amount of guidance provided to the learner. Conversely, those studies finding more feedback support beneficial generally used remedial students, older adults, or complex tasks.
4
number of words contained in both feedback presentations was nearly identical, the amount of direction provided to the learner was different. Information contained in the directive feedback provided more support because it offered the correct answer, while the nondirective feedback offered less support because it only indicated a mistake had been made. Results indicated participants that received less feedback support during acquisition made fewer mistakes in retention and spent less time on the task.
Feedback frequency studies have looked at feedback in terms of the number of times feedback was provided (e.g. every trial vs. every five trials) (Butki & Hoffman, 2003; Park, Shea, & Wright, 2000; Winstein & Schmidt, 1990). For example, a study may provide feedback on 100%, 75%, 50% or 25% of trials respectively. Providing in frequent feedback offers less support to the learner as no knowledge of whether the answer is correct or
incorrect has been given on trials with no feedback.
Task Complexity
Task complexity has been hypothesized and shown to contribute to feedback requirements (McLaughlin et al., 2006; Wulf, Shea, & Matschiner, 1998), however,
5
dynamic task complexity refers to whether or not the individual will have to adapt their actions based on changes occurring within the task itself. As can be seen from Wood’s (1986) definition, task complexity consists of many factors, and therefore can result in different degrees of complexity. In addition, it stands to reason that individual differences, such as cognitive resources, likely interact task complexity.
Learner Characteristics
6
exploration (less support). Results indicated novices provided with worked examples (more support) performed significantly better on a retention test. Results of the study indicated the best way to guide a learner was through a reduction of cognitive load by providing more support in the form of worked examples. As can be seen from the above example, cognitive load theory does not deal with feedback support per se, but rather the learning process. Nonetheless, feedback support can be used to reduce the cognitive load in ways similar to the worked examples above resulting in more cognitive resources remaining for learning.
Historical Development of Feedback Theory
Feedback support was originally studied in the animal-learning domain in a stimulus-response paradigm (Thorndike, 1911). The law of effect states that positive reinforcement generally leads to improved performance (Thorndike, 1911). This idea is closely related to the theory of operant conditioning that proposes behavior increases if followed by positive reinforcement and decrease if followed by punishment (Skinner, 1953). Therefore, the learner should be provided with positive reinforcement to support performance (Thorndike, 1911). This theory dominated the scientific community most of the 20th century; however, Salmoni, Schmidt, and Walter, (1984) outlined a distinction between learning and
7
Learning can be defined as a permanent change in the ability of an individual (Brosvic, Dihoff, Epstein, & Cook, 2006; McLaughlin, 2007; Salmoni et al., 1984; Schmidt & Bjork, 1992), while performance can be viewed as temporary transient effects, or what an individual does in an activity (Salmoni et al., 1984; Schmidt & Bjork, 1992). Therefore, in order to measure learning, one must administer a retention test after a period of time to ensure the effects of training are gone (Schmidt & Bjork, 1992). A transfer test of a similar concept, but not the same as the trained activity, is also acceptable. Consequently, retention tests should be administered without feedback present, or in some reduced form. This will ensure the change in the individual is relatively permanent, and a result of learning.
After the distinction between learning and performance had been made, Salmoni et al. (1984) proposed that feedback should be used to guide the learner in the acquisition phase of learning. According to the guidance hypothesis, feedback support is used as motivation to complete the task and to guide the learner in acquisition; however, providing too much feedback support results in the learner becoming dependent on feedback and poor
8
after either every trial (most support), 5 trials, 10 trials or 15 trials (least support). The results indicated participants provided with less support (every 15 trials) performed better on a delayed no-knowledge of results (KR) transfer test than those provided with more support.
Depth of processing is another potential reason for why less feedback support in acquisition is beneficial for learning (Craik & Lockhart, 1973). Schmidt and Bjork (1992) stated acquisition performance was an imperfect predictor of retention performance. Previous research had shown practice and feedback support conditions that make it more difficult for the learner may facilitate retention and application of concepts to similar tasks (see Schmidt & Bjork, 1992). Schmidt and Bjork (1992) hypothesized that creating this challenge point, or “desirable difficulties,” required the learner to engage in processing activities needed for retention (Guadagnoli & Dornier, 1996). This results in the learner practicing the retrieval of information during acquisition which should result in increased retention. For example, Winstein and Schmidt (1990) examined the effect of feedback support presented to participants in learning a motor task. They provided participants with feedback every trial (more support) or every other trial (less support). Results indicated participants who were provided with feedback on every other trial (less support) performed better on a retention test.
9
remains as to the best way to guide a learner in acquisition. It has been hypothesized the answer depends on the cognitive resources, or individual differences, of the learner (McLaughlin, 2007).
McLaughlin et al. (2006) proposed a framework in which feedback support
requirements were contingent upon learner resources and task demands. After a review of feedback literature (see Figure 1) McLaughlin et al. (2006) concluded studies finding less feedback support to be more effective were generally simple tasks, and those finding more
10
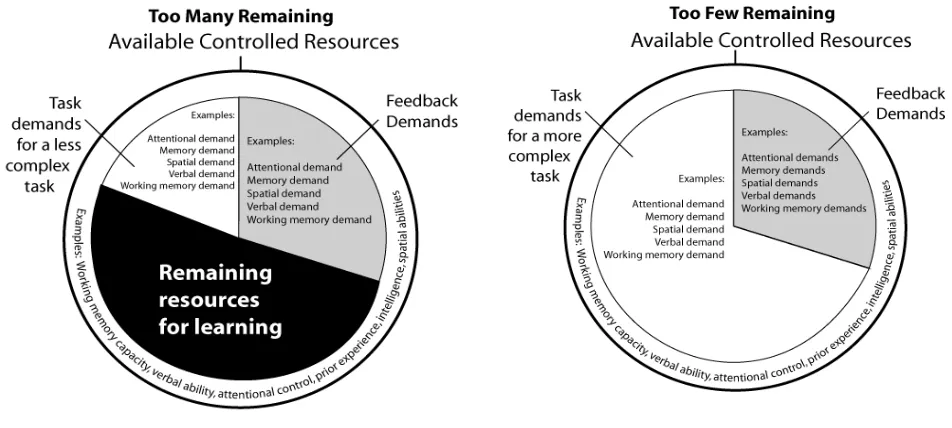
feedback support to be effective were either complex tasks or had participants with a reduced cognitive capacity (e.g. older adults, remedial students). In the proposed framework a learner is seen to have limited cognitive resources and the use of feedback support can be resource intensive. Thus, as shown in Figure 2, if a task is complex requiring a high amount of resources and utilization of feedback also requires a high amount of resources, few resources remain for learning. Therefore, feedback support that does not consume resources should be provided to reduce the cognitive load imposed by the task. However, providing too much feedback support could impede learning due to few resources remaining for learning the task.
McLaughlin (2007) tested the framework through the use of complex and simple tasks while controlling for working memory capacity (cognitive resources). The results indicated those provided with more feedback support, regardless of working memory capacity, performed better than those provided with less feedback performed better in acquisition and retention/transfer tests. However, the simple version of the task may not have been simple enough to fully test the framework. For complex tasks, both groups should benefit from increased feedback support, which occurred.
Interim Summary
11
learner in acquisition. Feedback support could motivate and guide learning, (Salmoni et al., 1984), free cognitive resources for learning, (Sweller, 1988), or inhibit learning due to a reduction in processing depth (Schmidt & Bjork, 1992). McLaughlin et al. (2006) attempted to bring all the theories together by theorizing feedback support requirements were
contingent upon cognitive resources and task demands, but failed to find a benefit for reduced support in a simple cognitive task. Thus, the question of individual differences remains: do groups with different cognitive resources benefit from different amounts of feedback support. One population that tends to exhibit decreased cognitive resources is older adults.
12
Age Related Decline of Cognitive Abilities
Age-related differences in fluid abilities, working memory, and processing-speed are well documented in the cognitive aging research literature (Craik & Salthouse, 2000; Horn & Cattell, 1967; Salthouse, 1990, 1996; Salthouse & Babcock, 1991). However, it is not clear how a decline in these cognitive resources affects the learning process or how appropriate feedback can help attenuate these deficits.
13
Feedback Research with Older Adults
Feedback research with older adults shows mixed results as to the amount of support that should be provided to the learner. For example, a pilot study conducted by Wishart et al. (2002) investigated age-related differences with visual feedback support in the learning of a bimanual coordination patterns. The task consisted of participants, young and old, moving their upper limbs from side to side in front of their body. Participants performed 45, 15s trials per day over three consecutive days. Feedback support was provided after every fifth trial to both age-groups in the form of a spatial display of performance about the last trial completed. Retention tests were given one week and one month following the last acquisition session and consisted of two trials with no feedback.
The results indicated older adults were not able to learn the bimanual coordination pattern when feedback support was given after every fifth trial (low support) while younger adults were able to learn the task under this condition. These results are consistent with the resource framework presented earlier by McLaughlin et al. (2006). According to the framework, older should benefit from increased feedback support while younger adults decreased feedback support.
14
In a subsequent study, Wishart et al. (2002) used the same task and gave participants feedback at the end of every trial versus feedback at the end of every trial and as the trial was occurring. Acquisition consisted of 35, 20s practice trials each for three consecutive days. Concurrent feedback was provided in the form of a visual representation of real-time performance. Retention tests were one week after the last acquisition trial and consisted of 10, 20s trials with no feedback. Older adults given concurrent feedback and end of trial feedback had significantly less variability than older adults given end of trial feedback only.
While there were no significant mean differences in performance between feedback groups, these results are important because there were differences in variability between feedback support groups for older adults, but not younger adults. That is, older adults receiving high feedback support (concurrent and end of trial feedback) performed more consistently in retention than older adults who received less feedback. This suggests that older adults receiving high feedback support may have learned the task better than older adults receiving lower feedback support. Populations with reduced cognitive resources (remedial students) benefited from higher amounts of feedback support (Dihoff, Brosvic, Epstein, & Cook, 2005). This finding supports the framework presented by McLaughlin et al. (2006) that predicts older adults need more feedback support.
Feedback Research with Simple Tasks
15
and forth through two zones as close to a predetermined time (550ms) as possible. Participants were given feedback after every trial (most support), 5 trials, 10 trials, or 15 trials (least support). Feedback was provided in terms of a visual graph with the difference between actual performance versus goal performance (i.e. +/- 13 ms) for each trial plotted. For example, if a participant was supposed to receive feedback after every five trials, then after the fifth trial they would be shown a graph with the performance for trials one through five. The difference between feedback conditions was when feedback was received
(immediate versus delayed). Participants completed 90 trials with feedback, followed by a 10 minute rest after which they completed an additional 15 trials with no feedback. A retention test was administered two days later and consisted of 25 trials with no feedback. Retention results revealed a significant effect of feedback. Specifically, those that received feedback every fifteen trials performed best followed by those who received feedback every ten trials, five trials and every trial respectively.
The results obtained by Schmidt et al. (1989) provided evidence that less feedback support can increase retention for simple tasks. This is consistent with the framework presented by McLaughlin et al. (2006) that predicted a simple task required less feedback support and confirms the idea task complexity may determine feedback support
16
Feedback Research with Complex Tasks
Wulf et al. (1998) investigated the role of feedback support in the learning of a complex motor skill. The task consisted of a ski simulator in which the participants were required to make oscillatory movements with as large an amplitude as possible. Feedback support was provided concurrently during the trial via an oscilloscope. Participants were randomly assigned to receive high feedback support (100% of the time), low support (50% of the time), or to a control group (no feedback). The 50% feedback support group received faded feedback, or feedback that is gradually withdrawn, in which 60% of the trials on day 1 were provided with feedback support and 40% on the second day. Acquisition consisted of 10, 90s trials for two consecutive days. Retention was measured on the third consecutive day via a 10 trial retention test with no feedback support. Dependent variables were amplitude, frequency and relative force onset.
For amplitude in acquisition, main effects were found for both trial and day for
17
In retention, the only main effect found was for trial, indicating participants performed better as the number of trials increased. For frequency in retention, no main effects or interactions were significant. For relative force onset, a significant interaction of Group x Trial was found. Specifically, the 100% feedback support group’s performance increased across retention, the 50% feedback support group’s performance did not change and the control group’s performance deteriorated across retention. Post hoc analysis
indicated the 100% feedback support group had significantly better performance at the end of retention than the control group.
18
McKendree (1990) investigated the role of feedback support in tutoring complex math skills. The task required participants to complete geometry proofs in the fewest possible steps. Feedback support consisted of four conditions: whether or not the step was correct (minimal), an explanation as to why the answer is incorrect (condition violation), the correct answer (goal), or the information contained in both the condition violation and goal conditions (combined). Acquisition took place over three days. On the first day participants completed a 14 trial pretest. The pretest results were used as a covariate in the final analysis. Over the next 2 days participants completed 30 proofs. Retention was followed on the fourth day with the completion of 11 proofs. The dependent variable was errors. It was
hypothesized some form of feedback would be more conducive to learning than no feedback, so the results of all feedback groups were collapsed and compared to the minimal (or lowest) feedback group. Acquisition results indicated participants who received minimal feedback performed worse than those who received more feedback. Retention results also showed the participants receiving minimal feedback performed worse than those who received the other forms of feedback. Contrasts showed a significant difference between the minimal group and goal group, and a marginally significant difference between the minimal group and combined group.
McKendree’s (1990) study gives support to the notion that a complex cognitive task requires high amounts of feedback support. The study showed that performance in
19
While all of the reviewed literature attempts to add to the feedback requirements framework, confounding results continue to occur, likely due to the lack of focus and measurement of cognitive resources of the learners and the complexity of the task. These mixed results suggest cognitive resources and task complexity may be a determinant of the feedback support required to learn a new task. What remains unclear is the spectrum in which a task becomes complex enough or how limited the cognitive resources of the individual need to be, to require high amounts of feedback support.
Study Objectives
The present research added to the theoretical contributions of feedback support research by testing the hypothesis that feedback support depended on resources available to the learner. There is evidence that older adults require more feedback support in learning a new task (Wishart et al., 2002), however, the topic has not been systematically investigated as it relates to available learner resources and task complexity in general.
20
Hypothesis
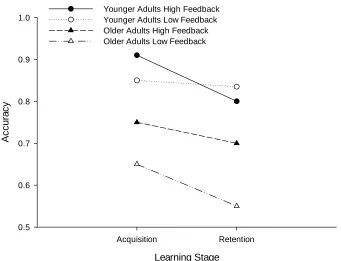
Predicted Pattern of Results
As shown in Figure 3, age was predicted to interact with feedback support level, where older adults would require more support than younger adults. In addition, younger adults should have learned more with less support compared to younger adults given more feedback support in acquisition.
METHOD
The experiment explored the potential interaction between feedback support, cognitive resources and task demand on learning a new task. Participants were grouped according to feedback support, low or high, and age group, younger and older. Participants completed several ability tests followed by 80-trials of practice on a simple cognitive task under differing levels of feedback specificity. They returned 4 days later and complete a 60 trial retention test. Acquisition performance and retention performance were measured as the mean number of correct and incorrect responses.
Participants
21
Learning Stage
Acquisition Retention
A
ccu
ra
cy
0.5 0.6 0.7 0.8 0.9 1.0
Younger Adults High Feedback Younger Adults Low Feedback Older Adults High Feedback Older Adults Low Feedback
ranged in age from 18 to 28 (M = 21.33, SD = 2.71) and were paid $35.00 for their participation. Older adults were recruited from around the Raleigh community and paid $40.00 for their participation. Older adults were paid more because it was expected it would take them longer to complete the study. They ranged in age from to 65 to 77 (M = 69.32, SD = 3.14). Age 65 is considered an acceptable minimum age in which age-related research can be conducted (Salvendy, 2006).
22
Excluded participants. Attrition rates for younger adults was approximately 30%,
while only 1 older adult could not attend session 2. If attrition rates were due to the difficulty of the task we would expect the rates for older adults to be higher than younger adults’. Therefore, we can conclude that in general attrition rates were not related to the task, but to some other circumstance that affected younger adults more. Ten additional participants’ data was excluded due to incomplete, missing or corrupt data, and 3 older adults were excluded from the final analysis because they were outside the specified age range.
Ability tests. Participants completed the following ability tests: Digit Symbol
23
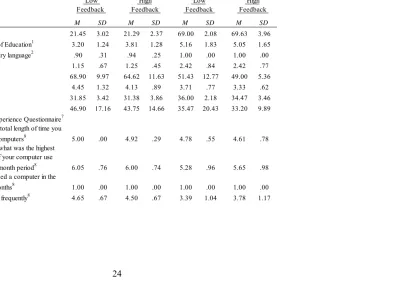
Questionnaires. We also included a demographics form, a technology experience
questionnaire and an exit interview (Table 1). The technology experience questionnaire consisted of some general questions designed to assess the participant’s previous experience with technology and computers (see Appendix B). A multivariate analysis of variance was conducted to investigate the differences of participants’ response on the technology
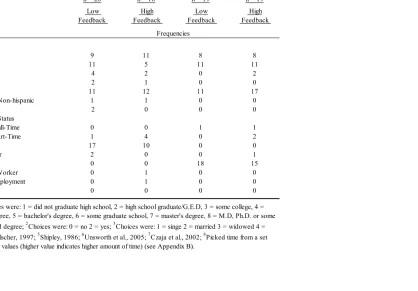
24 Table 1
M SD M SD M SD M SD
Age 21.45 3.02 21.29 2.37 69.00 2.08 69.63 3.96
Highest Level of Education1 3.20 1.24 3.81 1.28 5.16 1.83 5.05 1.65 English is primary language2 .90 .31 .94 .25 1.00 .00 1.00 .00
Marital Status3 1.15 .67 1.25 .45 2.42 .84 2.42 .77
DSS4 68.90 9.97 64.62 11.63 51.43 12.77 49.00 5.36
RDS4 4.45 1.32 4.13 .89 3.71 .77 3.33 .62
Shipley5 31.85 3.42 31.38 3.86 36.00 2.18 34.47 3.46
Ospan6 46.90 17.16 43.75 14.66 35.47 20.43 33.20 9.89
Technology Experience Questionnaire7 Indicate the total length of time you
have used computers8 5.00 .00 4.92 .29 4.78 .55 4.61 .78
In the past, what was the highest frequency of your computer use
over any 3-month period8 6.05 .76 6.00 .74 5.28 .96 5.65 .98 Have you used a computer in the
last three months8 1.00 .00 1.00 .00 1.00 .00 1.00 .00
If yes how frequently8 4.65 .67 4.50 .67 3.39 1.04 3.78 1.17 Participant Characteristics divided by Feedback Condition and Age
Young Adults Older Adults
n = 20 n = 16 n = 19 n = 19
Low Feedback
High Feedback
Low Feedback
25
Table 1 (continued)
Gender Male Female Race Black Asian Caucasian/Non-hispanic Multi-racial Occupational Status Working Full-Time Working Part-Time Student Homemaker Retired Volunteer Worker Seeking Employment
Other 0 0 0 0
0 1 0 0
0 1 0 0
2 0 0 1
0 0 18 15
1 4 0 2
17 10 0 0
2 0 0 0
0 0 1 1
11 12 11 17
1 1 0 0
4 2 0 2
2 1 0 0
8
n = 19 High Feedback
8 Frequencies
n = 19 Low Feedback
9
n = 16 High Feedback
11 n = 20
Low Feedback
Young Adults Older Adults
11 5 11 11
26
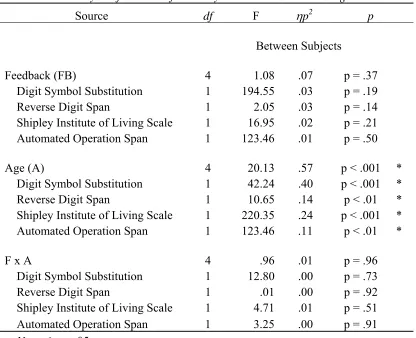
Table 2
Multivariate Analysis of Variance for Ability tests on Feedback and Age
Source df F
p2
p
Between Subjects
Feedback (FB) 4 1.08 .07 p = .37
Digit Symbol Substitution 1 194.55 .03 p = .19
Reverse Digit Span 1 2.05 .03 p = .14
Shipley Institute of Living Scale 1 16.95 .02 p = .21
Automated Operation Span 1 123.46 .01 p = .50
Age (A) 4 20.13 .57 p < .001 *
Digit Symbol Substitution 1 42.24 .40 p < .001 * Reverse Digit Span 1 10.65 .14 p < .01 * Shipley Institute of Living Scale 1 220.35 .24 p < .001 * Automated Operation Span 1 123.46 .11 p < .01 *
F x A 4 .96 .01 p = .96
Digit Symbol Substitution 1 12.80 .00 p = .73
Reverse Digit Span 1 .01 .00 p = .92
Shipley Institute of Living Scale 1 4.71 .01 p = .51
Automated Operation Span 1 3.25 .00 p = .91
27
Experimental Task
The study was presented as an exercise in learning how to identify legitimate
Windows pop-ups from fake pop-ups that install malicious software. Participants were told their task was to decide whether a given popup was legitimate, generated by Windows, or fake, created by a virus. The correct decision was based on cues the participant learned in the study. There were two cues participants tried to learn in the experiment.
Visual cue. As shown in Table 3, one of the cues the participant had to learn was
associated with the color of the icon contained in the pop-up and therefore required the use of participants’ fluid abilities such as pattern recognition and memory. In the fake pop-up, the color of the icon had been changed from its original color to a different color. For example, in one of the pop-ups the color of the icon was changed from yellow to red. Two real icons and 2 fake icons were provided. Ten distinct messages were created and used in the pop-ups with each message being used twice, once in the real pop-up and once in the fake pop-up.
Verbal cue. The other cue the participants had to learn was associated with the
28
version of the real pop-up was then created utilizing one of the above errors and used for the fake pop-ups.
Table 3
Icons used for Cue 1 - Color Condition
Task difficulty. The task used in the study was designed to be simple. The
29
Feedback Conditions
Lower support. As shown in Figure 4, in the low feedback support condition,
participants were simply told whether their answer was correct or incorrect. The lower feedback support condition was similar to knowledge of results conditions in previous feedback studies. In this condition participants had to determine why their answer was correct or incorrect.
Higher support. As shown in Figure 5, in the higher feedback support condition,
participants received the same information given in the low feedback support condition as well as information regarding why their answer was correct or incorrect.
30
Learning Stages
Acquisition. Acquisition occurred over an 80 trial practice task. Participants were
randomly assigned to one of two levels of feedback specificity (lower or higher). They were informed their goal was to learn the cues behind identifying real and fake pop-ups.
31
Retention. Participants returned four days later and completed a 40 trial retention
test. This ensured learning was being measured and not performance (Salmoni, et al., 1984). Participants received no feedback support during the retention test.
Transfer
Immediately following the retention test, participants completed a 40 trial transfer test. The transfer test was designed to investigate how participants applied the knowledge learned in acquisition to similar concepts.
Near transfer. The near transfer test consisted of stimuli comparable to those used
in acquisition. For the Visual Cue, the icons were similar to those in Table 3; however, the color of the fake icons was different. For the Verbal Cue, the format of the text was the same, but new text was created.
Far transfer. The far transfer test consisted of stimuli that required the participant to
apply the concepts learned in acquisition to different contexts and situations. In addition, the stimuli were not limited to popups. Visual and grammatical elements appeared in different locations and mediums than those used in acquisition. For example, one stimuli tested visual elements using a popup that did not look like the Windows generated popus used in
33
Materials
Equipment. The experimental task was performed on IBM-compatible computers
(1.80 GHz Pentium Dual-Core, 1.96 GM RAM). Screen size was 19” with a resolution of 1280 x 1024 pixels and a refresh rate of 60 Hz.
Instructions. Participants received on screen instructions describing the task (see
Appendix A). They were told to try and learn the cues behind identifying real and fake pop-ups.
Design
The study was a 2 (feedback support: lower and higher) x 2 (age: young or older) design. Feedback support and age were between-participant factors. The primary dependent variables were acquisition performance, retention test performance and transfer test
performance. In order to examine if there was a speed-accuracy tradeoff between younger and older adults, participant’s response time was also measured. The main acquisition and retention measure was accuracy, defined as the average number of correct and incorrect responses to a question.
Procedure
Acquisition. Participants were randomly assigned to one of two feedback support
34
feedback support condition. Attrition rates and the exclusion of other participants resulted in unequal feedback support conditions.
When participants arrived they were given two informed consent forms (Appendix A). They were instructed one copy was for them to keep. The experimenter then went over the form orally after which participants signed a copy and returned it to the experimenter. After all the consent forms were collected participants completed a technology experience questionnaire (Appendix B) designed to gather general information on computer use and technology experience (see Table 1 for means) (Czaja, Sharit, Charness, Fisk, & Rogers, 2001), followed by digit symbol substitution ability test, and the reverse digit span ability test (Wechsler, 1997). Following the reverse digit span, participants completed the experimental task. Once finished they completed the Shipley Institute of Living Scale ability test (Shipley, 1986; Unsworth, et al., 2005) and scheduled a retention test time.
Retention. Participants returned four days after acquisition and completed a sixty
trial retention task with no feedback support. As they arrived for the retention session they completed a near vision test. When finished with the retention and transfer test participants completed an exit interview followed immediately by the Aospan (Unsworth, Heitz, Schrock, & Engle, 2005). Participants were then compensated, debriefed, and instructed they could leave.
Counterbalance. Popups were divided by cue and the presentation order alternated
35
effects, F(2, 65) = .80, p = .46, np2 = .02, or interactions of counterbalance. That is, there was no difference in accuracy depending upon which cue participants saw first; therefore, the groups were collapsed for the final analysis.
Data Analyses
A 2 (Learning Stage: Acquisition and Retention) x 2 (Age: Younger and Older) x 2 (Feedback Support: Low and High) repeated measures multivariate analysis of variance (RM-MANOVA) was conducted. Learning Stage was a within-subjects factor while Age and Feedback were between subjects factors.
To analyze transfer test results, a 2 (Age: Younger and Older) x 2 (Feedback Support: Lower and Higher) multivariate analysis of variance (MANOVA) was conducted on near and far transfer accuracy. Age and Feedback were between subjects factors.
Additional analysis. An additional post hoc analysis was performed to examine if
performance on the 2 cues differed between age or feedback conditions. A 2 (Learning Stage: Acquisition and Retention) x 2 (Cue: Color and Grammar/Tone) x 2 (Age: Younger and Older) x 2 (Feedback Support: Low and High) RM-ANOVA was conducted on the primary dependent variable of interest: accuracy. Learning Stage and Cue were within-subjects factors while Age and Feedback were between within-subjects factors.
36
RESULTS
Feedback effects and interactions. As expected, the main effect of Feedback was
significant, F(2, 69) =3.84, p = .03, np2 = .10, where participants that received high feedback support were more accurate than those who received low feedback support, F(1, 70) = 5.49, p = .02, np2 = .07 (see Table 4 for descriptives).
Age effects and interactions. There was a main effect of Age, F(2, 69) = 44.57, p <
.001, np2 = .56, where younger adults were more accurate, F(1, 70) = 73.52, p < .001, np2 = .51, and responded faster, F(1, 70) = 38.68, p < .001, np2 = .36, than older adults.
Other effects and interactions. There was a main effect of Learning Stage, F(2, 69)
= 13.72, p < .001, np2 = .29, with retention accuracy higher than acquisition accuracy, F(1, 70) = 20.80, p < .001, np2 = .23, and acquisition response time faster than retention response time, F(1, 70) = 21.42, p = .01, np2 = .09.
Interim Summary
37 Table 4
Descriptives for Overall Learning Stage Accuracy and Individual Cue Accuracy divided by Age and Feedback
Young Adults Older Adults
n = 20 n = 16 n = 19 n = 19
Less Feedback
More Feedback
Less Feedback
More Feedback
M SD M SD M SD M SD
Overall Acquisition .75 .11 .80 .11 .61 .07 .63 .10
Cue 1 .73 .15 .80 .13 .55 .08 .65 .14
Cue 2 .76 .15 .81 .14 .68 .13 .60 .13
Overall Retention .82 .14 .90 .08 .62 .10 .67 .11
Cue 1 .83 .20 .88 .12 .51 .14 .67 .11
Cue 2 .81 .15 .92 .10 .73 .13 .68 .13
Transfer
Near Transfer .77 .11 .82 .11 .63 .14 .65 .16
38
Transfer Test
There was a main effect of Age, F(2, 69) = 19.34, p < .05, np2 = .37, where younger adults had higher accuracy than older adults . Univariate between subjects tests showed younger adults had higher accuracy for both near transfer, F(1, 70) = 26.88, p < .05, np2 = .28, and far transfer, F(1, 70) = 24.04, p < .05, np2 = .26 (Figure 9).
Interim Summary
There was a main effect of age where younger adults were more accurate than older adults on both transfer tests. Near transfer test results were in the expected direction where participants that received higher feedback support were more accurate than those who received lower feedback support, however, the results failed to reach significance. Far transfer test results showed younger adults that received higher feedback support were more accurate than younger adults that received lower feedback support. Conversely, older adults that received less feedback support were more accurate than older adults that received more feedback support.
39 Learning Stage Acquisition Retention A ccur a cy 0.00 0.60 0.80
1.00 Younger Adults High Feedback
Younger Adults Low Feedback Older Adults High Feedback Older Adults Low Feedback
Figure 8. Accuracy between sessions divided by
Feedback and Age where more feedback support benefited both age groups.
Figure 9. Accuracy for transfer tests divided by
Feedback and Age where more feedback support benefited younger adults in both transfer tests, and more feedback benefited older adults with near transfer while lower feedback benefited far transfer.
Transfer Test
Near Transfer Far Transfer
Acc u ra cy 0.0 0.2 0.4 0.6 0.8 1.0
40
Analysis by Cue
Feedback effects and interactions. As shown in Table 5, there was a main effect of
Feedback, where participants that received high feedback support were more accurate than those that received low feedback support. There was a significant Feedback x Cue
interaction, where for the Visual Cue those who received more feedback support were more accurate than those who received less feedback support (see Figure 10). There was a
significant Feedback x Cue x Age interaction, where younger adults benefited from increased feedback support for both cues, while older were more accurate with higher feedback support with the Visual Cue and lower feedback support with the Verbal Cue (see Figure 11).
Age effects and interactions. There was a main effect of Age, where younger adults
were more accurate than older adults. There was a significant Learning Stage x Age
41 Table 5
Repeated Measures Analysis of Variance for Cue divided by Feedback and Age
Source df F
p2
pBetween Subjects
Feedback (F) 1 5.43 .07 .02
Age (A) 1 73.48 .51 < .001
F x A 1 .83 .01 .37
Error 70
Within subjects
Cue (C) 1 7.63 .10 .01
Learning Stage (L) 1 20.86 .23 < .001
C x A 1 4.15 .06 .05
C x F 1 7.35 .10 .01
C x A x F 1 10.60 .13 < .01
L x A 1 5.34 .07 .02
L x F 1 1.41 .02 .24
L x A x F 1 .05 .00 .82
C x L 1 1.28 .02 .26
C x L x A 1 2.90 .04 .09
C x L x F 1 .22 .00 .33
C x L x A x F 1 .97 .01 .33
42
Cue
Visual Cue Verbal Cue
Ac curac y 0.0 0.2 0.4 0.6 0.8 Less Feedback More Feedback
Figure 10. Accuracy by Cue and Feedback where more
feedback support was beneficial for the Visual Cue and less feedback support for the Verbal Cue.
Cue
Visual Cue Verbal Cue
Ac curac y 0.0 0.2 0.4 0.6 0.8 1.0
Younger Adults - Less Feedback Younger Adults - More Feedback Older Adults - Less Feedback Older Adults - More Feedback
Figure 10. Accuracy divided by Feedback, Cue and
43
Learning Stage
Acquisition Retention
Ac
cur
a
cy
0.0 0.2 0.4 0.6 0.8 1.0
Younger Adults Older Adults
Cue effects and interactions. There was a main effect of Cue where accuracy for
the Verbal Cue was higher than accuracy for the Visual Cue. There was a marginal interaction of Cue x Age where older adults’ accuracy was higher for the Verbal Cue compared to the Visual Cue while younger adults accuracy for both cues was comparable (see Figure 13).
44
Age Group
Younger Adults Older Adults
Ac
cur
a
cy
0.0 0.2 0.4 0.6 0.8 1.0
Visual Cue Verbal Cue
Other effects. There was a main effect of Learning Stage, where retention accuracy
was higher than acquisition accuracy.
Post Hoc Analysis for Cue
As shown in Figures 14 and 15, after performing the main analysis it became clear performance differed between cue by feedback and age groups. To better understand these differences a 2 (Learning Stage: Acquisition and Retention) x 2 (Cue: Visual and Verbal) x 2
45
(Feedback Support: Low and High) RM-ANOVA was conducted on the dependent variable of accuracy for each age group. That is, participants were only compared to their age group. Learning Stage and Cue were within-subjects factors while feedback was a between-subjects factor.
Figure 13. Visual Cue Accuracy divided by Feedback and Age where more feedback support benefited both age groups.
Learning Stage
Acquisition Retention
A
c
c
u
racy
0.5 0.6 0.7 0.8 0.9
46
Younger adults. As shown in Table 6, there was a main effect of feedback where
participants that received higher feedback support were more accurate than those that received lower feedback support. There was also a main effect of Learning Stage, where participants were more accurate in retention than acquisition.
Figure 14. Verbal Cue Accuracy divided by Feedback and Age where more feedback support benefited younger adults and less feedback support benefited older adults.
Learning Stage
Acquisition Retention
Acc
u
racy
0.0 0.6 0.8
47
Older adults. As shown in Table 7, there was a main effect of cue, where accuracy
of the Verbal Cue was higher than the Visual Cue. There was a main effect of Learning Stage, where retention accuracy was higher than acquisition accuracy. There was a significant Cue x Feedback interaction where participants benefited from higher feedback support with the Visual Cue, but lower feedback support with Verbal Cue (see Figure 16). There was a significant Cue x Learning Stage interaction where accuracy for the Verbal Cue increased from acquisition to retention while accuracy for the Visual Cue decreased (see Figure 17).
Interim Summary
Analysis by Cue revealed younger adults were more accurate than older adults. Participants that received more feedback support were more accurate than those who
received less feedback support. For the Visual Cue, participants that received more feedback support were more accurate than those who received less feedback support. Results also showed more feedback support benefited younger adults for both cues, while older adults found more feedback support advantageous for the Visual Cue, but less feedback support for the Verbal Cue. Accuracy for the Verbal Cue was higher than accuracy for the Visual Cue, and older adults accuracy was marginally higher for the Verbal Cue compared to the Visual Cue while younger adults accuracy for both cues were approximately the same.
48
49
Table 6 Table 7
Younger Adults Summary of Repeated Measures Analysis of Variance for Cue divided by Feedback
Older Adults Summary of Repeated Measures Analysis of Variance for Cue divided by Feedback
Source df F
p2
p Source df F
p2
pBetween Subjects Between Subjects
Feedback (F) 1 4.96 .13 .03 Feedback (F) 1 1.07 .03 .31
Error 34 Error 36
Within subjects Within subjects
Cue (C) 1 .26 .01 .62 Cue (C) 1 11.85 .25 < .01
Learning Stage (L) 1 13.52 .29 < .01 Learning Stage (L) 1 7.67 .18 .01
C x F 1 .14 .00 .71 C x F 1 18.33 .34 < .001
L x F 1 .27 .01 .61 L x F 1 3.01 .08 .09
C x L 1 .14 .00 .72 C x L 1 4.92 .12 .03
C x L x F 1 .88 .03 .35 C x L x F 1 .16 .00 .69
50 Cue
Visual Cue Verbal Cue
Acc u ra cy 0.0 0.2 0.4 0.6 0.8 1.0 Low Feedback High Feedback Learning Stage Acquisition Retention Acc u ra cy 0.0 0.6 0.8 1.0 Visual Cue Verbal Cue
Figure 15. Older adult accuracy divided by Cue and
Feedback where higher feedback support was resulted in higher accuracy for the Visual Cue while lower
Figure 16. Older adult accuracy divided by Cue where
51
Exit Interview
At the conclusion of the study participants answered exit interview questions to evaluate their experience in the study (see Appendix D). It contained some general questions about various cues the participant could have learned pertaining to the
experimental task. In addition, we also attempted to ascertain how participants used the feedback they were provided with by asking them a series of open-ended and multiple choice questions. A MANOVA was conducted to investigate participants’ answers to Likert scale questions. Feedback support (low or high) and age groups (younger or older) were between subjects variables.
Age. As shown in Table 8, there was a main effect of age where younger adults were
more confident in their ability to identify fake popups at the beginning and end of the study than older adults. Younger adults also indicated they had more previous experience than older adults that helped them identify fake popups. In addition, younger adults found the feedback they received more useful in learning how to identify fake popups than older adults (see Table 9 for descriptive statistics).
52 Table 8
Multivariate Analysis of Variance for Exit Interview –only Significant Between Subject Effects are Shown
Source df F hp2 p
Between Subjects
Feedback (FB) 8 1.94
.20 .07
Question Number
8. At the end of each trial you were given feedback telling you how to identify real popups from fake popups. The following questions refer to that feedback: B. Using the scale below, indicate how useful the feedback was in learning to
identify fake popups1 1 10.66 .14 < .001
Age (A) 8 7.73 .50 .001
Question Number
5. Indicate your level of confidence in identifying a FAKE popup from a real popup
BEFORE the study2 1 9.12 .12 < .001
6. Indicate your level of confidence in identifying a FAKE popup from a real popup
AFTER the study2 1 51.08 .44 < .001
7. How much did your prior experience with popups help in identifying real and fake
popups3 1 6.22 .09 .01
8. At the end of each trial you were given feedback telling you how to identify real popups from fake popups. The following questions refer to that feedback: B. Using the scale below, indicate how useful the feedback was in learning to
identify fake popups1 1 31.82 .32 < .001
F x A 8 1.92 .20 .07
Note: 1 Rated usefulness on a Likert scale where 0 = not at all useful and 8 = extremely useful;2Rated confidence on a Likert
scale where 0 = no confidence and 8 = extremely confident; 3 Rated helpful on a Likert scale where 0 = not at all helpful and 8
53 Table 9
Means for Exit Interview divided by Feedback and Age
Age Group Feedback Group
Question Number Younger Older Lower Higher
M SD M SD M SD M SD
1. Indicate your level of effort at the start of the study1 5.17 1.80 4.79 1.80 4.85 1.69 5.11 1.92
2. Indicate your level of effort at the end of the study1 5.03 1.48 5.34 1.85 5.15 1.57 2.22 1.82
3. Indicate your level of motivation at the start of the study2 5.50 1.65 5.76 1.50 5.61 1.55 5.66 1.61
4. Indicate your level of motivation at the end of the study2 5.06 2.00 5.02 2.00 4.92 2.00 5.17 2.00
5. Indicate your level of confidence in identifying a FAKE popup
from a real popup BEFORE the study3 3.94 2.10 2.34 2.00 2.92 2.04 3.31 2.34
6. Indicate your level of confidence in identifying a FAKE popup
from a real popup AFTER the study3 4.97 1.72 2.24 1.59 3.26 2.06 3.91 2.20
7. How much did your prior experience with popups help in
identifying real and fake popups4 4.14 2.14 2.64 2.12 3.33 2.14 3.44 2.39
8. At the end of each trial you were given feedback telling you how to identify real popups from fake popups. The following questions refer to that feedback:
B. Using the scale below, indicate how useful the feedback was
in learning to identify fake popups5 5.17 2.24 2.51 2.12 3.11 2.61 4.60 2.25
C. Did you learn the rules of identifying fake popus from the
feedback you were given at the end of each week6 .14 .35 .75 .44 .57 .50 .31 .47
D. Would you tell someone else to pay attention to the information
contained in the feedback7 .14 .35 .44 1.00 .43 .50 .14 .36
9. At any time during the study did you become frustrated because
you didn’t understand what was going on6 .73 .45 .34 .48 .46 .51 .60 .50
Note: 1Rated effort on Likert scale where 0 = no effort and 8 = extreme effort; 2 Rated motivation on Likert scale where 0 = not at all motivated and 8 =
extremely motivated; 3 Rated confidence on Likert scale where 0 = no confidence and 8 = extremely confident; 4 Rated helpful on a Likert scale where 0 =
not at all helpful and 8 = extremely helpful; 5 Rated usefulness on a Likert scale where 0 = not at all useful and 8 = extremely useful; 6 Choices were: 0 =
54
Feedback support. As shown in Table 8, the main effect of Feedback approached
significance where participants who received high feedback support found the feedback they received more useful in identifying fake popups.
Results also showed participants who received higher feedback support were more likely to indicate the feedback they received helped learn the rules behind real and fake popups than those who received lower feedback support. At the conclusion of the study participants who received higher feedback support were more confident in their ability to identify fake popups than those who received lower feedback support. Higher feedback support participants were also more likely to try and memorize the feedback they received, while low feedback support participants were more likely to ignore the feedback they received. Lower feedback support participants indicated they were more likely to tell others to ignore the feedback support given at the end of each trial while higher feedback support participants would tell others to pay attention to the feedback (Table 9).
DISCUSSION
The current experiment explored the idea that feedback requirements depend upon the cognitive resources of the learner. Cognitive resources were controlled for by using
55
simple cognitive task. Feedback support was manipulated by providing learners with one of two distinct feedback levels, low or high. It was expected that feedback support would differentially affect age groups. Specifically, younger adults would learn more with less feedback support and older adults learn more with higher feedback support. Different learning theories predicted different results. If feedback requirements are determined by the cognitive resources of the learner, younger adults should learn more with less feedback support and older adults more feedback support.
Key findings were, participants benefited from increased feedback support. Both feedback groups demonstrated learning; however, those who received higher feedback support learned more than those who received less feedback support and were more
confident in their ability to identify fake popups at the conclusion of the study. Participants who received higher feedback support increased their accuracy from the end of retention to acquisition; the accuracy for participants that received low feedback support remained either flat or declined from the end of acquisition to retention.
56
57
correct or incorrect. Conversely, although increased feedback support benefited younger adults for the Visual Cue, the result was not as profound as for the Verbal Cue. This may have occurred because of younger adults fluid abilities. That is, increased fluid abilities made it easier for younger adults to identify the patterns between correct and incorrect popups and remember, or learn, the difference. This also supports the idea specific cognitive abilities required to learn a task contribute to the consumption of cognitive resources.
58
Conversely, older adults that received less feedback support learned more for the Verbal Cue than those that received more feedback support. This may be because of the cognitive resources required to identify fake popups for this particular cue. Specifically, the Verbal Cue tapped into older adults’ crystallized knowledge. It did not require them to learn anything, per se, but use their past experiences to draw conclusions as to whether a given popup was real or fake. This result supports the idea of desirable difficulties proposed by Schmidt and Bjork (1992). In addition, it also partially supports the model proposed by McLaughlin et al. (2006) that predicts because older adults lower cognitive resources they would learn more with increased feedback support. However, the model fails to account for specific abilities needed to learn a task. Thus, it is possible older adults’ increased
crystallized intelligence led to an increase in cognitive resources available to learn the Verbal Cue resulting in a decrease of task demands. In addition, because of the increased
crystallized intelligence of older adults they may have been the only participants that
59
subsequently reduce learning. As a result, a reduction of germane cognitive load is a
possible explanation as to why high feedback was not beneficial to older adults that received higher feedback support for the verbal cue. Therefore, high feedback may be beneficial only when it does not lower the germane cognitive load of the learner. Consequently, this leads to the conclusion feedback requirements are not only a product of cognitive resources and the complexity of the task, but the experience of the learner as well.
The current pattern of results suggests specific abilities needed to learn a particular task are related to feedback requirements because they influence the demands of the task. That is, a lack of abilities needed to learn a task results in an increase of task demands. If the demands of the task increase enough to sufficiently use the resources needed for learning then feedback support may be used to free these resources. This would explain why older adults benefited more from increased feedback support with the Visual Cue, and younger adults benefited more from increased feedback support with the Verbal Cue.
60
Limitations of the Current Experiment
One limitation of the current experiment is the unequal sample sizes between
feedback and age conditions. This may have resulted in the failure to find an effect that was actually present.
In addition, although participants were asked how useful they considered the
feedback they received to be, it was not specifically manipulated or measured. It’s possible participants that received lower feedback support did not see the benefits of the feedback and therefore ignored it. As a result, it remains unclear as to how and when participants used the feedback they deemed not useful and the effect it had on their accuracy.
Lastly, every attempt was made to design a simple task like those used in previous feedback experiments with motor tasks, however, it’s possible the task used was not simple for all participants. It’s likely that because of their higher crystallized intelligence, older adults received the closest form of a simple task with the verbal cue. Conversely, results suggested the verbal cue may not have been simple for younger adults. This raises the question – is it possible for a cognitive task to be simple for all participants?
Future Research
61
idea specific cognitive abilities and previous experience play a role in feedback requirements should also be explored. Specifically, how do the cognitive abilities of a learner interact with the task to determine feedback requirements? Does a learner with high spatial ability benefit from high feedback support on highly spatial task? It may be learners with high scores on ability tests that are highly correlated with a task require different amounts of feedback than those who score low on the same ability tests.
In addition, there is evidence to suggest the learning process of motor tasks is
different from cognitive tasks (Kelly & Garavan, 2005), although not all agree (Rosenbaum, Carlson, & Gilmore, 2000). Previous research has shown synaptic changes in the brain are different for cognitive tasks and motor tasks (Kelly & Garavan, 2005). That is, both tasks activate different parts of the brain. Therefore, it is reasonable to suspect the cognitive requirements to perform each task may be different. Future research should attempt to identify if feedback support requirements differ between motor and cognitive tasks.
62
Application
63
REFERENCES
Ackerman, P. L. (1988). Determinants of individual differences during skill acquisition: Cognitive abilities and information processing. Journal of Experimental Psychology: General, 117, 288-318.
Ayres, P. (2006). Impact of reducing intrinsic cognitive load on learning in a mathematical domain. Applied Cognitive Psychology, 20(3), 287-298.
Brosvic, G. M., Dihoff, R. E., Epstein, M. L., & Cook, M. L. (2006). Feedback facilitates the acquisition and retention of numerical fact series by elementary school students with mathematics learning disabilities. Psychological Record, 56(1), 35-54.
Butki, B. D., & Hoffman, S. J. (2003). Effects of reducing frequency of intrinsic knowledge of results on the learning of a motor skill. Perceptual and Motor Skills, 97(2), 569-580.
Czaja, S. J., Sharit, J., Charness, N., Fisk, A. D., & Rogers, W. (2001). The Center for Research and Education on Aging and Technology Enhancement (CREATE): A program to enhance technology for older adults. Gerontechnology, 1, 50–59. Craik, F. I. M., & Salthouse, T. A. (Eds.). (2000). The Handbook of Aging and Cognition.
64
Dihoff, R. E., Brosvic, G. M., Epstein, M. L., & Cook, M. J. (2005). Adjunctive role for immediate feedback in the acquisition and retention of mathematical fact series by elementary school students classified with mild mental retardation. Psychological Record, 55(1), 39-66.
Engle, R. W., & Kane, M. J. (2004). Executive attention, working memory capacity, and a two-factor theory of cognitive control. The Psychology of Learning and Motivation, 44, 145-198.
Feldman-Barrett, L., Tugade, M. M., & Engle, R. W. (2004). Individual differences in working memory capacity and dual-process theories of the mind. Psychological Bulletin, 130, 553-573.
Guadagnoli, M. A., & Dornier, L. A. T., R. D. (1996). Optimal length for summary knowledge of results: the influence of task-related experience and complexity. Research Quarterly for Exercise and Sport, 67(2), 239-248.
Guadagnoli, M. A., & Kohl, R. M. (2001). Knowledge of results for motor learning:
Relationship between error estimation and knowledge of results frequency. Journal of Motor Behavior, 33(2), 217-224.
Horn, J., & Cattell, R. B. (1967). Age differences in fluid and crystalized intelligence. Acta Psychologica, 26, 107-129.
65
Kluger, A. N., & Denisi, A. (1996). The effects of feedback interventions on performance: A historical review, a meta-analysis, and a preliminary feedback intervention theory. Psychological Bulletin, 119(2), 254-284.
McKendree, J. (1990). Effective feedback content for tutoring complex skills. Human-Computer Interaction, 5, 381-413.
McLaughlin, A. C. (2007). A controlled resource approach to understanding the effects of feedback on learning. Unpublished Dissertation, Georgia Institute of Technology. McLaughlin, A. C., Rogers, W. A., & Fisk, A. D. (2006). How effective feedback for
training depends on learner resources and task demands. Proceedings of the Human Factors and Ergonomics Society 50th Annual Meeting, 2624-2628.
Morrow, D. G., & Rogers, W. A. (2008). Environmental support: an integrative framework. Human Factors, 50(4), 589-613.
Park, J., Shea, C. H., & Wright, D. L. (2000). Reduced-frequency concurrent and terminal feedback: A test of the guidance hypothesis. Journal of Motor Behavior, 32(3), 287-296.
Rosenbaum, D. A., Carlson, R. A., & Gilmore, R. O. (2000). Acquisition of intellectual and perceptual-motor skills. Annual Review of Psychology, 52, 453-470.