Reshoring American manufacturing and stakeholder desire for Made in the USA products are increasing in the textile and apparel industry. Benefits from reshoring include lower
transportation costs, quicker lead times, sustainability, and labor oversight. Higher labor costs for U.S. employees, costs from rebuilding manufacturing infrastructures, and potential loss of some efficiencies from international trade and globalization are some of the biggest concerns. Made in the USA and reshoring are broad terms with varying definitions in American manufacturing.
The aim of this research was to evaluate strategies for reshoring sourcing and
by
Megan Eileen Moore
A thesis submitted to the Graduate Faculty of North Carolina State University
in partial fulfillment of the requirements for the degree of
Master of Science
Textiles
Raleigh, North Carolina 2016
APPROVED BY:
_______________________________ _______________________________
Dr. Lori Rothenberg Dr. A. Godfrey
Committee Chair
DEDICATION
This paper is dedicated to my family who have always inspired my dreams and supported my endeavors. My parents, Erin and Steven McCarthy, imparted me with an endless
BIOGRAPHY
Megan Moore was born in South Carolina in 1986. As a child, she was a military brat who moved multiple times across the country all the while operating a nationally recognized rabbit and alpaca business with her parents. As the Assistant Manager of one of the largest alpaca farms in the country, she became a well-respected leading alpaca expert in the country. Upon graduating high school, she was hired by the University of Massachusetts, Amherst to become the Camelid Herd Manager and Assistant to the Director of Camelid Studies for the first undergraduate Camelid program nationwide. Megan earned a Bachelor of Science Degree in Animal Science from North Carolina State University with a minor in Genetics in 2010. During her undergraduate years, she served as the President of the Textiles Entrepreneurs Club and Vice President and then Co-President of the University
Entrepreneurship Network at North Carolina State University. Additionally, she was one of the top five student fundraising callers at the North Carolina State University Office of Annual Giving. After graduating, Megan spent five years in both boutique and big box customer service as the Assistant Manager and Interim Manager at Pendleton Woolen Mills, Cameron Village and Pet Care Manager at PetSmart, Garner. She is currently pursuing a Master of Science in Textiles degree with a minor in Statistics focusing on reasons for
ACKNOWLEDGMENTS
TABLE OF CONTENTS
List of Tables ... vi
List of Figures ... vii
Chapter 1 Introduction ...1
Chapter 2 Literature Review ...6
2.1Overview of Reshoring Reasons ...6
2.1.1Decision Making for Reshoring ...7
2.1.2Overview of Manufactured Fiber Consumption ...7
2.1.3Voice of the Consumer - Made in the USA ...10
2.2Higher Prices for Made in the USA ...13
2.3Positives of American Reshoring ...15
2.4Negatives of American Reshoring ...18
2.5Companies with Manufacturing in the USA ...22
2.5.1Examples of the Impact of Wal-Mart Stores Inc. on Reshoring ...24
2.5.2Examples of American Reshoring ...25
2.5.3Examples of Kept From Offshoring ...27
Chapter 3 Research Methodology ...32
3.1Research Aim and Objectives ...32
3.2Use of Secondary Data ...33
3.3Preparation of Secondary Data ...34
Chapter 4 Data Analysis and Results ...36
Chapter 5 Conclusions and Future Work ...51
5.1Summary of Conclusions ...51
5.2Significance of Research ...55
5.3Limitations and Recommendations ...56
5.4Future Work ...58
REFERENCES ...62
LIST OF TABLES
Table 4-1: Analysis of Means of Proportions Summary of Total Jobs and Aggregated Skilled Workforce ... 39 Table 4-2: Analysis of Means of Proportions Summary with Annual Revenue (in millions) and Aggregated Skilled Workforce ... 41 Table 4-3: Analysis of Means of Proportions Summary of Region of the USA and
Aggregated Quality ... 43 Table 4-4: Analysis of Means of Proportions Summary of Product Type and Aggregated Table 4-5: Analysis of Means of Proportions Summary of Category of Reshoring with Aggregated Other Push Factors ... 47 Table 4-6: Analysis of Means of Proportions Summary of Category of Reshoring with Aggregated Cost Factors ... 48 Table 4-7: Logistic Fit with Year Announced (period 2010 to 2016) with Aggregated
LIST OF FIGURES
Figure 4.1: Analysis of Means of Proportion of Total Jobs and Aggregated Skilled
Workforce ... 38 Figure 4.2: Analysis of Means Proportions with Annual Revenue (in millions) and
Aggregated Skilled Workforce ... 40 Figure 4.3: Analysis of Means Proportions of Region of the USA and Aggregated Quality 42 Figure 4.4: Analysis of Means Proportions of Product Type and Aggregated Product
Manufacturing ... 44 Figure 4.5: Analysis of Means Proportions of Category of Reshoring with Aggregated Other Push Factors ... 47 Figure 4.6: Analysis of Means Proportions of Category of Reshoring with Aggregated Cost Factors ... 48 Figure 4.7: Logistic Fit with Year Announced (period 2010 to 2016) with Aggregated
Chapter 1 Introduction
The objective of sourcing is “finding, evaluating, and engaging suppliers of goods
and services to achieve long-term competitive advantages” (Ha-Brookshire, 2014, p. 7). According to Ha-Brookshire, sourcing is “a set of business processes and activities by which businesses acquire and deliver components or fully finished products or services from outside of the organization” (Ha-Brookshire, 2014, p.7). Likewise, sourcing has been defined as the “process of finding, evaluating, and partnering with a vendor to secure services, materials,
production, or finished goods, or a combination of these, at a specified cost, quality, and service level, for delivery within an identified time frame” (Kunz et al., 2016, p.5).
Many companies source from a variety of countries, with some sourcing from over 20 countries simultaneously (Ellis, 2014a). In todays’ apparel industry, there are over 180 countries globally that are “capable of apparel assembly”, and yet “there is no ‘perfect’ county for such assembly” (Kunz et al., 2016, p. 225). According to Kunz, Karpova, & Garner, countries that firms source from vary in the development level of characteristics such as “overall stability and security, bureaucratic efficiency, education, human rights,
infrastructure, and labor costs” and by geographic location including “shipping cost, shipping
are leveraging a variety of expertise to prioritize the development of a sustainable supply chain (Kunz et al., 2016).
Globalization is the process whereby “the world’s people, their firms, and their countries become increasingly interconnected in all facets of their lives” (Kunz et al., 2016, p
4). In a climate of “today’s expanded global sourcing options”, factors such as “design, product development, vendor compliance, materials and factory sourcing, manufacturing control, and logistics” must be managed by textile and apparel firms (Kunz et al., 2016, p. 192). Offshoring can be described as “the locating of a manufacturing facility outside of the company’s headquarters region”, and “nearshoring refers to locating a manufacturing plant within one’s region” (Ellram et al., 2013, p. 15).
During the five year period from 2009 to 2014, there was an increase in both U.S. manufacturing and in the importation of off-shored manufactured good (Friedman, 2014). According to a survey conducted by the Federal Reserve Bank of Philadelphia, there was a 6.2 percent drop in the manufacturers surveyed who were returning manufacturing to the U.S. from the time period of August 2008 to August 2010 (Haflich, 2010). The study also showed that in this same time period, those surveyed who moved operations overseas dropped from 11.1 percent in 2008 to only 9.7 percent in 2010 (Haflich, 2010). Roughly 12 percent of the Gross Domestic Product of the United States of America is from
manufacturing jobs, however “U.S. manufacturing is indeed the weakest sector of the
producing more than the country can consume leading to the excess production being sent to the United States, “where it is offloaded at rock-bottom prices” (para. 12).
Additionally, global apparel trade increased 8 percent from the year 2012 to the year 2013, while the average growth of all other industries globally was only a 2 percent increase from the year 2012 to 2013 (Kunz et al., 2016). Furthermore, in 2014 there was a 12 percent increase in the pace and rate of the return of manufacturing operations to the U.S. in the apparel manufacturing industry (Friedman, 2014). According to the American Apparel & Footwear Association, in 2014 there were four million U.S. workers that contributed $361 billion in annual U.S. retail sales (American Apparel and Footwear Association, 2014).
The United States utilizes U.S. free-trade agreements to receive duty-free benefits and priorities from these trading partners (Ellis, 2014a). The top four most-used duty-free trade deals and preference programs that the United States participates in are The North American Free Trade Agreement, the Dominican Republic - Central American Free Trade Agreement, the African Growth and Opportunity Act, and the U.S.-Korea Free Trade Agreement (Ellis, 2014a). The Trans-Pacific Partnership between the U.S. and 11 other countries and the Transatlantic Trade and Investment Partnership with the European Union are two new agreements currently being developed (Ellis, 2014a).
consumption and the rapid decline of American manufacturing of textiles and apparel since the 1980’s (Kunz et al., 2016). A trade surplus for America would exist if the value of
exports exceed the value of imports, and a trade surplus is usually considered desirable (Kunz et al., 2016).
According to the 2016 textbook by Kunz, Karpova, & Garner, the apparel industry is defined as “combination of trades and businesses that contribute to designing, developing,
producing, and retailing garments and other attire that covers, protects, and/or adorn the human body” (p. 3), whereas the textile industry is defined as “combination of trades and
businesses that contribute to production, manufacturing, and retailing of fibers, yarns, fabrics, and related materials” (p. 5). While many consumers believe that manufacturing no longer
takes place in America, it is important to note that there are still numerous domestic manufacturing firms (Soltes, 2011). Global trade, social responsibility, sustainability, product safety, intellectual property, and governmental procedures are some of the biggest issues facing apparel and footwear retailers today (American Apparel and Footwear Association, 2014).
Reshoring can be defined as “a strategy that returns manufacturing to its home country” (Maronde et al., 2015, p. 80). Reshoring is the return to domestic manufacturing,
company (Foerstl et al., 2016). Managers and firms need to establish more definitive vernacular in relation to reshoring and its practices (Foerstl et al., 2016). Simply put, offshoring is manufacturing in foreign countries, nearshoring is manufacturing in
Chapter 2 Literature Review 2.1 Overview of Reshoring Reasons
Many companies are starting to see American manufacturing as a viable opportunity, and they are becoming passionate about the possibilities reshoring presents (Ellis, 2014a). According to the Reshoring Initiative website, the top reasons that companies are deciding to return to American manufacturing include shorter lead times, higher product quality and consistency, rising offshore wages, and a skilled workforce (Reshoring Initiative, 2016). Furthermore, manufacturing in America reduces freight costs, presents the added benefit of the image of being Made in USA, and encourages lower inventory levels with better turns (Reshoring Initiative, 2016).
Additional benefits of reshoring include better responsiveness to capricious customer demands, mitigation of intellectual property and regulatory compliance risks, enhanced innovation and product offering, and local tax incentives (Reshoring Initiative, 2016). Many larger U.S. companies use in-depth evaluation of a multitude of factors including country, risk and cost assessments in order to practice “right-shoring” (W.L. Tate, 2014, p. 68). “Right-shoring” requires making sourcing decisions based on data and common sense (W.L.
Tate, 2014, p. 68). Many global companies are debating the “idea of bringing in-house manufacturing and/or sourcing from foreign ‘low-cost’ locations” (Foerstl et al., 2016, p.
2.1.1 Decision Making for Reshoring
According to a 2007 article by Sanfey, “the study of decision-making attempts to understand our fundamental ability to process multiple alternatives and to choose an optimal course of action” (p. 598). Furthermore, “many of our most important decisions are made in the context of social interactions”, and an individual’s decision is often impacted by the
choices of other individuals with which the individual interacts (Sanfey, 2007, p. 598). Game Theory, for example, is “a collection of rigorous models attempting to understand and explain situations in which decision-makers must interact with one another” (Sanfey, 2007, p. 599).
A recent study revealed that reshoring practices arise from value-driven and country-specific motivations rather than the efficiency-driven and firm-country-specific motivations that lead many to offshore (Fratocchi et al., 2016). Furthermore, offshoring has led to “significant
managerial challenges for companies and severe economic and social concerns in Western countries due to the loss of jobs and the depletion of manufacturing skills” (Fratocchi et al.,
2016, p. 119). This study suggested that the over thirty factors for reshoring motivations could be categorized as interactions between the four main typologies of internal
environment, external environment, customer perceived value, and cost efficiency factors (Fratocchi et al., 2016).
2.1.2 Overview of Manufactured Fiber Consumption
all manufactured fiber (U.S. Manufactured Fiber: 2013 Year in Perspective, 2014). The total United States domestic and export shipments of manufactured fibers in 2013 was 6.34 billion pounds which is still 40 percent below the 10.52 billion pounds that were shipped in the peak year of 2000 for the industry (U.S. Manufactured Fiber: 2013 Year in Perspective, 2014). In the year 2009, the United States manufactured fiber industry suffered from the recession, with a low 5.02 million pounds (U.S. Manufactured Fiber: 2013 Year in Perspective, 2014). However, recent increases in shipment of manufactured fibers indicated that the industry is rebounding from the recession (U.S. Manufactured Fiber: 2013 Year in Perspective, 2014).
In 2013, Asian production accounted for 83 percent of the total globally
manufactured fibers excluding the production of olefin fibers (2014 Worldwide Survey of Production and Capacity, 2014). Furthermore, excluding olefin fibers, 63 percent of the worldwide manufactured fiber production occurred in China (2014 Worldwide Survey of Production and Capacity, 2014). The total global production of non-olefin fibers increased by 6.8 percent in 2013 (2014 Worldwide Survey of Production and Capacity, 2014).
Globally, excluding Asia, there was only a 1 percent increase in the production of non-olefin fibers worldwide (2014 Worldwide Survey of Production and Capacity, 2014).
Exports of manufactured fiber to Canada and Mexico from the United States
manufactures fibers to Canada and the United States increased 2 percent to 112 million pounds (NAFTA Trade in Manufactured Fiber, 2013). In 2013, the consumption of
manufactured fibers increased 3.1 percent, the consumption of cotton decreased 5.4 percent, and the consumption of wool fibers increased 8.4 percent throughout North America
(NAFTA Trade in Manufactured Fiber, 2013).
COTTON USA is a 25-year-old flagship brand of the Cotton Council International (CCI) (Meister Media Worldwide, 2014). The brand was recently re-launched with a new logo and “a revitalized brand vision emphasizing purity, quality, and responsibility” (Meister
Media Worldwide, 2014, p. 5, para. 4). From 1989 to 2014, the COTTON USA brand has converted approximately 100 million bales of cotton into over 50,000 product lines and over 3 billion products (Meister Media Worldwide, 2014). COTTON USA promotes cotton that is harvested in the United States to over 50 countries globally (COTTON Council
International, 2015). Manufacturers seek American cotton because of its purity, high quality, and environmental responsibility (COTTON Council International, 2015). COTTON USA boasts clean, not contaminated, non-irritating, safe, renewable, recyclable, and biodegradable cotton fibers (COTTON Council International, 2015).
products, and that is an important focus of the re-launched COTTON USA (COTTON Council International, 2015).
2.1.3 Voice of the Consumer - Made in the USA
One definition of reshoring proposed by the ‘Reshoring Initiative’ is “to bring good,
well-paying manufacturing jobs back to the United States by assisting companies to more accurately assess their total costs of offshoring” (Sarder et al., 2014p. 2672). A consumer
perspectives study from Cotton Incorporated in 2014 claims that consumers are more likely to purchase items with “100 percent cotton” or Made in the USA on the label than clothes that are considered “natural”, “sustainable”, or “environmentally-friendly” (Cotton
Incorporated, 2014a, para. Key Insights). American made products excel at being produced in both socially and environmentally responsible ways (Jankowski, 2014).
During a study conducted in 2003 by Lee, Hong, & Lee, when purchasing American manufactured products, some believed that they are helping their fellow Americans by enhancing domestic economies and local communities (Lee et al., 2003). Moreover,
bloggers and pundits across America are linking U.S. manufacturing with U.S. jobs (Soltes, 2011). Domestic economic growth is not only fueled when American jobs are created, but also when those employed make purchases and shop at the retailers purchasing from the manufacturers (Jankowski, 2014).
wage manufacturing jobs into other occupation and sectors with lower wages (Ebenstein et al., 2015). It has been proposed by Ebenstein, Harrison, and McMillan that “offshoring to
China has also contributed to wage declines among US workers” (Ebenstein et al., 2015,
para. Abstract).
During the 2012 election, there was a “Bring Jobs Back to America” campaign, and this philosophy was incorporated in many political platforms (Ellram et al., 2013, p. 20). Additionally, after the 2012 election President Obama emphasized the desire for “insource”
jobs and investing in American manufacturing during a forum he hosted at the White House (W.L. Tate, 2014, p. 66). During the 2016 New York presidential primaries elections, “both parties are lamenting the decline of manufacturing jobs” as the manufacturing sector has found a sixty percent decline since the 1940’s in New York (Matiash, 2016, para. 2). As part
of the 2016 primary elections, Mrs. Hillary Clinton has “vowed to bring back manufacturing jobs and help small businesses” (Elliott, 2016, para. 2). Additionally, Mr. Donald Trump has
promised to make Apple build computers and other products in the United States (Hockett, 2016). Furthermore, it has been noted that during the Democratic and Republican primaries and caucuses “there’s one stance that all seem to agree on: bringing manufacturing jobs back to the U.S.” (Hockett, 2016, para. 1).
The notion of “buying locally” has become a national movement gaining momentum (Cotton Incorporated, 2014a, para. Economics of Eco-Friendly Apparel). According to the Reshoring Initiative website, reshoring “motivates skilled workforce recruitment by
productive jobs, and reduces income inequality” (Reshoring Initiative, 2016, p. Why
Reshore, para. Why Reshoring Makes Sense for America). There have been recent television ads that are pushing for Made in the USA with scenes from manufacturing plants to appeal to consumers emotions (Loepp, 2014).
Investments are being made in the Carolinas specifically to develop apparel
manufacturing plants in America (Ellis, 2014b). In 2014, the MAGIC trade show focused on American-made goods for the first time since sourcing was introduced (Tran, 2014). TAP America is an organization with a business directory that asks its members to stock at least 20 percent of goods manufactured in America in their store and then increase these levels every month (Soltes, 2011). According to a 2014 article by Ingram, the U.S. Department of Commerce’s OTEXA has developed the first-ever government-sponsored Made in the USA
textile, apparel, and footwear database.
Moreover, patriotism amongst American consumers has increased the popularity of the “Buy Made in USA” campaign (Ha-Brookshire & Yoon, 2012, p. 446). This patriotism
2.2 Higher Prices for Made in the USA
Sandeep Chugani of the Boston Consulting Group said, “Consumers would prefer a product made in the U.S., but not at a premium” and “the pressure will be put on retailers as
to how you can leverage that sentiment without asking those consumers to pay for it” (Soltes, 2011, p. 16). Of the consumers surveyed by Cotton Incorporated in 2014, 78 percent of them said that “knowing a clothing item would support U.S. jobs or the economy would be very
influential in their ultimate decision to purchase” (Cotton Incorporated, 2014a, para. Economics of Eco-Friendly Apparel). Additionally, this study showed that “consumer concern about product being made outside of the U.S. has increased to 68 percent, up from 65 percent in 2012” (Cotton Incorporated, 2014a, para. Economics of Eco-Friendly Apparel).
In 2008 Jung and Eun-Young conducted a study of 300 college students with 100 South Korean students in Korea, 100 South Korean students in the USA, and 100 American students in the USA. This study investigated the brand equity of the international apparel brands Polo, Gap, and Levi’s (Jung & Eun-Young, 2008). There was a strong relationship
between brand equity and purchase intention (Jung & Eun-Young, 2008). Further, for a brand to have high international demand it must “create global brands that compete across countries and cultures” (Jung & Eun-Young, 2008, p. 33).
more sustainable material (Cotton Incorporated, 2014b). Even if the products have the same manufacturing, the country origins of raw materials impacted the consumer perceptions especially regarding price, quality, and level of design (Ha-Brookshire & Yoon, 2012). Demographic variables such as income determine the value of sustainability perceived by the consumer with regards to country of origin (Ha-Brookshire & Yoon, 2012).
In 2015, Maronde, Stambaugh, and Martin conducted a study using a six question survey administered to 504 student in undergraduate business courses in a university within the United States and two universities in Germany. The study suggests that “quality
improvements do not influence the consumer’s preference towards reshored products”
(Maronde et al., 2015, p. 86). In contrast, environmental improvement was important to the US undergraduate’s purchases, but not relevant for the German students (Maronde et al., 2015). Reshoring reduces environmental impacts, and “US consumers indicated a willingness to pay a price premium for reduced environmental impact” (Maronde et al.,
2015, p. 86). According to this study, environmental concerns are a stronger motivation than quality concerns for the purchase of reshored products amongst the undergraduate students (Maronde et al., 2015).
However, over 93 percent of U.S. consumers surveyed say that “clothing quality strongly impacts their decision to purchase” making quality a prime driver when purchasing
perceived quality of a product is “in the eye of the beholder” and varies based on the individual (Who Cares About Quality?, 2014, p. 11). Given that e-commerce is on the rise, the online product description is the first impression and a primary driver of the consumers perception of the product quality (Who Cares About Quality?, 2014).
2.3 Positives of American Reshoring
According to supporters of reshoring, it is “one of the most fundamental industrial
trends of the 21st century” in the manufacturing industry (P. Tate, 2014, para. 2). Reshoring and nearshoring are becoming more prevalent in the textile industry amongst many well-known brands as a result of fast fashion, financial flexibility needs, faster lead times, and lower transportation costs (Edelson, 2014). One of the biggest benefits of reshoring is that the lead time for American made goods to the American consumer is significantly shorter and in some cases items can make it to the store shelves within 60 days (Edelson, 2014).
Manufacturing goods in the United States also allows firms to better oversee the production process (Jankowski, 2014). At the same time, humane issues that have arisen in countries such as Bangladesh has caused American sourcing managers to adopt and apply stringent compliance standards that the foreign manufacturers must pay for themselves (Tran, 2014).
Some U.S. manufacturers are reshoring by returning offshored operations to the United States as a result of concerns with offshoring (Sarder, 2014). Consumers believe that there is a greater negative environmental impact from clothing manufacturing overseas when compared to domestically manufactured clothing (Cotton Incorporated, 2014a).
are increasing (Hutton, 2013). Furthermore, consumers state that domestic regulation and more stringent environmental protection laws aid in differentiating America as more environmentally-friendly manufacturers (Cotton Incorporated, 2014a).
As suggested by Tran in 2014, American sourcing managers are requiring shorter lead times and low labor costs from their manufactures. According to Hutton, the gap between manufacturing in China and the United States is decreasing, and direct labor costs are becoming a smaller portion of the total part costs (2013). Rising labor costs in China, along with U.S. manufacturing plants’ abilities to meet China’s manufacturing costs, are
major factors in this change (Loepp, 2014). Higher labor costs in Asia with inflation and sustainability trends amongst consumers are two primary driving forces behind reshoring manufacturing from China back to North America (Hutton, 2013). China is the top supplier of apparel to America with 41.5 percent of the apparel imports, but it is losing shares of this market as the minimum wage in China increases (Ellis, 2014a). Developing a strong
domestic manufacturing sector would provide American workers with global competitiveness (Houseman, 2014).
Since the end of 2012, there have been two factory tragedies in Bangladesh that have claimed more than 1,240 workers lives (Ellis, 2014a). Political instability in the Middle East can impede the ability of apparel and textile firms to receive the services and goods
suppliers in over 60 countries. According to the article by Urbina in 2013, Li & Fung is developing a reputation for being a “sweatshop locator” (para. 6). Furthermore, Li & Fung
has been tied to labor violations and deadly accidents in several countries including Cambodia and Bangladesh (Urbina, 2013).
As reported in the article Li & Fung treads a year of transition and investment, the chairman of Li & Fung, William Fung, is aware that 2013 was “a challenging year for Li &Fung” (Li & Fung Ltd., 2015, p. 23). Starting in 2014 Li & Fung has launched a three-year
plan of “transition and investment” “to invest in strategic initiatives for the future” (Li & Fung Ltd., 2015, p. 23). Li & Fung is seeking growth opportunities by focusing on sustainable enterprise, organic growth, vendor support services, strengthen logistics, and other key ideas (Li & Fung Ltd., 2015).
According to a 2014 article by Ingram, the United States ranks amongst the Top 10 largest single country textiles exporters with $23.7 billion exports of textiles and apparels per year. The largest markets for U.S. exports of textiles are Mexico, Canada, and partners of the U.S. Dominican Republic Central America Free Trade Agreement (Ingram, 2014). These countries represent over 60 percent of the total United States exports (Ingram, 2014).
Domestic production and offshore production are both considered by U.S. executives to meet U.S. demand (Friedman, 2014). Given that the U.S. is the world’s largest consumer market, increasing domestic manufacturing capabilities in America would lead to a more balanced national trade and decrease the budget deficits (Reshoring Initiative, 2016). If America is able to create a positive trade balance by having the value of exports exceed the value of imports, then a trade surplus would occur (Kunz et al., 2016).
There are hidden costs of offshoring, including logistic costs, and administrative costs, that are causing some firms to consider reshoring (Sarder et al., 2014). Production capability, research, development, engineering, and design are all impacted when a country loses its manufacturing (Soltes, 2011). American products are most competitive with highly automated product processes and items that are inefficient to ship along with items made of raw materials that are available in America such as cotton, plastic, and metals (Edelson, 2014). As component parts and processes are offshored, other countries gain the knowledge and capability to produce the goods often at a lower price (Soltes, 2011). Customer
retention, ease of doing business, policy regulation, difference in labor costs, logistic cost, product quality, proximity to customers, and tax implication are some of the factors a firm must consider when contemplating reshoring actions (Sarder et al., 2014).
2.4 Negatives of American Reshoring
Reshoring takes capital to buy or lease a building and bring in machinery for
offshoring when they are reshoring (W.L. Tate, 2014). As such, the southeastern part of the U.S. possess growth potential for manufacturing (W.L. Tate, 2014). Additionally, clothing prices as a whole would have to increase with the use of American labor, as countries such as Bangladesh have some of the cheapest labor in the world (Urbina, 2013). Reshoring
manufacturing to America would lower the amount of money that the federal US government has by billions of dollars because tariffs are collected on products that are imported into the United States from many countries (Sarder et al., 2014).
In a 2003 article by Arminas discussing British patriotism in consumerism, he proposed that some consumers will favor products based on their nationality. Furthermore, he claimed that patriotism should not be a major factor when considering the best value of a product, but the best values for the end consumer comes from competition in the market (Arminas, 2003). Americans tend to interchangeably use the terms “U.S.” and “North American” showing a lack of knowledge or caring to differentiate (Loepp, 2014, p.6). At
the time of purchase, many consumers do not even consider the nation of origin when determining the value of the product during purchasing (Arminas, 2003).
The Federal Trade Commission has developed an Enforcement Policy Statement for U.S. origins claims, however companies are asked to self-certify that they meet the
United States (Made in the USA Brand, 2015, p. About, para. 1). Some American-based suppliers are only able to produce part of the product in the United States resulting in “degrees of homemade” (Jankowski, 2014, p. 21).
The reality of manufacturing and producing products in the United States is a difficult notion as there is a large discrepancy between the wages and labor costs in America versus nations like Bangladesh (Donaldson, 2014). A few countries such as Luxembourg, France, Australia, Belgium, Netherlands, Ireland, the United Kingdom, New Zealand, and Canada have higher minimum wages than the United States (Weissmann, 2013). That said, more countries have minimum wages less than the United States such as Austria, Japan, Slovenia, Israel, South Korea, Spain, Greece, Poland, Turkey, and Portugal (Weissmann, 2013). Furthermore, Hungary, Slovak Republic, Czech Republic, Chile, Estonia, and Mexico all have minimum wages that are less than half of the minimum wage in America (Weissmann, 2013). Meanwhile, in the United States there has been an increasing movement to increase the minimum wage to $15 an hour from the $7.25 an hour established in 2009 (Pollin & Wicks-Lim, 2-16). The Midwest area of the United States is of specific interest for reshoring manufacturing due to lower wages (Lahidji & Tucker, 2014).
which suggests “regions or nations must focus on those industries which they have an
advantage relative to others” (Ha-Brookshire, 2014, p. 28).
Furthermore, the “eclectic theory of international production” suggests that firms
need to exhibit resource seeking advantage, market seeking advantage, efficiency seeking advantage, and strategic asset seeking advantage thus highlighting the need for offshoring (Ellram et al., 2013, p. 15). Additional factors such as costs, labor, logistics, supply chain, country risk, strategic access, and government trade policies all impact the viability of offshoring practices (Ellram et al., 2013). The “fragmentation theory of international trade” shows that countries trade components and parts for the development of a more efficient supply chain (Ha-Brookshire, 2013, p. 32). Simply put, sourcing serves as a strategic
business function, and there are many reasons for companies to choose to trade and source on a global level (Ha-Brookshire, 2014).
Manufacturing jobs in America have been declining dramatically in the years leading up to and during the Great Recession (Houseman, 2014). The total manufacturing jobs in America have dropped 30 percent since the year 2000 (Houseman, 2014). Some believe that reshoring will not result in large domestic job growth due to new technologies and
Furthermore, vertical integration of firms, along with increasingly complex supply chains, is hindering the growth of high-skilled manufacturing jobs (Houseman, 2014).
Additionally, there has been speculation that reshoring “will probably continue to swing between hype and reality for some time to come” (P. Tate, 2014, p. 1). The Reshoring
Index measures the Manufacturing Imports Ratio (MIR) through net reshoring and net offshoring to measure the amount of reshoring taking place (P. Tate, 2014). Apparently, the “U.S. has experienced wide swings in reshoring over the time horizon of the Reshoring Index” during a time period of 2004 to 2014 (P. Tate, 2014, p. 1).
2.5 Companies with Manufacturing in the USA
Some manufactures are developing a “blended” approach to Made in the USA,
sourcing by importing raw materials that are then assembled in America (Jankowski, 2014, p. 21). Modernplum is a linen manufacturer with a new modern lifestyle approach that sources linen material from the Czech Republic prior to cut, sewing, and packaging the material in Chicago, Illinois (Jankowski, 2014). Royal River Trading is the exclusive wholesaler of Cuddledown that imports raw material from around the globe, and then manufactures comforters and pillows within the United States to produce Made in the USA products (Jankowski, 2014).
production” according to Jeff Kaufman the president and chief operating officer of Avanti
Linens (Jankowski, 2014, p. 25). Thus, this illustrates the “degrees of homemade” or
“blended approaches” for products from American-based suppliers, especially when they are
only able to produce part of the product in the United States (Jankowski, 2014, p. 21). In June 2014, an assistant professor, Shen Lu, along with the U.S. Fashion Industry Association, conducted a survey of the 29 largest retailers, apparel brands, textile companies and importers, and wholesalers in America (Ellis, 2014a). Over half of the executives that were surveyed intend to increase their production in the United States in the next two years with retailers showing stronger intention than wholesalers (Ellis, 2014a). Of those surveyed, 77 percent of the companies claimed that they already source products from the United States (Ellis, 2014a). Those companies that are sourcing from the United States tend to have a more diversified sourcing base overall than the other respondents (Ellis, 2014a).
In 2014, Edelson conducted a case study in effective reshoring processes by Wal-Mart emphasizing the mass retailer’s commitment to purchasing products manufactured and
produced in the United States. This retail giant ensures that over two-thirds of the products that it buys are made or grown in the United States (Edelson, 2014). In July of 2014, Wal-Mart made an open call with over 500 American suppliers and committed to spend over $250 billion over 10 years on products made within the United States (Edelson, 2014). The
to cultivating American-made products via reshoring and expanding orders with current suppliers while simultaneously working with new domestic suppliers (Edelson, 2014). Lean and cost-efficient strategies during the recession have also caused the big box retailer to look towards American manufacturing (Loepp, 2014).
2.5.1 Examples of the Impact of Wal-Mart Stores Inc. on Reshoring
For manufacturers, major retailers who purchase the product wholesale are the customers whose needs they are attempting to meet (Gill, 2015). The world’s largest retailer
is Walmart, hence as Walmart is making strong commitments to offer its consumers U.S.-made products, the manufacturers and suppliers for Walmart must also increase their commitment to Made in the USA (Gill, 2015). In January 2013, Walmart announced that it planned to increase the retailers purchases of U.S.- manufactured products to 50 billion dollars by the year 2023 (Gill, 2015). In 2013 and 2014, Walmart the largest retailer in the world hosted the U.S. Manufacturing Summit joining government and industry
representatives together in a reshoring effect (Gill, 2015). Kayla Whaling, a Walmart spokeswoman, has claimed that “to the Walmart buyers, country of origin has become second in importance in the purchase decision to price” (Gill, 2015, para. 6).
Many suppliers have responded to Walmart’s commitment to purchasing products
Made in the USA (Gill, 2015). 1888 Mills has committed to build a 500,000-square-foot mill for the production of towels in Griffin, GA (Gill, 2015). Walmart made an extremely
patio furniture and outdoor products with a factory in Alabama (Gill, 2015). Meadowcraft is developing the Arlington House brand to sell in 500 Walmart stores across America (Gill, 2015). Ranir, which manufactures electric toothbrushes, and Korona, which manufactures candles, have both moved production from abroad to the United States in reshoring efforts (Gill, 2015).
In 2013, as a direct result of Walmart’s commitment to purchase Made in the USA products, Louis Hornick & Co. opened a plant in South Carolina to manufacture window treatments (Gill, 2015). No Nonsense and Kayser-Roth Corporation manufacture socks in North Carolina that sell in Walmart (Reshoring Initiative, 2016). An additional investment of $28 million helped to create 100 new jobs for No Nonsense and Kayser-Roth Corporation (Reshoring Initiative, 2016). By expanding their Made in the USA program to meet the Walmart purchasing commitments, No Nonsense and Kayser-Roth Corporation ceased offshoring prospects in 2013 and kept from offshoring (Reshoring Initiative, 2016). Walmart’s commitment has led to expanding orders with current suppliers while
simultaneously working with new domestic suppliers (Edelson, 2014). Wal-Mart Stores Inc. is committed to cultivating American-made products leading to increased reshoring efforts from suppliers (Edelson, 2014).
2.5.2 Examples of American Reshoring
listed on the website include the GE Appliance Park, Walmart, Hubbardton Forge and
Zentech (Reshoring Initiative, 2016). Most of these companies are manufacturing based with some examples from the IT and call center industries (Reshoring Initiative, 2016).
American Giant is an example of a case study featured on the Reshoring Initiative website (Reshoring Initiative, 2016). American Giant is a manufacturer of hooded
sweatshirts, that in 2012 to 2013 reshored sourcing and production from India to Gaffney, South Carolina (Reshoring Initiative, 2016). American Giant sources its spun yarn from Parkdale Mills, in Gaffney, South Carolina which reopened its mill in 2010 (Reshoring Initiative, 2016). Parkdale Mills, the world’s largest cotton-yarn manufacturer, has been headquartered in Gastonia, North Carolina for over 70 years (McCurry, 2013). American Giant sources fabric from Carolina Cotton Works, showcasing the benefit that a single reshored company can have on other domestic companies (Reshoring Initiative, 2016). American Giant cited “freight cost, lead time/time to market, rising wages, communication, quality and automation/technology” as reasons that the company returned to American
manufacturing (Reshoring Initiative, 2016, p. 21 of
http://reshorenow.org/content/companies_reshoring/Cases9_26_16.pdf).
Williams-Sonoma created a new furniture manufacturing division, Sutter Street Manufacturing, to “boost American-made assortments” (Gill, 2015, para. 12). Founded by
the Williams-Sonoma brands (Gill, 2015). Eric Fulcher has emphasized the craft and skill necessary in upholstery furniture, and this knowledge will be critical in training future Americans in manufacturing fields (Gill, 2015).
Prior to its reshoring efforts through Sutter Street Manufacturing, Williams-Sonoma sourced from the United States, Asia, and Europe (Gill, 2015). By conducting all of the company’s manufacturing in the United States, Williams-Sonoma now has greater control of
the process from product development to finished product (Gill, 2015). Sutter Street Manufacturing leverages regionalized factories to offer faster shipping and customized special orders both of which enhance customer service (Gill, 2015). Williams-Sonoma offered a 20 percent off American manufactured products throughout its brands, including Pottery Barn, on July 4, 2015, the United States Independence Day, showcasing the marketing benefits of Made in the USA products (Gill, 2015).
2.5.3 Examples of Kept From Offshoring
Consumers are drawn to American goods due to perceived enhanced value, quality, design, and trend-setting style (Ingram, 2014). Some companies have stuck with American manufacturing due to niche markets and innovation (Soltes, 2011). According to Tran, “pockets of production can thrive in the U.S.”, and “choosing between domestic and foreign manufacturing isn't easy” (Tran, 2014, p. 9). There is a niche market developing in New
An example of a niche market for American manufactured product in the apparel industry is the Raleigh Denim jeans that are made at Cone Denim Mills in Raleigh, North Carolina (Need Supply Company, 2014). The founders of Raleigh Denim, Sarah and Victor Lytvinenko, were searching for an easily accessible location close to home (Need Supply Company, 2014). According to the Need Supply Company website in 2014, each pair of jeans is hand signed and individually numbered, while the jeans are made by hand at this premier America mill (Need Supply Company, 2014).
In 2010, Rambler’s Way was founded by Kate and Tom Chapell (Rambler’s Way, 2010). Tom Chappell is the former head of Tom’s of Maine, a well-known natural
toothpaste (McCurry, 2013). Rambler’s Way uses U.S. Ramboiillet wool from sheep farms
in Maine and partner ranches from other states including Colorado and Nevada (Rambler’s Way, 2010). Rambler’s Way offers superfine fabric that can be used in base-layer garments and intimate apparel to both warm and comfort consumers (Rambler’s Way, 2010).
Spinning, knitting, and weaving of the wool is contracted to other firms, but Rambler’s Way
owns and operates its own dye house (McCurry, 2013). With an emphasis on sustainability, Rambler’s Way uses only vegetable dyes in the company’s commercial dye house in Maine
(McCurry, 2013).
Saatva is an online mattress company that is 100% American made, and “Saatva is proud to locally source materials and continue enriching the American economy” (Saatva
(Saatva Inc., 2016). On average, the mattresses only travel 100 miles from manufacturing to the customer’s house (Saatva Inc., 2016). Saatva is able to offer competitive pricing, because they “save on transportation and storefront costs incurred such as rent, commissions, utility costs” (Saatva Inc., 2016, p. 100% Made in the USA, para. 2). While their mattress are
100% Made in America, the website does mention that raw materials such as some nuts and bolts may come from other countries (Saatva Inc., 2016).
Similarly, Tuft & Needle is a mattress firm that is “Made with care in the United States”, and all of their mattresses “are designed and crafted in the U.S.A.” (Tuft & Needle,
2016, p. Our Story, para. Made with care in the United States). Tuft & Needle sources its fabric from “a 90-year old, family-owned textile mill in the Carolinas” (Tuft & Needle, 2016,
p. Our Story, para. Made with care in the United States). The foam for the mattresses are poured and cut in the United States (Tuft & Needle, 2016). Sewing and finishing occurs in Southern California, and all finishing touches are done prior to delivery (Tuft & Needle, 2016).
(Jankowski, 2014). Culpepper noted that these international markets boast “quality
manufacturing and on-trend design” as driving forces for purchasing the American produced tufted rugs (Jankowski, 2014, p. 20).
In addition to reshoring, some American manufacturers are making significant investments to ensure that companies can continue success in the United States (Reshoring Initiative, 2016). Sans Technical Fibers is a North American manufacturer of nylon 6.6 fibers (McCurry, 2013). The manufacturing plant is located in Stoneville, North Carolina, and in 2013 Sans Technical Fibers committed to making a $10 million investment in machinery and equipment (McCurry, 2013). This allowed the company to expand its position in the automotive, military, and apparel markets in both textile and industrial
application by increasing the production by over 8 million pounds per year (McCurry, 2013). Additionally, Sans Technical Fibers partnered with Ascend Performance Material, Inc. in order to meet the demands of both domestic and foreign markets (McCurry, 2013). Due to a 2010 workforce expansion, the new 2013 investment did not directly result in the creation of new jobs (McCurry, 2013). The increased capacity contributed to a more stable and financial successful American manufacturing firm (McCurry, 2013).
Home Source International is a manufacturer of flat and fitted sheets, pillowcases, comforters, coverlets, bedspreads, shower curtains, decorative pillows and window
president and CEO of Home Source International, after the factory was built, it took an additional three years before manufacturing could begin (Jankowski, 2014). This three year lag time was due to the difficulties in purchasing, obtaining, and preparing the manufacturing equipment for production (Jankowski, 2014). Home Source International focuses on smaller manufacturing runs leveraging shorter lead times, fast replenishment turnaround, and
flexibility to better serve its customers (Jankowski, 2014).
Chapter 3 Research Methodology
The purpose of this study is to investigate the reshoring of sourcing and
manufacturing strategies of apparel and textile companies. The sourcing and manufacturing strategies are the methods that a company uses to obtain raw materials, manufactured materials, or finished products from suppliers. Specifically this study evaluates reasons companies have been reshoring (moving from previous international suppliers back to domestic suppliers). Furthermore, some apparel and textile companies have been kept from offshoring (KFO) as part of their reshoring initiatives, alternatively selecting domestic suppliers or to self-supply (Reshoring Initiative, 2016). Another form of reshoring included in the study are foreign direct investments (FDI), which is an investment in the form of a controlling ownership in a company by an entity based in another country (Reshoring Initiative, 2016). In addition to the reasons that companies reshore, the study acquired basic information about the apparel and textile companies to determine if there is a relationship between the general type of apparel and textile company and the reasons for using domestic suppliers. The ultimate goal is to save apparel and textile companies’ time, work, and money when determining their sourcing and manufacturing strategies.
3.1 Research Aim and Objectives
Research Aim: Evaluation of reshoring sourcing and manufacturing strategies in the apparel and textile industries.
Research Objective 1: To identify general attributes of companies that have reshored.
Research Objective 2: To identify and quantify the push factors and pull factors leading to reshoring practices amongst textile and apparel companies.
Research Objective 3: To examine the relationship between the general attributes of companies that have reshored and the factors leading to their reshoring.
In order to achieve these objectives, a thorough literature review was conducted on reshoring and Made in the USA. This was in order to identify previous research in the area along with the current social climate on the issue regarding demand and consumer desires. Through the preparation, evaluation, and analyzation of the secondary data, an understanding into the reasons for reshoring was gleamed.
3.2 Use of Secondary Data
retained from the secondary data included company name, parent company, category of reshoring, total jobs reshored, year reshoring was announced, year reshored, country reshored from, region reshored from, products reshored, push factors of reshoring, and pull factors of reshoring. All information in this research is aggregated, and all identifying information about the companies is not reported on an individual basis for the sake of confidentiality. 3.3 Preparation of Secondary Data
While the secondary data was very extensive, additional preparation of the secondary data information and additional acquisition of secondary data was required for the purpose of this research. The additional acquisition of secondary data included the total jobs in the company and estimated annual revenue in millions which were obtained from Reference USA and One Source databases. In instances where information differed between a single location and the entire company, the parent company information was included. This is due to the fact a company with 30 employees would presumably have less resources available at its disposal than a company with 30 employees at a specific location that is a subsidiary of a company with 3,000 employees companywide. The categories regarding the annual revenue and total number of jobs are obtained from Uluskan’s research which is originally obtained from the Small Business Administration’s categorizations of companies (Uluskan, et al.,
Distributions and Frequencies of the General Attributes of the Reshoring Companies, shows the distribution and the frequencies for of the independent variables for the 140 companies.
One of the primary goals of this research was “to identify and quantify the push
factors and pull factors leading to reshoring practices amongst textile and apparel companies”. The secondary data contained thirty-four reasons for reshoring mentioned
combined into only four columns. The largest preparation of the secondary data involved organizing the push and pull reshoring reasons by separating out the thirty-four factors into individual columns and converting these columns to binary. Anything with reason with only one instance amongst the 140 companies was kept in the other push factors and other pull factors columns. For binary, a 1 indicated that the specific reason was mentioned in the publication as a contributing factor for reshoring, and a 0 indicated that the specific reason was not mentioned in the publication as a contributing factor. Appendix C has the
Chapter 4
Data Analysis and Results
In pursuit of addressing the research aim of evaluation of reshoring sourcing and manufacturing strategies in the apparel and textile industries, data analysis was conducted to identify the factors that have led textile and apparel companies to reshore as part of their sourcing decisions. The total jobs in the company, annual revenue, product type, year reshoring was announced, region of operations, region of the world reshored from, and category of reshoring provided general attributes of the reshoring company. For the purpose of analysis, these general attributes were used as the independent variables. Aggregated quality, aggregated lead time, aggregated product management, aggregated cost factors, aggregated other push factors, aggregated customers, aggregated government incentives, aggregated skilled workforce, aggregated product manufacturing, aggregated synergies, and aggregated other pull factors were identified and quantified as the push factors and pull factors leading to reshoring practices amongst textile and apparel companies. These
aggregated push and pull factors were used as the dependent variables or response variables for analysis.
For the purpose of this research, the Likelihood Ratio test rather than the Pearson was used to test for statistically significant relationships as it is more robust to small sample sizes (Augustin & Hable, 2010). In order to identify the largest contributor(s) to a statistically significant relationships, an analysis of means for proportions was used. The alpha or significance level is 0.05 for all of the analyses conducted in this research. Additionally, UDL means upper decision limit and LDL means lower decision limit in all of the analysis results. The unabridged analysis of the data can be found in Appendix F through Appendix M.
The first analysis of the data was total jobs as the independent variable and
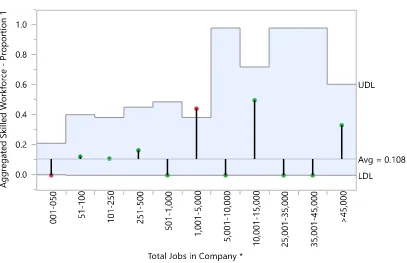
aggregated reasons as the response variable. This analysis can be found in Appendix F, the Contingency Analysis of Total Jobs with Aggregated Reasons for Reshoring. Based on Figure 4.1 and Table 4-1, there is a significant relationship between total jobs and the reshoring reason of aggregated skilled workforce. Specifically, the decision limits indicate that the proportion of companies with 001-050 employees and the proportion of companies with 1001-5000 employees were significantly different from the average proportion of the other companies.
Further, the decision limits indicate that the proportion of companies with 001-050 employees was significantly smaller in comparison to the average proportion of other
companies. However, as indicated in Table 4-1, the proportion was zero. The decision limits indicate the proportion of companies with 1001-5000 was significantly higher than the
“skilled workforce availability/training” had enough incidences to be the only factor included
in the aggregated skilled workforce. This figure and table indicate that total jobs has a significant relationship with skilled workforce. This was the only one of the aggregated reasons to which total jobs in the company was significant related.
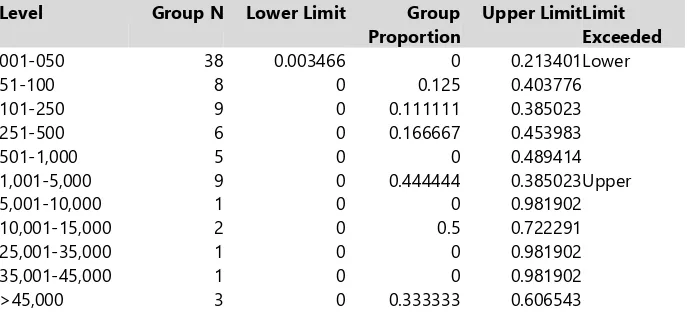
Table 4-1: Analysis of Means of Proportions Summary of Total Jobs and Aggregated Skilled Workforce
Level Group N Lower Limit Group
Proportion
Upper Limit Limit Exceeded 001-050 38 0.003466 0 0.213401 Lower
51-100 8 0 0.125 0.403776
101-250 9 0 0.111111 0.385023
251-500 6 0 0.166667 0.453983
501-1,000 5 0 0 0.489414
1,001-5,000 9 0 0.444444 0.385023 Upper
5,001-10,000 1 0 0 0.981902
10,001-15,000 2 0 0.5 0.722291
25,001-35,000 1 0 0 0.981902
35,001-45,000 1 0 0 0.981902
>45,000 3 0 0.333333 0.606543
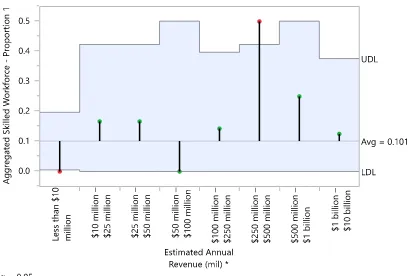
companies. However, as indicated in Table 4-2, the proportion was zero. As with the contingency analysis of total jobs, aggregated skilled workforce was the only one of the aggregated reasons with a significant relationship with the annual revenue of the company. This is not surprising, as one would intuitively expect a direct relationship between annual revenue and total jobs. This means that when annual revenue increases a company will hire more people to meet new demands leading to total jobs increasing as well.
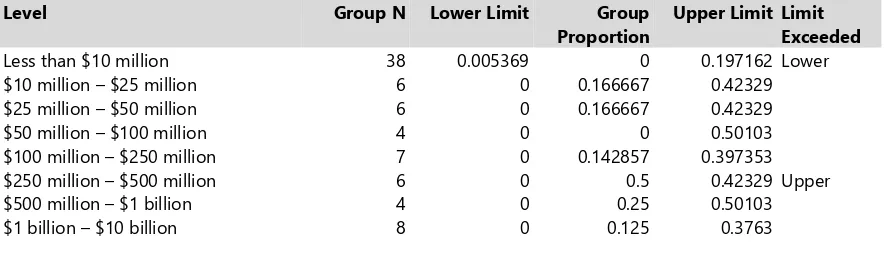
Table 4-2: Analysis of Means of Proportions Summary with Annual Revenue (in millions) and Aggregated Skilled Workforce
Level Group N Lower Limit Group
Proportion
Upper Limit Limit Exceeded Less than $10 million 38 0.005369 0 0.197162 Lower $10 million – $25 million 6 0 0.166667 0.42329 $25 million – $50 million 6 0 0.166667 0.42329
$50 million – $100 million 4 0 0 0.50103
$100 million – $250 million 7 0 0.142857 0.397353 $250 million – $500 million 6 0 0.5 0.42329 Upper $500 million – $1 billion 4 0 0.25 0.50103
$1 billion – $10 billion 8 0 0.125 0.3763
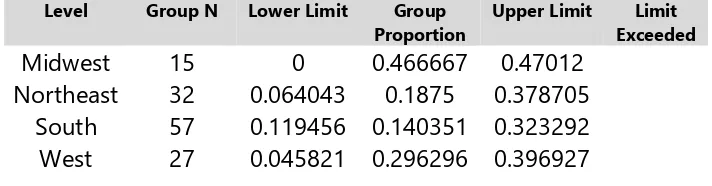
Continuing, the third analysis of the data was region of the world reshored from as the independent variable and aggregated reasons as the response variable. This analysis can be found in Appendix H, the Contingency Analysis of Region of the World Reshored from with Aggregated Reasons for Reshoring. Surprisingly, none of the contingency analyses involving region of the world reshored from with aggregated reasons for reshoring had a significant Likelihood Ratio test. This indicates that there is no relationship between the aggregated reasons and the region of the world reshored from, including Asia, Western Europe, and the Americas.
relationship between region of the USA and the reshoring reason of aggregated quality. Although the Likelihood Ratio test indicates a significant relationship between the region of the USA and aggregated quality, nothing appears to be significant when the Analysis of Means was performed. As can be found in Appendix C and Appendix D,
“quality/rework/warranty” had enough incidences to be the only factor included in
aggregated quality. Thus Figure 4.3 and Table 4-3 indicate that region of the USA that the company operates from is a significant factor when quality/rework/warranty is a reason mentioned for reshoring. While the Pearson test indicates a significant relationship between region of the USA and aggregated cost, the analysis of region of USA and aggregated quality was the only Likelihood Ratio test indicating a significant relationship.
Table 4-3: Analysis of Means of Proportions Summary of Region of the USA and Aggregated Quality
Level Group N Lower Limit Group
Proportion
Upper Limit Limit Exceeded
Midwest 15 0 0.466667 0.47012
Northeast 32 0.064043 0.1875 0.378705
South 57 0.119456 0.140351 0.323292
West 27 0.045821 0.296296 0.396927
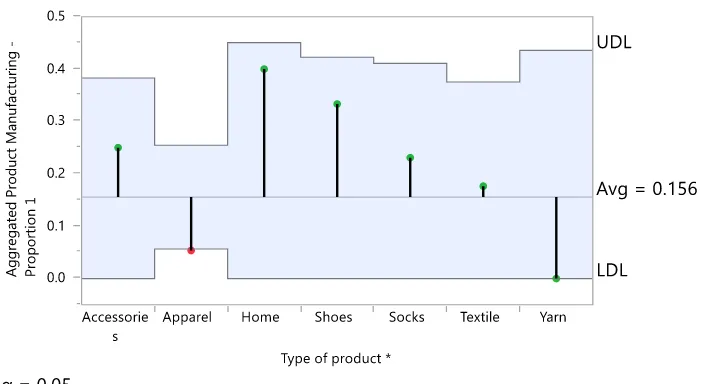
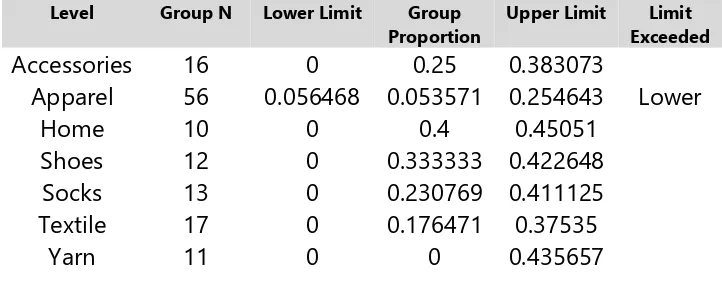
Moreover, the fifth analysis of the data designated product type as the independent variable and aggregated reasons as the response variable. This analysis can be found in Appendix J, the Contingency Analysis of Product Type with Aggregated Reasons for Reshoring. Based on Figure 4.4 and Table 4-4, there is a significant relationship between product type and the reshoring reason of aggregated product manufacturing. Specifically, the decision limits indicate that the proportion of apparel companies was different from the average proportion of the other product types. The decision limits indicate that the
proportion of companies with apparel product type was significantly smaller in comparison to the average proportion of other product types. As can be found in Appendix E, aggregated product manufacturing includes automation/technology, re-design of the part,
manufacturing/engineering joint innovation (research and development), 3D printing/additive manufacturing, customization, and/or higher productivity are reasons mentioned for
reshoring. This was the only one of the aggregated reasons to which product type in the company was significantly related based on the Likelihood Ratio test.
Table 4-4: Analysis of Means of Proportions Summary of Product Type and Aggregated Product Manufacturing
Level Group N Lower Limit Group
Proportion
Upper Limit Limit Exceeded
Accessories 16 0 0.25 0.383073
Apparel 56 0.056468 0.053571 0.254643 Lower
Home 10 0 0.4 0.45051
Shoes 12 0 0.333333 0.422648
Socks 13 0 0.230769 0.411125
Textile 17 0 0.176471 0.37535
Yarn 11 0 0 0.435657
environmental, social, and economic sustainability, the other push factors could be thought of as sustainability concerns. This figure and table indicate that the category of reshoring is a significant factor when green considerations, supply chain interruption risk, social/ethical considerations, intellectual property risk, communication, and/or other push factors are mentioned as reasons for reshoring.
Likewise, Figure 4.6 and Table 4-6 indicated that the category of reshoring is
aggregated other push and aggregated cost were the only two reasons for reshoring with an observed significant relationship with categories of reshoring.
Figure 4.5: Analysis of Means Proportions of Category of Reshoring with Aggregated Other Push Factors
Table 4-5: Analysis of Means of Proportions Summary of Category of Reshoring with Aggregated Other Push Factors
Level Group N Lower Limit Group
Proportion
Upper Limit Limit Exceeded
FDI 17 0 0 0.282757
KFO 68 0.049838 0.058824 0.178734
Figure 4.6: Analysis of Means Proportions of Category of Reshoring with Aggregated Cost Factors
Table 4-6: Analysis of Means of Proportions Summary of Category of Reshoring with Aggregated Cost Factors
Level Group N Lower Limit Group
Proportion
Upper Limit Limit Exceeded
FDI 17 0 0.058824 0.282757
KFO 68 0.049838 0.044118 0.178734 Lower
Reshoring 55 0.036424 0.218182 0.192148 Upper
Lastly, the seventh analysis of the data was the year the company announced
Ratios, however, the data showed clear signs of outliers. The original data was reviewed and it was found that 139 of the 140 companies had a year announced listed, and of the 139 listed years only 15 of them were from the time period 2001 to 2009. Thus, 124 of the companies included in the secondary data had announced their reshoring from 2010 to 2016. For this reason, the Logistic Fit of Year Announced (Years 2010 to 2016) with Aggregated Reasons for Reshoring found in Appendix M was conducted. From the time period of 2010 to 2016, aggregated quality comprising of the mentioning of quality/rework/warranty was the only significant aggregated reshoring factor. Figure 4.7 and Table 4-7 indicate that
quality/rework/warranty became a less influential reason for reshoring as time progressed from 2010 to 2016. This is not surprising given that offshoring quality concerns have been addressed by other nations, and quality has become more consistent globally.
Table 4-7: Logistic Fit with Year Announced (period 2010 to 2016) with Aggregated Quality
Model -LogLikelihood DF ChiSquare Prob>ChiSq
Difference 3.076524 1 6.153048 0.0131*
Full 60.601067
Chapter 5
Conclusions and Future Work 5.1 Summary of Conclusions
One of the biggest decisions that any textile and apparel firm needs to make in today’s global environment is the decision of where to source their raw materials, fabrics,
and manufacturing. Offshoring is manufacturing in foreign countries, nearshoring is manufacturing in neighboring countries, and reshoring is returning manufacturing to domestic production. As a result of faster lead times, financial flexibility needs, and lower transportation costs, reshoring is becoming more prevalent in the textile industry amongst some well-known brands.
and attention regarding country of origin (Arminas, 2003), and high labor costs in the United States when compared to the global marketplace (Weissmann, 2013). Furthermore, there are many benefits that results from global specialization and global trade (Ha-Brookshire, 2014; Kunz et al., 2016), which may be hampered by domestic manufacturing. With the increase of automation and manufacturing, there is no guarantee that reshoring American
manufacturing would aid in American employment (Houseman, 2014).
There are brands and retailers that are committed to sourcing products that are Made in the USA as part of their already diverse sourcing portfolios (Reshoring Initiative, 2016; Kunz et al., 2016; Ellis, 2014a). There are varying forms of reshoring, including returning manufacturing to the United States, preventing companies from offshoring through
significant investments, and assembling raw materials from other countries inside the United States (Reshoring Initiative, 2016; Jankowski, 2014). Reshoring practices offer many possibilities to the textile industry, apparel industry, and companies that are willing to take the risk.
The aim of this research was the evaluation of reshoring sourcing and manufacturing strategies in the apparel and textile industries. To this end, data analysis of secondary data was conducted to identify the attributes of textile and apparel companies that have reshored, the factors that have lead those same companies to reshore as part of their sourcing decisions, and the relationship between those attributes and reshoring factors. According to the
Reshoring Initiative website, the top reasons that companies are deciding to return to
rising offshore wages, and a skilled workforce (Reshoring Initiative, 2016). Reshoring practices arise from value-driven and country-specific motivations rather than the efficiency-driven and firm-specific motivations that lead many to offshore (Fratocchi et al., 2016).
Total jobs and annual revenue exhibited a significant relationship with the reshoring reason of aggregated skilled workforce. According to the Reshoring Initiative website, reshoring “motivates skilled workforce recruitment by demonstrating that manufacturing is a
growth career, reduces unemployment by creating productive jobs, and reduces income inequality” (Reshoring Initiative, 2016, p. Why Reshore, para. Why Reshoring Makes Sense for America). There were no observable significant relationships between reshoring reasons and the region of the world reshored from, including Asia, Western Europe, and the
Americas. In todays’ apparel industry, there are over 180 countries globally that are “capable of apparel assembly”, and yet “there is no ‘perfect’ county for such assembly” (Kunz et al.,
2016, p. 225). A few countries have higher minimum wages than the United States, and more countries have minimum wages less than the United States (Weissmann, 2013). Many companies source from a variety of countries, with some sourcing from over 20 countries simultaneously (Ellis, 2014a). According to Kunz, Karpova, & Garner, countries that firms source from vary by level of development including “overall stability and security,