ABSTRACT
SARGENT, DORIS ELLEN. Evaluation of Two Nutrition Education Programs: The Expanded Food and Nutrition Education Program (EFNEP) and Out For Lunch (OFL). (Under the direction of Dr. Robert D. Mustian)
The purpose of this study was to examine the behavior changes, barriers to preparing healthy meals, quality of life and internal locus of control with two nutrition education programs EFNEP and OFL.
Data for this study were collected by surveying participants in the EFNEP and OFL Program before and after participation in the programs.
The research was guided by the following questions. (1) Do participants change behavior after participating in EFNEP or OFL?; (2) Are participants able to overcome barriers that prevent them from preparing healthy meals after participating in EFNEP or OFL?; (3) Do participants demonstrate an increase in their quality of life after
participating in EFNEP or OFL?; (4) Do participants experience changes in their perceived control of their environment after participating in EFNEP or OFL?, and (5). What effect, if any, does the method of program delivery have on change in behaviors, overcoming barriers to healthy meals, a change in locus of control and quality of life after participating in EFNEP or OFL?
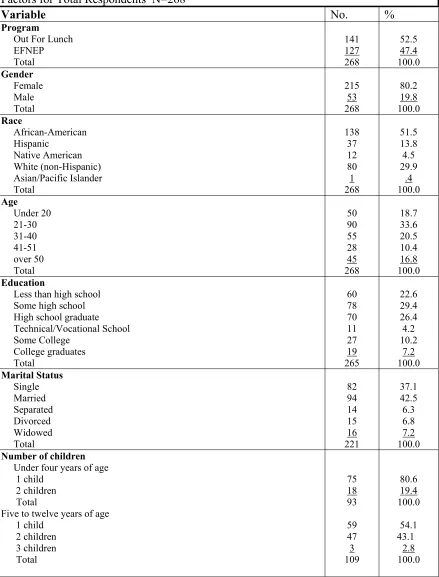
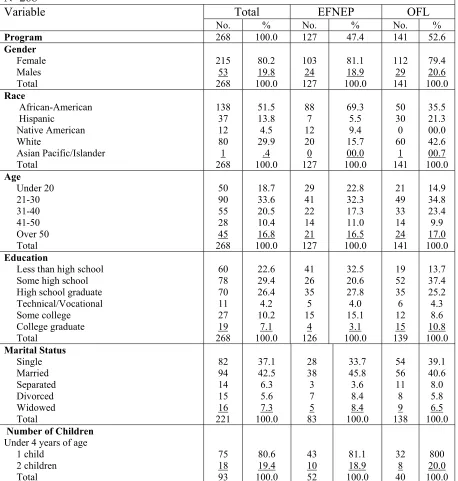
Among the 268 respondents, there were 141 respondents from the OFL Program and 127 from EFNEP. The majority of the participants were female, African-American, between the ages of 21-30 and had a high school education or less.
EFNEP and OFL did not impact clients in overcoming barriers in preparing healthy meals, and participation in the programs did not seem to have an influence on the
Evaluation of Two Nutrition Education Programs: The Expanded Food and Nutrition Education Program (EFNEP) and Out For Lunch (OFL)
by
Doris E. Sargent
A dissertation submitted to the Graduate Faculty of North Carolina State University
In partial fulfillment of the requirements for the degree of
Doctorate of Education
In
Agriculture and Extension Education
Raleigh, NC 2006
Approved by:
Dr. David Jenkins Dr. Gary Moore
DEDICATION
In Memory of My Parents
Omar Lemon Houck
and
Mildred Hazel Houck
BIOGRAPHY
Doris Ellen Houck Sargent was born on April 4, 1941, in Paradise, Pennsylvania, the middle child of three siblings to the parents of Omar and Mildred Houck. She was reared on a farm in Lancaster County immersed in the culture of the Pennsylvania Dutch. She graduated from Pequea Valley High school in 1959. She continued her education at Mansfield University, Mansfield, Pennsylvania, where she received a Bachelor of Science degree in Home Economics Education. Upon completion of this degree, she taught in a local high school for three years.
In May of 1968, she married and began her family. Her first few years of marriage were on a dairy farm in Northern Pennsylvania with her husband and five children. Later the family moved to a larger farm with a restaurant and jug-milk plant. The next twelve years of her life, she was involved in the operation of the restaurant, dairy bar and dairy farm.
In 1988, she returned to Mansfield University and received her Bachelor of Science degree in Nutrition. She sat for the R.D. examination and became a Registered Dietitian in 1992. While working as a clinical dietitian and food service supervisor, she continued her education at Mansfield University and received her Masters in Home Economics Education with a major in Nutrition in 1993.
In 1994, she accepted a position with Penn State Cooperative Extension as a Family and Consumer Science Extension Agent. She worked in this position for five years.
Expanded Food and Nutrition Education Program where she worked to design and implement innovative food and nutrition education programs for limited-resource audiences. After five years in this position, she accepted the responsibility as the Program Coordinator for the Out For Lunch Program. When funding ended for this position, the Nutrition Services Branch of the Department of Health offered her
employment in their department. In this present position, she develops curriculums and delivers nutrition education training for school personnel including Child Nutrition staff, teachers and students.
ACKNOWLEDGEMENTS
I would like to take this opportunity to recognize the support, encouragement and assistance of faculty, professional colleagues, family and friends during this process of graduate studies, which eventually resulted in this research and dissertation.
First, I would like to thank my committee for their continuing support and expertise. Dr. David Jenkins’s office door was always open for me. He kept me going and instilled in me the need to finish this degree in a timely manner. Dr Carolyn Lackey supported me from the beginning, and provided support as a supervisor, mentor,
colleague, professor and especially as a friend. Dr Gary Moore is and always will be one of the best professors that I studied under in my graduate program. Not only did he provide the support to complete this terminal degree, he made the entire process
motivating and exciting. I would especially like to thank the chair of my committee, Dr. David Mustian. Dr. Mustian provided me with guidance, encouragement and direction. He made me believe in myself and gave me the support I needed to be successful. I will always be grateful for his words of encouragement and for always being there for me.
Thank you to my dear friend and fiancé, Peter Banko Jr., who always encouraged me to continue with my studies and put my needs before his own. He unselfishly
sacrificed many weekends to help with the editing, typing and data entry, and provided unconditional loving support throughout this whole process.
provided constant support through her prayers and encouragement.
I would like to thank my many friends who helped me through this entire
process. I would like to recognize and thank my friend and colleague, Susan Baker, who encouraged me from the beginning and made me believe that I could complete a terminal degree. Also, my friend, Joann Banik, who counseled me many nights over the phone and provided support even though she was a hundred miles away. Thanks to my friend, Lynn Hoggard, who took this journey with me, and encouraged and commiserated with me through every step in the process. I also appreciate the formatting advice and recommendations that I received from Jack Ellis while working on this dissertation. Finally, a special thank you to Lorelei Jones, EFNEP Coordinator, and the Program Assistants who helped with the collection of the data for this research. Without their willingness to accept this additional responsibility this research would not have been possible.
TABLE OF CONTENTS
page
LIST OF TABLES ...x
INTRODUCTION...1
Introduction...1
Out For Lunch...3
Expanded Food and Nutrition Education Program...4
Statement of the Problem...6
Significance of the Study...10
Limitations of the Study ...12
LITERATURE REVIEW ...13
History of the Expanded Food and Nutrition Education Program...14
History of Out For Lunch – A Food Stamp Nutrition Education Program ...15
Behavior Change and Nutrition Education...18
Barriers to Preparing Healthy Meals and Nutrition Education...25
Barriers to Fruit and Vegetable Intake and Nutrition Education ...29
Locus of Control and Nutrition Education...31
Rotter’s Theory ...31
Health Locus of Control ...32
Locus of Control and Nutrition...34
Locus of Control and Weight Loss ...35
Locus of Control and Minorities...36
Quality of Life and Nutrition Education...37
Socioeconomic Status and Nutrition...38
Socioeconomic Status and Environment ...42
Socioeconomic Status and Education ...43
Socioeconomic Status and Income ...46
Socioeconomic Status and Locus of Control ...48
Program Delivery...49
Motivators...49
Delivery Method ...51
Subject Matter for Programs...55
Recruitment...60
Barriers to Participation ...60
Delivery Logistics...62
METHODOLOGY ...64
Research Design...64
Table of Contents (continued) page
Measurement of the Variables ...69
Data Collection Process ...69
Data Analysis ...70
FINDINGS ...73
Profile of the Participants ...73
Behavior Change...80
Barriers to Preparing Healthy Meals...85
Quality of Life...90
Locus of Control ...91
Characteristics of Respondents in EFNEP and OFL ...99
Behavior Change with EFNEP and OFL ...106
Barriers to Preparing Healthy Meals with EFNEP and OFL...112
Quality of Life for EFNEP and OFL ...117
Locus of Control for EFNEP and OFL ...119
Range of Behavior Change for Frequency and Percentage Distribution for Low, Moderate and High Levels for EFNEP and OFL...127
Frequency and Percentage Distribution for Total Score for Barriers to Healthy Meals for EFNEP and OFL...129
Frequency and Percentage Distribution for Internal, Mixed and External Locus of Control for Total Participants EFNEP and OFL...130
Comparison of Mean Behavior Change Before and After Participation in EFNEP and OFL ...134
Comparison of Mean Barriers to Healthy Meals Before and After Participating in EFNEP and OFL ...137
Comparison of Mean Quality of Life Before and After Participating in EFNEP and OFL ...139
Comparison of Mean Locus of Control Before and After Participating in EFNEP and OFL ...141
Mean Difference in Behavior Change for Gender, Race, Age, Education, Marital Status, Number of Adults, Residence, Income and Employment ...143
Mean Difference in Barriers to Healthy Meals for Gender, Race, Age, Education, Marital Status, Number of Adults, Residence, Income and Employment ...156
Mean Difference in Quality of Life for Gender, Race, Age, Education, Marital Status, Number of Adults, Residence, Income and Employment ...167
Mean Difference in Locus of Control for Gender, Race, Age, Education, Marital Status, Number of Adults, Residence, Income and Employment ...177
Summary ...188
SUMMARY CONCLUSIONS, IMPLICATIONS AND RECOMMENDATIONS ...192
Purpose...192
Table of Contents (continued) page
Recommendations for Future Research...203
Recommendations for Nutrition Education Research...204
REFERENCES...206
APPENDICES ...216
Appendix A Consent Form ...217
Appendix B Behavior Change Instrument...219
Appendix C Barriers to Healthy Meals Instrument ...221
Appendix D Self-Anchoring Scale ...222
Appendix E Locus of Control Instrument...223
LIST OF TABLES
Page
Table 4.1 Frequency and Percentage Distribution of Respondents by Demographic
Factors for Total Respondents ...75 Table 4.2 Frequency and Percentage Distribution for Behavior Change for Total
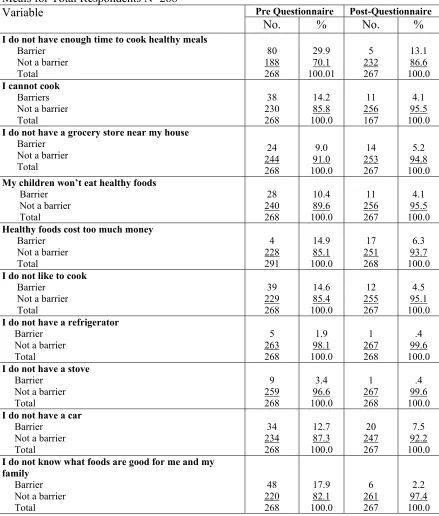
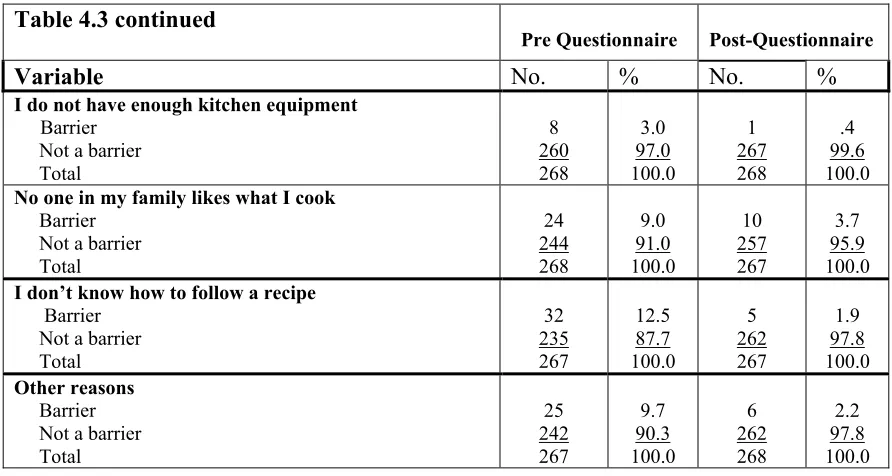
Respondents ...81 Table 4.3 Frequency and Percentage Distribution for Response to Barriers to Healthy
Meals for Total Respondents ...86 Table 4.4 Frequency and Percentage Distribution for Quality of Life for Total
Respondents ...91 Table 4.5 Frequency and Percentage Distribution for Locus of Control for Total
Respondents ...92 Table 4.6 Frequency and Percentage Distribution by Characteristics for Total
Respondents ...100 Table 4.7 Frequency and Percentage Distribution in Response to Behavior Change
For Total Respondents ...107 Table 4.8 Frequency and Percentage Distribution to Barriers for Healthy Meals
For Total Respondents ...113 Table 4.9 Frequency and Percentage Distribution for Quality of Life for Total
Respondents ...118 Table 4.10 Frequency and Percentage Distribution of Responses to Locus of Control
From Total Respondents...120 Table 4.11 Pre-Post Difference in Behavior Scores for all Respondents ...128 Table 4.12.Frequency and Percentage Distribution for Total Scores to Barriers for
Healthy Eating for Total Respondents...129 Table 4.13 Pre-Post Differences in Total Scores for Locus of Control for Total
Respondents ...130 Table 4.14 Pre-Post Differences in Locus of Control Total Scores from EFNEP
Tables (continued) page Table 4.15 Pre-Post Differences in Locus of Control for Total Scores for Respondents
in OFL...133
Table 4.16 Difference in Means Behavior Change from Total Respondents ...134
Table 4.17 Difference in Means Behavior Change with EFNEP Respondents...135
Table 4.18 Difference in Means Behavior Change with OFL Respondents...135
Table 4.19 Differences in Means Behavior Change for Total Scores for Respondents ...136
Table 4.20 Difference in Means Barriers to Preparing Healthy Meals for EFNEP...137
Table 4.21 Difference in Means Barriers to Preparing Healthy Meals for OFL ...138
Table 4.22 Difference in Means Barriers to Preparing Healthy Meals for Total Respondents ...138
Table 4.23 Difference in Means Quality of Life for EFNEP Respondents ...139
Table 4.24 Difference in Means Quality of Life for OFL Respondents...140
Table 4.25 Differences in Means Quality of Life for Total Respondents ...140
Table 4.26 Difference in Means for Locus of Control for EFNEP and OFL ...141
Table 4.27 Difference in Means for Locus of Control for EFNEP...142
Table 4.28 Difference in Mean for Locus of Control for OFL...142
Table 4.29 Differences in Means for Locus of Control for Total Respondents ...143
Table 4.30 Difference in Means Behavior for Gender for EFNEP and OFL Respondents...144
Table 4.31 Difference in Means Behavior for Race for EFNEP and OFL Respondents...145
Table 4.32 Difference in Means Behavior for Age for EFNEP and OFL Respondents...146
Table 4.33 Difference in Means Behavior for Education for EFNEP and OFL Respondents ...147
Tables (continued) page Table 4.35 Difference in Means Behavior for Number of Adults in Household for EFNEP
and OFL Respondents...150 Table 4.36 Difference in Means Behavior for Residence for EFNEP and OFL
Respondents ...151 Table 4.37 Difference in Means Behavior for Income for EFNEP and OFL Respondents...153 Table 4.38 Difference in Means Behavior for Employment Status for EFNEP and OFL
Respondents ...155 Table 4.39 Difference in Means Barriers to Healthy Meals for Gender for EFNEP and
OFL Respondents...157 Table 4.40 Difference in Means Barriers to Healthy Meals for Race for EFNEP and OFL
Respondents ...158 Table 4.41 Difference in Means Barriers to Healthy Meals for Age for EFNEP and OFL
Respondents ...159 Table 4.42 Difference in Means Barriers to Healthy Meals for Education for EFNEP and
OFL Respondents...160 Table 4.43 Difference in Means Barriers to Healthy Meals for Marital Status for EFNEP
and OFL Respondents...161 Table 4.44 Difference in Means Barriers to Healthy Meals for Number of Adults in the
Household for EFNEP and OFL Respondents...162 Table 4.45 Difference in Means Barriers to Healthy Meals for Residence for EFNEP and
OFL Respondents...163 Table 4.46 Difference in Means Barriers to Healthy Meals for Income for EFNEP and
OFL Respondents...164 Table 4.47 Difference in Means Barriers to Healthy Meals for Employment for EFNEP
and OFL Respondents...166 Table 4.48 Difference in Means Quality of Life for Gender for EFNEP and OFL
Respondents ...167 Table 4.49 Difference in Means Quality of Life for Race for EFNEP and OFL
Tables (continued) page Table 4.50 Difference in Means Quality of Life for Gender for EFNEP and OFL
Respondents ...169 Table 4.51 Difference in Means Quality of Life for Education for EFNEP and OFL
Respondents ...170 Table 4.52 Difference in Means Quality of Life for Marital Status for EFNEP and OFL
Respondents ...171 Table 4.53 Difference in Means Quality of Life for Number of Adults in the Household
for EFNEP and OFL Respondents...172 Table 4.54 Difference in Means Quality of Life for Area of Residence for EFNEP and
OFL Respondents...174 Table 4.55 Difference in Means Quality of Life for Income for EFNEP and OFL
Respondents ...175 Table 4.56 Difference in Means Quality of Life for Employment for EFNEP and OFL
Respondents ...176 Table 4.57 Difference in Means Locus of Control for Gender for EFNEP and OFL
Respondents ...178 Table 4.58 Difference in Means Locus of Control for Race for EFNEP and OFL
Respondents ...179 Table 4.59 Difference in Means Locus of Control for Age for EFNEP and OFL
Respondents ...180 Table 4.60 Difference in Means Locus of Control for Education for EFNEP and OFL
Respondents ...181 Table 4.61 Difference in Means Locus of Control for Marital Status for EFNEP and OFL
Respondents ...182 Table 4.62 Difference in Means Locus of Control for Number of Adults in Household for
EFNEP and OFL Respondents...183 Table 4.63 Difference in Means Locus of Control for Residence for EFNEP and OFL
Respondents ...185 Table 4.64 Difference in Means Locus of Control for Income for EFNEP and OFL
Tables (continued) page Table 4.65 Difference in Means Locus of Control for Employment for EFNEP and OFL
CHAPTER 1
INTRODUCTION
Enhanced nutrition is necessary for a healthy population. In our society the
incidences of obesity and many related chronic diseases are increasing, and guidelines
related to nutrition are now of greater interest for our population. Obesity is now close to
replacing tobacco as the leading cause of death. Researchers have predicted that if
something is not done to reduce the rate of overweight and obesity, the current generation
of children will be the first since the turn of the century to live a shorter life span than
their parents (Olshansky & Ludwig, 2005). Overweight is defined as a Body Mass Index
(BMI) from 25 to 30, and obesity is defined as a BMI greater than 30 (Duyfe, 2002).
Poor nutrition and an inactive way of life threaten the nation’s efficiency and economic
strength, our national defense and the overall health and quality of life for our citizens.
The costs are significant. Overweight, obesity and associated chronic diseases
cost over $100 billion every year, and that figure is increasing. Poor diets and physical
inactivity are estimated to be the factors in 310,000 to 580,000 deaths annually in the
United States from cancer, kidney, cardiovascular disease and diabetes (Smith, 2004).
In the past nutritionists were concerned about the inadequate intakes of certain
vitamins and minerals, resulting in nutritional deficiencies such as rickets, scurvy and
beriberi. Now the nutritional problems of Americans are the strong relationships between
nutrition and chronic diseases such as coronary heart disease, cancer, stroke and obesity.
Solutions for the problems are now concentrated on understanding an individual’s
The Healthy Eating Index (HEI) originated from the Federal Government’s
National Health and Nutrition Examination Survey (NHANES) to provide a measure of
food intake. The HEI score is based on 100 points with 10 categories each worth 10
points. An HEI score of over 80 implies a healthy diet, a score between 51 and 80 is a
diet that needs improvement and a score less than 51 is considered to be a poor diet. HEI
scores generally increase with higher levels of education and income. Among adults
during 1999-2000, those with more than a high school diploma had a higher mean HEI
score compared with a lower score for individuals without a high school diploma
(Baslotia, Carlson, Gerrior, Juan, & Lino, 2000).
People with a household income over 180 percent of the poverty threshold had a
higher mean HEI score (65) than did people with a household income below the poverty
threshold (61.7). Individuals in higher income families had better scores on grains,
vegetables, fruits, milk, meat and variety components of the HEI than people in lower
income households (Baslotia et al., 2000).
Gleason et al. (2000) indicated on average, low-income adults have lower dietary
knowledge levels than high-income adults. The high-income group is 10 to 20 percent
more likely than the low-income group to recall specific dietary information.
Low-income adults can properly recognize just over half of a set of health problems associated
with specific dietary practices such as eating too much fat or not enough fiber. More than
two-thirds of these adults know the consequences of being overweight, eating too much
fat and eating too much cholesterol, while only 40 percent know that not eating enough
fiber is associated with bowel problems, heart problems and cancer (Gleason,
Compared with higher income respondents, low-income participants with children
in the household were found to be less aware of the diet/disease relationships, less likely
to use the nutrition panel on the food label and when buying foods, are significantly less
likely to have low-fat and low-cholesterol eating practices. Low-income respondents
with children were more concerned with price, convenience and how well food keeps
than were higher income participants (Morten, 1997).
The Economic Research Services (ERS) explored the connections between
nutrition knowledge and food choices and established that nutrition education is a
worthwhile investment. They noted that in socio-economically matched individuals, a
one-point improvement on a nutrition knowledge scale correlated to a 7 percent
improvement in diet quality. In matched households, an improvement in the primary
meal preparer’s knowledge translates to a 19 percent improvement in household meal
quality (Hamilton & Rossi, 1995). Nutrition education is the center of the two programs
evaluated in this research. This study looked at the Expanded Food and Nutrition
Education Program (EFNEP) and Out For Lunch (OFL), a food stamp nutrition education
program, and evaluated the impact the two programs have on behavior changes with a
low-income population. The study also considered barriers low-income clients need to
overcome to preparing healthy meals, changes in perceived quality of life and increase in
internal locus of control after participating in the program.
Out For Lunch
Out For Lunch is an example of a nutrition education program that has
the past seven years. The Out For Lunch Program’s major goal is to provide educational
programs that increase, within a limited budget, the likelihood of making healthy food
choices consistent with the most recent dietary advice as reflected by the Dietary
Guidelines and the USDA Food Guide Pyramid. Lessons taught by paraprofessionals in
Out For Lunch focus on teaching limited-resource individuals and families in North
Carolina the skills needed to select, store, prepare and serve food safely and to adopt
economically sound shopping skills to prevent food insecurity.
The Out For Lunch Program is housed in 41 North Carolina counties with
programs provided by 39 Adult Nutrition Program Assistants and 23 Preschool Nutrition
Program Assistants. The primary audience continues to be young families, males and
females with children, who are receiving food stamps. However, an increasing number of
individuals ages 35-65, who have older dependent children living in the home, are
participating in the program.
Out For Lunch Program Assistants, teach an average of 5,000 food stamp
participants annually. The Out for Lunch Program offers four, four-hour group sessions
with an average of 12 participants per class. The clients, instructed in lessons on
nutrition, participate in the actual food preparation of three to four different recipes with
hands-on experiences.
Expanded Food and Nutrition Education Program
The fundamental objective of EFNEP is to promote sound nutritional principles
among low-income families. Unlike welfare and food assistance programs, EFNEP
focuses on nutrition and nutrition-related knowledge and skills. Rather than simply
knowledge of how to use the already available food and resources and the importance of
nutrition (Brink, 2000).
The success of EFNEP is credited to several factors. First is the use of the trained
paraprofessional, who is familiar with the community, to deliver the lessons. The use of
former EFNEP participants as program volunteers is another factor in the success of
EFNEP. The program tailors educational efforts to the needs of the individual or the
group therefore meeting the needs and wishes of the participants (Randall, Brink, & Joy,
1995).
In North Carolina EFNEP is located in 55 counties with 40 Adult Program
Assistants and 15 Youth Program Assistants. Methods of delivery may include direct
teaching in groups or one-to-one situations. The hands-on, learn-by-doing approach
allows the participants to gain the practical skills necessary to make positive behavior
changes. EFNEP reaches over 4,200 individuals with 87 percent of the participants
taught in groups and the remainder taught in individual sessions. EFNEP is delivered as
a series of 6 to 12 lessons averaging 30-45 minutes each, over several months. Program
Assistants demonstrate how to prepare a recipe and offer samples to taste.
The education of low-income individuals on the benefits of healthy eating and
improving their quality of life has been the goal of two nutrition programs housed in the
Family and Consumer Science Department of North Carolina Cooperative Extension at
North Carolina State University. Cooperative Extension, part of the College of
Agricultural and Life Sciences Department, carries this charge forward for the university
The two programs involved in this effort, the Expanded Food and Nutrition
Education Program (EFNEP) and the Out For Lunch Program (OFL) have provided
nutrition education for low-income clientele for several years. However, to this date
neither program has determined if participants are able to overcome barriers that prevent
them from preparing healthy meals, if their quality of life improves or if the participants
feel that they have more internal control after participating in EFNEP or OFL classes. In
this research, the above constructs were explored.
Statement of the Problem
According to the report Dietary Intake and Dietary Attitudes Among Food Stamp
Participants and Other Low-Income Individuals compiled in September 2000, there are a
large number of low-income adults who are not aware of specific facts related to the
health consequences of particular dietary practices. Specifically, on average low-income
adults can correctly identify just over half of a set of health problems associated with
definite dietary practices such as eating too much fat or not getting enough fiber. On
average low-income adults know less than half of the Food Guide Pyramid
recommendations for intake of the five major food groups, including receiving at least six
servings of grain products and three servings of vegetables daily (Gleason et al., 2000;
Gleason, Rangarajan, & Olson, 2002; Rogers, Simon, Lucker, J., & Newman, 1995;
Rogers, Simon, Zucker, Mackessy, & Newman-Palmer, 1995).
The prevalence of obesity is greatest among low-socioeconomic status
individuals, particularly among low-income women living in the South (Townsend,
disease, and the leading factor for the development of diabetes. (Murphy, Townsend,
Peerson, & Rose, 1998).
Monroe and colleague’s (2002) study with 32 low-income women in the south
also found a high level of obesity and overweight with an average BMI for the group at
27.54. The research concluded that participants had poor diets even though few of them
reported food insecurity or hunger. Their eating habits are an example of a typical
unchanged “Southern diet” with a strong emphasis on fats (fried foods, fat meats eaten
and used as seasoning), starches and large quantities of food when food is available.
They also depended on fast foods and had little variety of fruits and vegetables and
scarcely any dairy products (Monroe, O'Neil, Tiller, & Smith, 2002).
Research supports that low-income clients have poorer diets and present with
more chronic diseases (Gleason et al., 2000). Poor intake of fruits and vegetables leads to
an individual being deprived of nutrients from these foods and at greater risks to chronic
disease. (Kubena & McMurray, 1996) Obesity is evident in the low-income population
and programs that encourage participants to change their dietary intake and decrease the
incidences of food insecurity will promote changes for low-income clients. Nutrition
educators need to consider techniques to encourage participants in their programs to
conquer the day-to-day problems they encounter and encourage changes in their lives.
Working with clients who are overweight is a challenge for nutrition educators
since the consequences of being overweight may be much less negative for some black
women than for white women. Although there is a concern about being overweight and
weight loss may not support weight loss efforts among black women, particularly after
age 45 (Kuchler & Jayachandran, 2002)
Low-income individuals face many barriers to preparing healthy meals for their
families. Shanker and Klassen (2001) conducted a focus group with WIC (Supplemental
Program for Women’s Infant and Children’s) to identify barriers for making positive
behavior changes in fruit and vegetable consumption with low-income white women.
The focus group stated cost, storage space, time and difficulty in changing both personal
and family food behaviors as barriers for fruit and vegetable consumption by their
families. (Shankar & Klassen, 2001). Specific data on these barriers needs to be explored
for this targeted population. A study of the prevalence of such barriers to the limited
resource population within the counties of North Carolina will provide specific data to
aide in the design and development of nutrition educational programs and social
marketing messages to help low-income individuals overcome the barriers preventing
positive choices.
Historically low-income clients feel as if they do not have internal control over
their lives, but are influenced by outside forces or powerful others in their lives. This
research examined the relationship of locus of control and the intervention of the EFNEP
and Out for Lunch Programs to establish if nutrition knowledge and hands-on
intervention encourages low-income individuals to demonstrate more internal control
over their lives after participating in the programs. By demonstrating internal control, it
may be probable that EFNEP and OFL participants will formulate healthier choices and
Locus of control theory differentiates between internal and external locus of
control as crucial adoption of a new behavior (Rotter, 1966). The theory promotes that
individuals learn to recognize that reaching a particular goal for reward or behavior is
mostly within their control or outside their control.
Locus of control is believed to be an important factor in explaining health
behavior in that the more a person feels powerless to control his/her life, the less likely
he/she is to comply with officially recommended health actions (Murimi, 2001). Locus
of control has been used mainly with weight loss and obesity in the area of nutrition. A
limited amount of research has focused on locus of control with nutrition education with
the low-income population. This research explored this area to determine if nutrition
education programs should address this construct to help low-income clients to improve
their internal locus of control.
Quality of life was a construct examined in this research. In order to participate in
the Out for Lunch Program or EFNEP, participants are on food stamps or at 180 percent
of the poverty level. According to the U.S. Census Bureau in North Carolina, in the year
2000 all ages in poverty was 12.9 percent, and families with children 0-17 years of age,
16.5 percent were in poverty ("2002 indicators of welfare dependence", 2003).
Socioeconomic status (SES) influences how individuals make decisions related to
healthy food choices and obesity. Wardle and Steptoe (2003) concluded lower SES was
associated with less health consciousness (thinking about things to do to keep healthy),
stronger beliefs in the influence of chance on health, less thinking about the future and
This research evaluated changes in the quality of life of clients after participating
in EFNEP or the Out for Lunch Program. The author suggested that after participating in
the program, EFNEP or OFL, clients gained more confidence and demonstrated a
perceived better quality of life.
Significance of the Study
This study is designed to demonstrate the impact of nutrition education with
low-income clients participating in two nutrition education programs, EFNEP and OFL. The
two programs are dedicated to providing research-based information to low-income
clients. From this commitment comes the need to improve the diets of low-income
clients with the hope they will also perceive they have a better quality of life.
Knowing how to help clients make behavior changes, understanding the barriers
that prevent them from preparing healthy meals and helping participants improve their
quality of life, and develop an internal locus of control will provide the groundwork for
improving nutrition education programs. This study of the limited resource population
within the counties of North Carolina will provide specific data to aide in the design and
development of nutrition educational programs, and better equip paraprofessionals to
provide families with the information they need to improve their dietary intake for
themselves and their families.
Traditionally low-income clients perceive that external forces control their life.
By helping participants increase their internal control, it is possible that EFNEP and OFL
participants will formulate healthier choices, and will not be dependent on powerful
Finding the most effective and efficient method of delivery for nutrition education
is a challenge for educators. This research looked at the two methods of program delivery
of EFNEP and Out For Lunch, to determine impact for each program.
The purpose of this study was to answer the following Research Questions:
1. Do participants change behavior after participating in EFNEP or OFL?
2. Are participants able to overcome barriers that prevent them from preparing
healthy meals after participating in EFNEP and OFL?
3. Do participants demonstrate an increase in their quality of life after
participating in EFNEP or OFL?
4. Do participants increase their internal locus of control after participating in
EFNEP or OFL?
5. What effect, if any, does the method of program delivery have on change in
behavior, overcoming barriers to healthy meals, an increase in internal locus
of control and quality of life after participating in EFNEP or OFL?
More and more research supports the importance of a healthy diet in the
prevention of chronic diseases. The 2005 U.S.D.A. Dietary Guidelines encourages
individuals to eat a diet that is lower in fat, includes whole grains, contains four to five cups
of fruits and vegetables and three low-fat dairy products daily, and increase their activity to
maintain or lose weight ("Dietary guidelines for Americans 6th edition", 2005). An
effective in helping low-income participants make behavioral changes that comply with the
dietary guidelines to further behavior change leading to enhanced quality of life.
Limitations of the Study
This study was limited to the population of EFNEP and OFL programs in North
Carolina; therefore, the findings cannot be generalized to other low-income programs in
other states. In addition, the questions were self-reporting and may not reflect the true
situation of the respondent. Although respondents were encouraged to answer the
questions to the best of their ability, there is no way to determine if the answers were an
accurate and honest response.
The Program Assistant teaching the class administered the questionnaires. The
peer educators differed in terms of how effectively they related to their participants, how
enthusiastic they were in presenting the questionnaire, and how well they conducted the
nutrition session. These variations in the Program Assistants abilities and performance
without a doubt influenced participant’s responses. Respondents may not have answered
honestly, because they did not want their response to reflect on the Program Assistant.
Another limitation to the study was there was not equal participation from both
programs with OFL having a larger number of respondents, and the sample size was
CHAPTER 2
LITERATURE REVIEW
Nutrition education and its influence on health and survival have greatly increased
over the last twenty years. The new 2005 Dietary Guidelines, which provide the
scientific research for MyPyramid ("Dietary guidelines for Americans 6th edition",
2005), are examples of the federal government’s effort to provide scientific-based
nutrition information for the consumer and encourage healthy eating practices. Even
with progress towards implementing the Dietary Guidelines for Americans, many
consumers, especially low-income individuals, are still not consuming enough fruits and
vegetables, whole grains and dairy products (Morten, 1997; Quan, Salomon, Nitzke, &
Reicks, 2000). Developing a better understanding of consumers’ food and nutrition
related knowledge, attitudes and practices is the first step in changing dietary behavior.
This study examined two programs serving low-income clients, the Expanded
Food and Nutrition Education Program (EFNEP) and the Out For Lunch Program, a
federally funded Food Stamp Nutrition Education Program, to evaluate changes in
nutrition knowledge and behavior, locus of control, quality of life and barriers for
preparing healthy meals confronted by this population. The research also looked at the
method of delivery to determine which program would be more suitable to meeting the
This chapter contains a history of EFNEP and OFL, a review of the literature, and
what the research suggests are the results of nutrition education on behavior change,
barriers to preparing healthy meals, quality of life and locus of control. The research
related to program delivery is also included in this chapter
Background
History of the Expanded Food and Nutrition Education Program
The Expanded Food and Nutrition Program (EFNEP) is a nutrition education
program administered by the Extension Services of the United States Department of
Agriculture (USDA). The program utilizes paraprofessionals to deliver basic food and
nutrition information to low-income families.
By the early 1900’s United States Government, leaders were attempting to address
the issue of malnutrition in this country. The attention of concerned Americans turned
toward the plight of less fortunate Americans. One of the most shocking realizations was
that in the midst of the land of plenty; children were going to bed unfed. A country that
had provided food for millions of people in other countries had somehow managed to
overlook the hunger of its own citizens. In this environment of concern the Expanded Food
and Nutrition Education Program was created (U.S. Department of Agriculture, 1975).
Supplemental programs were established to address the nutritional needs of the
low-income population including the Food Stamp Program (FSP), the Department of
Agriculture’s Supplemental Food Program (CSEP), the Special Supplemental Food
Program for Women Infants and Children (WIC) and the National School Lunch Program
(NSLP). The establishment of these and other supplemental food programs provided
families participating in food assistance programs were still nutritionally at risk. Harris
(1984) described the realities faced by low-income African-Americans. She stated there is
a need for “culturally specific nutrition education to meet the needs of high-risk groups:
adolescent mothers, isolated elderly and the single female-headed household” (Harris,
1984).
After five pilot programs conducted by the Extension Service, the Alabama Project,
which utilized paraprofessionals to teach nutrition education to low-income homemakers,
proved to be the most successful. The experience from this pilot program demonstrated
that persons indigenous to the community and of the same economic level had a greater
potential to establish understanding and to communicate with potential participants.
Employment of paraprofessionals proved to be an effective cost-efficient strategy to reach
and teach nutrition education to low-income families. In August of 1968 the Federal
Extension Service (FES) initiated an extensive nutrition education program with
low-income families. As a result, the USDA provided $10 million to the Cooperative Extension
Service in November of the same year and EFNEP was born (U.S. Department of
Agriculture, 1975).
History of Out For Lunch -A Food Stamp Nutrition Education Program
Since the mid 1940’s the U.S. Government has committed to ensuring that its
citizens neither go hungry nor suffer the consequences of inadequate dietary intake.
Today the USDA implements 15 programs as a “food safety net” to provide low-income
citizens with food or the means to purchase food (Hamilton & Rossi, 1995).
The Food Stamp Program (FSP) is designed to safeguard the health and
households. The proportion of food stamp households with earnings has increased from
about 20 percent for most of the 1980’s and early 1990’s to 27 percent in 2000. At the
same time, the proportion of households with income from Temporary Assistance for
Needy Families (TANF) has declined from 42 percent in 1984 to 26 percent in 2000
following the decline in TANF caseloads. Over half of all food stamp households have
children, and the majority of households (89%) have incomes below the poverty level
("2002 indicators of welfare dependence", 2003).
The FSP provides food stamp benefits to low-income households, which can be
used to purchase food from authorized retail dealers. Benefits are awarded to
participating families to ensure they have the resources to purchase an adequate supply of
nutritious foods. Food stamp benefit amounts are the difference between 30 percent of a
household’s net income and the Thrifty Food Plan (TFP) amount based on household
size. The TFP is a low-cost food plan designed to provide a nutritionally adequate diet
for most households, while conforming as much as possible to the usual diets for
low-income families(Bradbard, Michaels, Fleming, & Campbell, 1997).
Nutrition education is an important part in the Food Stamp Program. Nutrition
education teaches individuals to make healthier choices and stretch their food dollars to
feed their families. The goal of Food Stamp Nutrition Education is to provide
educational programs that increase, within a limited budget, the likelihood of all food
stamp recipients making healthy food choices and choosing active lifestyles consistent
with the most recent advice reflected in the dietary guidelines (Winicki, Joshua, &
Under the current regulations, states can choose if they want to provide nutrition
education to food stamp recipients as part of their program operations. Nutrition
Education is an optional program, but states are encouraged to provide nutrition
education for food stamp participants. To secure the funds the United States Department
of Agriculture (USDA) reimburses the state for 50 percent of the allowable
administrative costs to operate the education program. The number of state agencies with
approved Nutrition Education Plans increased from seven in 1992 to 50 state agencies in
2003. Federal funds approved for Food Stamp Nutrition Education also grew from
$661,000 in 1992 to over $192 million in 2003 ("Nutrition program facts: Food stamp
nutrition education", 2004).
States provide a variety of Food Stamp Nutrition Education Programs across the
United States targeting low-income clients of all ages. Cooperative Extension Service
(CES) is the primary agency contracted to provide Food Stamp Nutrition Education.
Other agencies include public health departments, welfare centers, universities of higher
learning, and nutrition education networks.
The USDA’s Food and Nutrition Service (FNS) provides guidance and direction
for the states to encourage the most useful nutrition teaching tools and approaches
available. FNS requires the states to focus on four core elements including food security,
food safety, dietary quality, and food resource management as well as shopping and
behaviors.
At the cornerstone of the USDA nutrition assistance programs, the Food Stamp
Program (FSP) plays a critical role in helping improve nutrition education among
education to food stamp recipients as part of their program operations. The goal of Food
Stamp Nutrition Education (FSNEP) is to improve the diets of food stamp recipients
through nutrition education activities that increase self-sufficiency.
Fifty-one percent of individuals between the ages of 20 and 65 will participate in
the Food Stamp Program. In addition, individuals who use food stamps are likely to do
so at several points across the life span. The fact that approximately half of all adults will
use the Food Stamp Program illustrates the widespread reach of this federal food
assistance program. Race and education have an impact on the use of food stamps.
Being black and not graduating from high school substantially raises the likelihood of
turning to federal food assistance programs (Rank & Hirschl, 2005). In North Carolina
47 percent of the population is eligible for food stamps with over 500,000 blacks with a
median family income of $18,750 (CDC, 2002).
Behavior Change and Nutrition Education
We could assume that higher levels of nutrition knowledge and positive attitudes
toward nutrition would result in healthier choices. The relationship between nutrition
knowledge and dietary behaviors is a subject of controversy. Although some studies
have identified positive associations between knowledge and dietary behavior, others
have not (Axelson M.L., Federline T.L., & Brinberg D., 1985; Jeffrey & Pirie, 1982). A
review of nutrition education research and intervention in the United States since 1980
supports the effectiveness of nutrition education for the public. The most effective
programs are those that are behaviorally focused and theory based (Contento et al., 1995;
Lower-income adults appear to have lower levels of dietary knowledge than
higher-income adults. They are less likely to know specific facts about the health
problems associated with particular dietary practices such as the Food Guide Pyramid,
recommendations for food group consumption and the fat/cholesterol content of
particular foods. In contrast, the nutrition knowledge of food stamp participants and
low-income non-participants is very similar. There are no significant differences between
these groups in their nutrition knowledge (Kantor, 1998; Sapp, 2002).
Although EFNEP has been shown to be effective in improving diet quality among
low income consumers, only a small percentage of food stamp participants are involved
in EFNEP (Morten, 1997). Studies have found that provisions of food stamps will not
achieve the goals for which the food stamp program was established, and additional
resources provided by the Food Stamp Program alone may not substantially change
participants’ dietary intake (Cason, Cox, Burney, Poole, & Wenrich, 2002; Wolman,
Stallings, Meacham, & Goodner, 1994). For low-income women, participation in the
Food Stamp Program is associated with a 9.1 percent increase in the predicted probability
of obesity. Participation in the Food Stamp Program for five years, compared to no
participation in the program, was associated with approximately a 20.5 percent increase
in the predicted probability of current obesity (Gibson, 2003; Townsend, Peerson, Love,
Achterberg, & Murphy, 2001).
Butler and Raymond indicated that adequate income was not a guarantee of
adequate nutrition and reported “even rudimentary knowledge of nutrition” can increase
nutrition skills that mirror the Dietary Guidelines for Americans and the Food Guide
Pyramid (Anding, Fletcher, Laanen, & Supak, 2001).
Several studies with EFNEP suggest improvements in food budgeting, food
preparation and planning, and food and nutrient intake after participating in EFNEP
(Burney & Haughton, 2002; Cason et al., 2002; Contento et al., 1995; Del Tredici, Joy,
Omelich, & Laughlin, 1988; Schuster et al., 2003). Food shopping skills taught in
nutrition education programs with participants from EFNEP and Food Stamp Programs
demonstrated statistically significant relationship between careful food shopping
practices and nutrient availability (Hersey et al., 2001). Participants in a Welfare To
Work Program reported a greater degree of confidence in managing resources, which
included a 9 percent increase in managing food money and food stamps and a 7 percent
increase in maintaining food resources (Smith, 1998). EFNEP clients who kept a
shopping list and estimated food expenditures from recalls saved significantly more on
food expenditures than did participants who estimated food expenditures and did not
receive nutrition education (Burney & Haughton, 2002).
Arnold and Sobal’s research reported similar findings, but they also indicated that
increased nutrition knowledge and healthier eating practices did not lead to
corresponding nutrient intake changes. Almost all participants reported their families
were healthier after they graduated from EFNEP, indicating their families had more
energy and fewer illnesses. Additional changes beyond food and nutrition occurred in
education, employment and health and community involvement (Arnold & Sobal, 2000;
Brink & Sobal, 1994). Knowledge, attitude and beliefs were more strongly related to the
conducted by Smith et al. In this study, in which knowledge was conceptualized in
relation to food choices rather than more abstract concepts such as nutrient levels,
knowledge was a strong predictor of behavioral changes (Smith, Baghurst, & Owen,
1995).
In comparison of two groups with one receiving EFNEP instruction and one
control group, EFNEP produced highly significant changes in behavior, knowledge and
attitude as well as dietary habits. The major impact was in milk consumption and in fruit
and vegetable consumption. In both of these food groups participants increased their
consumption to the ideal serving size (Block, 1985). Working with mother/daughter
dyads in an obesity prevention program, Fitzgibbon (1995) and colleagues suggested that
changes in knowledge and behavior may occur with a six-week obesity prevention
program for a poverty-level African-American group of mothers and daughters
(Fitzgibbon, Strolley, & Kirschenbaum, 1995). Fidalgo (1988) and associates found an
increase in knowledge, behavior and attitudes with an Hispanic population. (Fidalgo &
Chapman-Novkofski, 1988).
Research by Torisky (1969)also supported improvements in average servings
from milk and the fruit and vegetable groups (Torisky et al., 1969). Other research
confirmed increased intakes in milk, protein and fruit and vegetable food groups with
EFNEP participants (Amstutz, 1982; Del Tredici et al., 1988). Graduates in EFNEP had
significantly decreased their intake of fats (Stack & Cox, 1997), sweets and alcohol
despite a decline in purchasing power (Del Tredici et al., 1988). However, Cason et al.
In a longitudinal study by Nierman, (1986) EFNEP participants’ 24-hour recall
scores increased significantly due to EFNEP participation. Retention of these changed
scores for five years was also significant (Nierman, 1986). However, results from Brink
(2000) on 24 hour recall indicated the Recommended Dietary Allowances (RDAs) for
three macronutrients and five of the micronutrients did not change significantly (Brink,
2000). Similar results were found between graduation and follow-up for protein, calcium
and vitamin A. Intakes declined but were within acceptable ranges of the RDAs (Brink
& Sobal, 1994). Other studies have suggested that EFNEP participants are still not
consuming the recommended number of servings from the grain, dairy, fruit and
vegetable groups (Keefe, 1988; Luccia, Kunkel, & Cason, 2003).
Graduate EFNEP homemakers in South Carolina consumed over 100% of the
RDAs for protein, vitamin A, vitamin C and vitamin B6, but they did not meet the RDAs
for calories, iron and calcium (Doeleman, Kunkel, & Cason, 1998). Research by Reemps
(1983) and colleagues with 310 EFNEP participants suggested that homemakers
maintained their meat intake and significantly increased their milk, bread and cereal and
fruits and vegetables when compared to 140 low income individuals who were not
participating in EFNEP (Reemps, Caster, & Pesiher, 1983).
Crayton’s (1991) research with EFNEP clients indicated nutritional intake
improvement with older participants. The 15-18 year olds did not meet two-thirds for the
RDAs for several of the nutrients studied. The 19-24 year olds showed continued and
steady improvement up to the fourth recall. The 25-50 year olds showed little gain from
meet two-thirds of the RDAs for iron and showed continuous improvement in their
nutrition intake up to the fourth food recall (Crayton, 1991).
Research with EFNEP and cancer participants demonstrated a decrease in fat and
an increase in dietary fiber and vitamin C. Individuals receiving EFNEP lessons only,
decreased their fat intake and increased vitamin E intake. Intakes of calcium, folate and
vitamins A and E increased among those participating in the cancer-prevention programs
and those receiving EFNEP lessons only, but the changes were not significant (Cox et al.,
1995).
After participating in a food stamp education program, a greater percentage of
clients planned meals ahead of time, compared prices when buying food, reported
running out of food less often before the end of the month and shopped with a grocery
list. They also refrigerated meat and dairy products within two hours of serving, thawed
foods correctly, thought of healthy foods when preparing meals for their families and
used the nutrition facts label to make food choices (Cason et al., 2000).
Investigation of the fruit and vegetable intake with the low-income population
suggested education was found to affect consumption behavior indirectly through its
impacts on attitude. Coupons directly affected consumption behavior but did not affect
attitude toward fruits and vegetables directly or indirectly. Coupons showed a stronger
impact on consumption behavior than education. Both the coupons and education were
effective in changing attitude and behavior in this study (Anderson J. et al., 2001).
Knowledge and awareness of dietary recommendations have consistently been
al., 1998). A Market Basket Booklet improved mothers’ confidence in handling fresh
produce and encouraged them to serve fruits and vegetables more frequently, but did not
reduce overall barriers related to fruits and vegetables or increase fruit and vegetable
consumption with WIC clients (Birmingham, Schultz, & Edlefsen, 2004).
Recent reviews have indicated that behavioral theory-based nutrition education
programs are more successful at achieving food behavior change than knowledge-based
programs. Research on goal setting for dietary change among adults suggests that
goal-setting procedures are likely to lead to change (Contento, Balch, & Bonner, 1995;
Contento et al., 1995; Cullen, Baranowski, & Smith, 2002; Derrickson, Buchanan, Kaui
Asing, & Okuma, 2003). Studies suggest nutrition education programs for low-income
clients should appreciate and build on existing abilities of participants and provide
opportunities for self-directed learning and activities, and build social support, networks
and trust among participants (Arnold, Ladipo, Nguyen, Nkinda-Chaiban, & Olson,
2001). A comprehensive review of interventions by Randell (1995) found that nutrition
education works and is a significant factor in improving dietary practices when
behavioral change is set as the goal, and the educational strategies used are designed with
that as a purpose (Randall et al., 1995).
Studies by Reed (1996) suggested basic nutrition knowledge about topics such as
serving sizes and how to read food labels is needed. Receiving new information related
to diet and various diseases and observing the health problems of family members
motivated mothers in this study to make changes in their diet (Reed, 1996). Focus groups
learning, and menus were convenient, low cost, healthy and met children’s tastes
(Shankar & Klassen, 2001).
Low-income parents exhibit more concern about feeding their children a healthy
diet than what they eat themselves. Focus groups with WIC clients conducted by
Treiman (1996) indicated it was sometimes more difficult to keep the discussion focused
on the women’s eating habits as they were more concerned about what to feed their
children. Another area of interest with this group was that women were concerned about
nutrition during pregnancy, but concern lessened soon after delivery (Treiman et al.,
1996).
A comparison of EFNEP and FSNEP suggested that the two programs were
equally effective in bringing about significant improvements in intakes of nearly all food
groups and nutrients in both food stamp and non-food stamp recipients. The only
differences were that participation in EFNEP seemed to result in an undesirable increase
in fat intake, whereas participation in FSNEP did not. In addition, the food stamp
participants made significantly greater gains on intake of fruits and vitamin C than
EFNEP and greater gains on intake of vitamins A and B6. This suggests that food stamp
recipients may benefit slightly more than non-food stamp recipients from nutrition
education with some nutrients; however, both groups were very positively impacted by
the nutrition education provided by EFNEP and FSNEP (Cason et al., 2000).
Barriers to Preparing Healthy Meals and Nutrition Education
Clients participating in EFNEP and OFL Programs confront many barriers that
Food Intake of Individuals, overall scores from the Dietary Adequacy Score results were
lower in women below the federal poverty index than those from the total population
(Baslotia & Guthrie, 1995). The lowest income households decreased their consumption
of fresh vegetables by 22 percent compared with a reduction of 12 percent of the higher
income households. Larger households, with more children, consume less food per
person than do smaller households (Lutz, Blaylock, & Smallwood, 1993). Lappalainen
and colleagues (1998) observed that individuals with less education reported more
barriers than individuals with a higher education (Lappalainen, Koikkalainen, Julkunen,
Saarinen, & Mykkanen, 1998).
Children’s preference plays an important part in food selection for mothers in
low-income families, and children’s preferences for unhealthful food options proved to
be a major barrier. (Shankar & Klassen, 2001). When conducting focus groups with WIC
clients, Birkett and colleagues (2004) supported that parents were not sure how to buy,
prepare or introduce healthier foods to children. Parents were also unsure what was
appropriate for children at different ages and how to be physically active with their
children. Key barriers to change with the focus groups included inadequate parenting
skills, lack of knowledge, unhealthy social environments, lack of time and lack of social
support or financial support (Birkett, Johnson, Thompson, & Oberg, 2004). Mothers
believed it would be easier to encourage increased vegetable consumption in their
children if fathers would model this behavior (Reed, 1996; Reicks, Randall, & Haynes,
1994).
Focus groups with Hispanic food stamp participants suggested that children
present when their mothers were shopping (Hampl & Sass, 2001). Relatives and friends
were also considered to be important influences on children, both positive and negative,
on food choices (Reed, 1996). Coveney and colleagues’ (2002) research suggests that
men (husbands or partners) have exerted an influence over what food is actually
provided, but more recent research indicates that children play an important part in
determining family food habits and purchases (Coveney, 2002).
EFNEP participants cited similar barriers including extra time and money needed
to purchase and prepare healthful foods, food preference by family members, lack of
interest and skills in cooking and insufficient knowledge about which foods are healthful
(Hartman, McCarthy, Park, Schuster, & Kushi, 1994; Reicks et al., 1994; Treiman et al.,
1996). The most frequently cited barriers to healthful eating by Eikenberry (2004) were
time and financial considerations (Eikenberry & Smith, 2004). Nestle and colleagues
(1998) also reported that economic considerations served as barriers to meeting dietary
requirements (Nestle et al., 1998). Bradbard (1997) reported lack of time as a barrier
along with ethnic pressure and children’s preferences (Bradbard et al., 1997). Along with
time and money as physical barriers, Povey and colleagues (1998) also described
psychological barriers such as the individuals’ inability to assess the healthiness of their
own diet (Povey, Conner, Sparks, James, & Shepard, 1998). Smith and Owen (1992)
indicated another barrier was food eaten by friends and family (Smith & Owen, 1992).
Molaison and colleagues (2005) focus groups with low-income African-American
adolescents indicated taste was a barrier for fruit and vegetable consumption. The sweet
grandparents, who grew vegetables; and this may explain why grandmothers in the study
were identified as having a strong influence on fruit and vegetable consumption
(Molaison, Connell, Stuff, Yadrick, & Bogle, 2005).
African-Americans identified negative taste as a barrier to the consumption of
high-calcium foods such as milk, cheeses and yogurt (Zablah, Reed, Hegsted, & Keenan,
1999). Similarly, Glanz and colleagues (1998) found that taste and cost are most
influential on food choices (Glanz, Basil, Maibach, Goldberg, & Snyder, 1998).
Perceived barriers such as cost and availability were more significant in the low-income
population than in populations with higher incomes (Havas et al., 1998; Lappalainen,
Koikkalainen, Julkunen, Sarinen, & Mykkanen, 1998; Treiman et al., 1996; Zenk et al.,
2005).
Working families lack the time needed to shop for and cook a full meal, and it is
even harder for a single-parent household to find time. This lack of time can lead to
quick trips to the closest fast food restaurant. A study in the International Journal of
Obesity suggested that people of color eat fast food more often than whites. Low-income
and minority neighborhoods are less like to have supermarkets, and individuals are forced
to shop at more expensive, poorer quality corner stores and convenience marts (Leff,
2002).
Dibsdall’s (2003) research with low-income clients indicated that two-thirds of
participants did not think that lack of money prevented them from eating a healthy diet,
73 percent of participants strongly or moderately believed they ate healthy anyway. Of
half of them also though the lack of money prevented them from eating healthy (Dibsdall,
Lambert, Bobbin, & Frewer, 2003).
Barriers to Fruit and Vegetable Intake and Nutrition Education
Low-income populations have lower levels of fruit and vegetable consumption
than do higher income populations. Several factors affect consumption of fruits and
vegetables by low-income families. Intervention approaches for low-income clients must
be taken into consideration and address barriers to purchasing, preparing and consuming
fruits and vegetables.
Working with clients with low literacy skills, Macario (1998) cited several
barriers to eating a healthful diet such as cost of fresh fruits and vegetables, time needed
to prepare healthful dishes, perceived unpalatably of a prudent diet, ease of eating
unhealthy food at a fast food restaurant and from vending machines and concern that
some canned foods may cause cancer. Participants also emphasized the difficulty of
eating a balanced diet with their erratic work schedules (Macario, Emmons, Sorensen,
Hunt, & Rudd, 1998). Quan and colleagues (2000) also established that cost was the
most important factor affecting food choices. Other factors included lack of availability,
time and the effort to prepare and eat fruits and vegetables, a dislike for them or a
preference for other foods (Quan et al., 2000). Shankar and Klassen (2001) found cost
and time to be barriers, but also reported childhood memories of being forced to eat
vegetables were deterrents to requiring their children to eat adequate amounts of
vegetables (Shankar & Klassen, 2001). Cost and time related to fruits and vegetables
Treiman et al.(1996) also indicated barriers with WIC clients including lack of
availability of fruits and vegetables, time and effort to prepare and preference for other
foods (Treiman et al., 1996). Using a Likert scale with WIC families, Schultz and
colleagues (2004) suggested most respondents (65%) agreed that they avoided serving
fresh fruits and vegetables because they take too much preparation time. There was an
agreement among many (54%) that canned or frozen fruits and vegetables are easier to
prepare than fresh. Most respondents (65%) agreed that fresh fruits and vegetables are
too expensive to buy compared to canned or frozen (Schultz & Edlefsen, 2004). WIC
participants contributed their lack of knowledge to lack of support from partners and
family members to encourage fruit and vegetable consumption (Birkett et al., 2004).
Cost, cooking skills, lack of social support and childhood eating patterns were
stated as reasons for not increasing fruit and vegetable consumption in
African-Americans, with cost cited as the primary structural barrier. They identified some fruits
and vegetables as more economical than others, but believed fruits and vegetables overall
were costly compared with other foods (Shankar & Klassen, 2001).
The most frequently cited barriers for buying new fruits and vegetables were
knowing if the fruits and vegetables taste good, cost, and a desire to “stick to what I like”.
The major barriers to eating fruit for a snack were lack of availability, preference for
other foods and time and effort to prepare and eat fruit (Treiman et al., 1996). Henry et
al. (2003) also listed the major factors influencing decision making associated with fruit
and vegetable purchasing and preparation were preferences, cost and specific needs and
wants for different fruits and vegetables. Other important factors included availability,
concerns (Henry et al., 2003). Balch and colleagues (1997) found price, taste and
convenience to be both benefits and barriers for consuming fruits and vegetables. Most
participants mentioned (good) price, taste and convenience as benefits they received from
buying and eating fruits and vegetables. They mentioned these same factors when asked
why they did not eat more fruits and vegetables (Balch, Loughrey, Weinberg, Lurie, &
Eisner, 1997).
Locus of Control and Nutrition Education
Locus of control, a construct resulting from Rotter’s Social Learning Theory, has
received a significant amount of attention in behavioral research. The role of
reinforcement or reward is established as an important one in the achievement and
implementation of skills and understanding. However, others may view circumstances
considered by some individuals as a reward differently. One of the determinants to this
reaction is the degree to which the individual recognizes that the reward depends upon his
own behavior or traits versus the degree to which he feels the reward is controlled by
outside forces and may take place independently of his own dealings.
Rotter’s Theory
The result of a reinforcement following some behavior by an individual is not a
simple automatic process but depends upon whether or not the person perceives a causal
connection between his own behavior and the reward. A perception of causal
relationship can vary in degree. When a reinforcement is perceived by the individual as
following some action of his own but not being entirely dependent upon his action, then it