ABSTRACT
AMMINENI, CHANDINI MUNIRATNAM. Design of Lignin Sensor for Identification of Waste Paper
Grades for an Automatic Waste Paper Sorting System. (Under the direction of Dr. M. K.
Ramasubramanian.)
The purpose of this research has been to design a lignin sensor for non-destructive, real-time identification
of waste paper grades, to aid in automating a waste paper sorting process. The sensor is capable of
identifying about 500 papers in one second. It is based on the principle that fluorescence light emitted from
paper following absorption of visible light has a wavelength distribution determined by the chemical
composition of the paper.
The sensor is the most critical part in waste paper sorting, which has hitherto not been automated due to the
inability to design a sensor that distinguishes paper grades. This sensor is vastly superior to all other
sensors previously designed for this purpose because, it does not use the conventional reflective type
optical properties of paper, and this is the only sensor that can identify all grades unlike the previous
ii
Dedication
iii
Biography
iv
Acknowledgements
I would first like to express my gratitude to my advisor, Dr. M. K. Ramasubramanian, for all his help and continued support and for entrusting me with such an interesting project from which I have gained tremendous amount of knowledge and experience. I would particularly like to thank him for the trust he placed in my hypothesis about the sensor, for appreciating the need of the sensor, and for his continued words of encouragement and motivation throughout the period of research.
I would also like to thank Dr. Richard Venditti for all his help and efforts to enlighten me about the chemistry aspects of pulp and paper, for the plant visits, his ideas about the experiments, and his continued support and guidance.
I am greatly indebted to Dr. Dave Aspnes for the tremendous amount of help he lent with the optics part of the research, his contributions with his vast experience and knowledge about fluorescence and for letting me use the resources of the Physics department.
I cannot forget Dr. Nicholas Dietz for giving me the basic idea about the depth of the research when I started it out and for letting me use his spectroscopic data acquisition system and.
I would like to thank Dr. John Heitmann for his inputs about commercial paper grades and for helping me out with his knowledge about paper coatings and his lab resources.
Thank you Dr. Martin Hubbe and Dr. Wes Snyder for your inputs about FWAs and vision systems, respectively.
Many thanks to Lance, Skip and Mike for their experienced advice and help. And also to all those tech support engineers who patiently cleared all my doubts about the various components and for their useful suggestions.
To all my family and friends, and especially to my parents, for all you have done, I want to express my love and gratitude.
v
Table of Contents
A. List of Tables………vii
B. List of Figures………...viii
1. Introduction ...1
1.1 Paper Making Requires Virgin Fiber...1
1.2 Uses of Recycled Paper...2
1.3 The Paper Recycling Process ...2
1.5 Paper Sorting ...3
2. Background ...5
2.1 Available technology...5
2.2 Previous Attempts to Automate...6
3. Initial work ...7
3.1 Plant visits ...7
3.2 Experiments with color sensor ...9
3.3 Comparable Sensors ...10
3.4 Literature Review...11
4. Problem Definition...19
5. Conceptualization...20
5.1 Spectroscopic Data Acquisition System...20
6. Lignin Sensor Design ...23
6.1 Excitation Source ...23
6.2 Detector ...24
6.3 Lock-in Amplifier...25
6.4 Optical Chopper ...26
6.5 Accessories...27
6.6 Data Acquisition System ...30
7. Paper Grade Identification Experiments...34
7.1 Samples ...34
7.2 Fluorescence Spectra...35
7.3 Effect of Chopper Frequency ...36
7.4 Effect of Incident Light Intensity ...38
7.5 Effect of Distance...39
7.6 Effect of Color...41
7.7 Effect of Ink ...42
vi
7.9 Penetration Test...46
7.10 Effect of Angle of Probe Head and Incident Light...47
7.11 Effect of Coating ...48
7.12 Time response of sensor ...49
7.13 Miscellaneous Experiments on Commercial Paper ...52
8. Conclusion...53
8.1 Results and Discussion...53
8.2 Recommendations for Use and Further Development...53
9. References ...56
10. Appendices ...58
10.1 Specifications for Photomultiplier...58
10.2 Specifications for Cut Off Filter...59
10.3 Specifications for Optical Chopper Model SR 540 ...59
10.4 Specifications for Laser model LCS-DTL-312 Specifications...60
10.5 Specification Summary for Lock-in Amplifier model SR 530...61
10.6 Specifications for Data Acquisition System PCI DAS 1000...64
10.7 More Results ...68
vii
List of Tables
7.1 Lab Prepared Samples 33
7.2 Effect of Coating 48
viii
List of Figures
2.1 Manually sorted papers 5
3.1 Municipal Sorting Station at Greensboro. NC 7
3.2 Commercial Baling Plant. High Point NC 8
3.3 Experimental set-up for color sensor evaluation. 9
3.4 Jablonski Diagram 12
3.5 Characteristic Curve of White paper 13
3.6 Behavior of Fluorescent Whitening Agent 13
3.7 Excitation and Emission Spectra Of Cellulose 14
3.8 Fluorescence Spectra for excitation at 337 nm 16 3.9 Fluorescence Spectra for excitation at 590 nm 17
5.1 Spectroscopic Data Acquisition System 21
6.1 Lignin sensor experimental set-up 23
6.2 Single Beam Chopping using the Optical Chopper 26
6.3 Beam Splitter 27
6.4 Bifurcated Cable 27
6.5 Experimental set-up 28
6.6 Diagrammatic Representation of Sensor 29
6.7 Differential Input 30
6.8 Front Panel of Data Acquisition Program 31
6.9 Block Diagram of Data Acquisition Program 32
7.1 Fluorescence Spectra of lab prepared samples 34
7.2 Fluorescence spectra of commercial samples 35
7.3 Effect of chopper frequency on lab prepared samples 36 7.4 Effect of chopper frequency on commercial samples 36 7.5 Effect of incident light intensity on lab prepared samples 37 7.6 Effect of incident light intensity on commercial samples 38
7.7 Effect of distance on lab prepared samples 39
7.8 Effect of distance on commercial samples 39
7.9 Effect of color 40
7.10 Effect of ink 42
7.11 Effect of colored ink on newsprint sample 43
7.12 Effect of colored ink on white ledger paper 43
7.13 Effect of basis weight of paper 44
ix
7.15 Penetration test for mixed grades 46
7.16 Effect of angle of probe head 47
7.17 Effect of angle of incident light 47
7.18 Time response of sensor 49
7.19 Output of sensor at 495 ft/min 50
1
1. Introduction
This project is a part of a solution to a major environmental issue, waste paper recycling.
Paper products make up over 40 percent by weight, slightly higher by volume - of this country's municipal solid waste (MSW), by far the largest contributor. In 1991, about 263 million tons of MSW were generated [18]. As the generation of MSW continues to increase, the capacity to handle it is rapidly decreasing. Many landfills have closed, and new disposal facilities are increasingly difficult to find. Also many trees are cut down each year to provide raw materials for the pulp and paper industry. Apart from trees, air pollution, water, oil, landfill space and energy is saved due to the use recycled paper products in place of paper products made from virgin fiber.
1.1 Paper Making Requires Virgin Fiber
Recycling paper does not replace the need for virgin fiber from sustainably managed forests. The waste paper stream continually needs the addition of virgin fiber to maintain quantity and quality in the recycling process. Each time paper is recycled the fibers break down, reducing the strength and other performance characteristics of the paper. Paper fibers can usually be recycled about five times before disintegrating. If virgin fiber was not added, the waste paper stream would eventually weaken and disappear. Some paper products do not become available for recycling. For example, books and papers kept in permanent storage, liners for plasterboard and insulation in buildings, and contaminated papers such as tissues and food wrappers. This can represent up to 15 per cent of total paper production. Recovery of white paper, which contains the much needed stronger fibers, is relatively time consuming and expensive because it is so widely scattered throughout the community in houses and offices. Virgin and recycled fibers have different characteristics, which provide varying end-product performances. For these reasons, it is impossible to produce only 100 per cent recycled papers.
Because virgin fiber is needed to sustain the papermaking cycle, it makes sense to use it where quality and performance requirements are satisfied, for example, in fine printing and writing papers, and high strength papers for corrugated box applications and heavy-duty bags. It is also important that high quality waste paper is recovered for recycling wherever possible, so that these stronger fibers can be added to the appropriate grades to improve the overall quality of recycled papers.
2
1.2 Uses of Recycled PaperAbout 80% of all waste paper comes from three sources: corrugated boxes, newspapers, and office papers. Less than 20% of waste paper is deinked to be used in newsprint, tissue or other bright grades. [19]. Old newspapers are used again to make new newsprint, paperboard products (shoe boxes, backings for writing tablets), cellulose insulation (attics of homes), building materials (wallboard, roofing felt, ceiling tiles), where color does not matter. Recycled kraft paper is used in shipping sacks that package bulk products such as agricultural seeds, animal feeds, fertilizers, and cement, grocery bags and in mail wrappings for magazines and catalogues. Recycled bleached sulfite papers are again used to produce high quality writing and printing papers.
1.3 The Paper Recycling Process
One of the biggest obstacles to using recycled or secondary fiber is effective contaminant removal. Recycling of paper is a process of removing contaminants such as stickies, fillers, inks etc. from the useful fiber.
Recycled fiber recovery begins at the pulper, which is nothing more than a large blender to disperse pulp into aqueous slurry. Pulping may be done at high or low consistencies using different rotors. During pulping, some of the gross contaminants are removed. A ragger is a chain which is pulled out slowly over a long period of time. The ragger catches baling wires, plastic sheeting, stringy materials, tapes, wet strength paper, and other long materials that wrap around it as the stock rotates in the pulper. Relatively large heavy contaminants such as nuts, bolts, rocks, pipe fittings, and other material do not pass through the holes of the pulper and eventually are forced outward to the junk chute at the lower peripheral of the pulper.
3
Less than 20% of the secondary fiber is deinked in the U.S. The ink is about 0.5-2% of the mass of the waste paper to be deinked. The overall deinking process from the point of view of the fiber can be broken down into four steps. 1) Repulping with concomitant ink removal from the fibers, 2) Cleaning and screening operations to remove the bulk of the ink from the stock, 3) Separation of residual ink contaminants from fiber stock, and 4) bleaching, if necessary. Ink is removed either by ink washing and ink flotation or froth flotation. The water containing the ink particles that have been removed from the fiber must be cleaned for reuse in the mill. One method of doing this is to use a flotation method similar to that used in flotation deinking.After deinking and cleaning, the dilute pulp slurry must be concentrated for further processing and storage. The deinked pulp is bleached and the process is very similar to that of bleaching virgin pulp. Sometimes these bleaching agents are added to the pulper to help with ink removal, but more efficient chemical usage is realized if the pulp is bleached after cleaning and screening.
1.5Paper Sorting
The papermaking process itself is pretty much the same whether one uses virgin materials, recycled materials, or a mixture of the two. The difference is in the preparation of the stock. Recycled material requires careful sorting. This in turn means that the paper mill must have a place to store waste paper and the staff to sort it, as well as a means of disposing of waste paper that cannot be used. Removing ink from waste paper also requires special chemicals, equipment, and equipment operators. As a result, some paper mills are not set up to use any recycled materials, while others prefer to use virgin materials as much as possible.
Because there are so many different types of paper and manufacturing processes and specifications vary for each type, recycled paper is usually broken down into categories that should be collected separately for recycling. Below is a brief description of each.
Office paper is usually made from high-grade (sulfite) paper pulp, but some computer and writing paper is made from groundwood - the fiber used to make newspaper. Office paper products include white letterhead, ledger, notebook, stationery, envelopes, copier and computer paper and stenographer pads. If uncontaminated by different types or colors of paper products, white office paper is the highest grade of recycled paper and therefore requires less processing than lower grades and brings a higher price.
4
percent by volume. There is so much that can be made from recycled newspaper—including newsprint, boxboard (cereal boxes), tissue, printing and writing papers and livestock beddingCorrugated paper, also known as OCC (old corrugated containers), is generally in the form of brown cardboard boxes with the waffle-shaped reinforcement in between two layers of smooth paperboard. Corrugated is used to pack and ship all sorts of products and is easily recycled into more corrugated and other paper products.
Boxboard is used to make cereal and tissue boxes and numerous other containers. It may contain a high level of recycled content, which is evident by the gray (instead of white) lining on the inside. Often newsprint is used to make boxboard, which itself can be recycled to make certain paper products. Both boxboard and corrugated should be kept clean and dry.
5
2. Background
2.1 Available technology
Currently sorting of waste papers, according to grades prior to recycling, is done manually in municipal waste sorting plants, where the paper waste is broadly classified as brown cardboard, newspaper and mixed office waste. A recently conducted research, following complaints of gastrointestinal problems among workers sorting the materials, concluded that laborers working at these facilities are exposed to microorganisms, organic dust, fungi, during manual sorting of recyclable paper. Furthermore, manual sorting is very inefficient in terms of both accuracy and throughput. Sorted brown boxboards and newspaper contain inferior quality fiber (mostly recycled), and are again used to manufacture boxboard and newspapers. But, in the mixed office waste, although there is a large quantity of good grade paper, the inability of the human eye to distinguish between coated inferior grades and good grades result in sorted office waste containing high-grade paper contaminated by similar looking low-grade paper, which in turn, reduces the overall fiber quality when it is recycled together. For example coated groundwood, super-calendered groundwood, coated freesheet and super-super-calendered freesheet all look the same to the naked eye. There are also some community organizations that collect waste papers from homes and sort them. Again, there is the problem of inability to distinguish between equally bright low and high-grade papers by the human eye.
6
The throughput from these manual sorting facilities is low. Even though there are recycling facilities available, as a result of the labor intensive and inefficient manual sorting, recyclable paper products end up in landfills, causing environmental damage. Hence there is an urgent need to automate the sorting process.2.2 Previous Attempts to Automate
Progress has been made using mechanical separation equipment such as special disc screens. However, these technologies have been, and still are, limited to mechanical properties of paper such as object dimension and weight (or both). The slow introduction of automation to waste paper sorting is primarily due to the physical characteristics of waste paper. Waste paper is generally comprised of a wide range of object sizes, shapes, thickness and stiffness. Furthermore, there are physical restraints such as staples, paper clips, rubber bands, metal fasteners, and various types of bindings. As such, the use of automated mechanical feeding systems and optical identification and separation systems similar to those currently used in other recycling industries, such as plastic and glass, would be inadequate for commercial viable throughputs and accuracy.
The existing automated sorting processes make use of the mechanical properties of paper to sort them. A patented Paper sorting apparatus [16] sorts papers using mechanical shear. Most of the available automated sorting processes can distinguish only between boxboard and mixed office waste and there is one patented process, Paper Sorting System [17], which can distinguish white ledger papers from the rest. The numerous grades among mixed office waste are not sorted out resulting in high quality white papers being used in producing low-grade papers, when their high quality pulp can be used to produce high-grade paper. This is due to the absence of sensors to replace the human eye that acts as the sensor in the manual sorting process. One of the recent attempts was successful in training a vision system to replace the human eye and was even successful in distinguishing between boxboards, newspapers and bright white and medium white among office waste. But the problem inherent to the human eye, viz., the inability to distinguish between bright low-grade paper and equally bright high-grade paper, persists. The main drawback in all these systems is that they all utilize the usual parameters of color, brightness and gloss to distinguish between grades, when additives and chemicals can be added to low-grade papers to make them look like high-grade papers. Hence it is imperative to have a foolproof sensor to automate the sorting process. A sensor that would distinguish the grades according to the quality of the paper immaterial of the way it looks due to additives.
7
3. Initial work
3.1 Plant visits
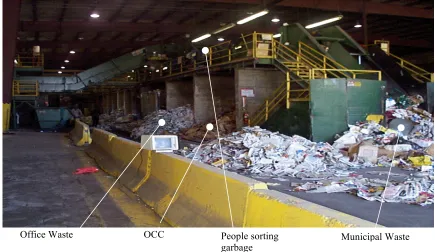
To understand the existing manual sorting process completely before trying to automate it, plant visits were undertaken. At the Greensboro Municipal sorting station, Greensboro, North Carolina, waste papers were segregated from household waste manually. Household waste was spread on moving conveyors and, brown cartons, newspapers and miscellaneous paper mixture were segregated from the waste among other things like glass, plastic and tin cans.
OCC Municipal Waste
Office Waste People sorting
garbage
Fig 3.1 – Municipal Sorting Station at Greensboro. NC
8
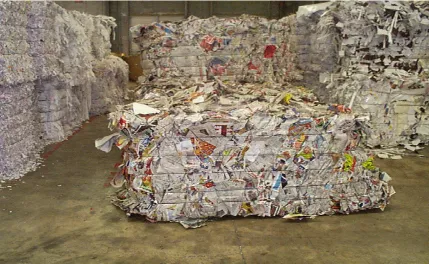
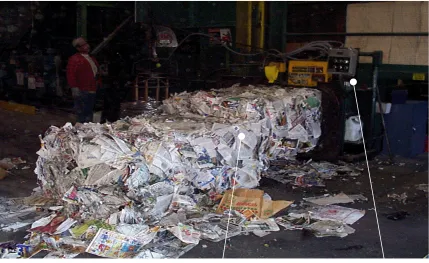
Baling Machine Mixed Papers
Fig 3.2 – Commercial Baling Plant. High Point NC
From the plant visits it was concluded that papers were segregated into broad categories which did not aid in efficient recovery of fiber since there was always some amount of low-grade paper mixed with high grade paper.
9
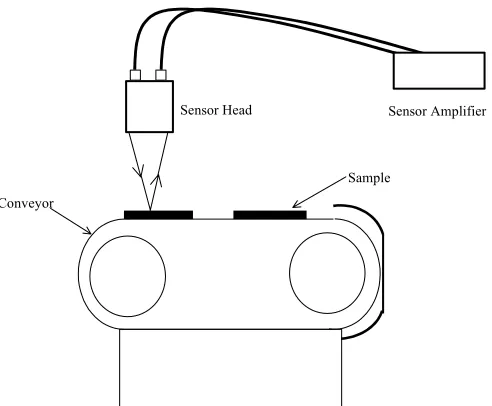
trade offs between the various systems is more practical since the designer takes the whole system into consideration while designing a particular component. Hence it is inadvisable to use commercially available reflectance type brightness or gloss sensors for waste paper grade sorting, by distinguishing the grades using these parameters. Furthermore, a treated low-grade paper is as bright as any high-grade paper and using the brightness parameter would not be very efficient.Since colored papers are to be segregated separately during the sorting process a commercially available color sensor was evaluated for this purpose.
3.2 Experiments with color sensor
10
Sensor AmplifierSensor Head
Sample Conveyor
Figure 3.3 – Experimental set-up for color sensor evaluation.
The sensor was trained to memorize the RGB values of various samples like white ledger paper with some tolerance limit. The only advantage of the sensor was that it identified even crushed and crumpled papers. The disadvantages were its inability to distinguish between black and white papers and the limitation in spot diameter. The sensor could not differentiate between black and white since the RGB values of these colors were the extremes. The spot diameter of the sensor was also extremely small which resulted in the identification of ink color rather than the paper color on some occasions. Thus, sentences highlighted with marker pens triggered the sensor to identify it as a colored paper. When trained to identify newspapers, the sensor also identified white ledger paper and also neon colored papers, which are extremely difficult to recycle due to the presence of heavy metals and dioxins. The reflectance of most of the colors in the visible spectrum by neon colored papers is believed to have caused it to be identified as white. Also, it was inferred from the experiments that cartons could not be identified using color sensors since the color of corrugated containers vary from different shades of yellow to different shades of brown. They also have prints, adhesive tapes and stickies that make it difficult to be identified using a color sensor and restricted spot diameter. Furthermore, as the thickness of cartons varies, its distance from the sensor also varies making it difficult to standardize the color values of cartons.
3.3 Comparable Sensors
11
without the additives. The sensors illuminate the paper with a constant light source having a wavelength of 360 nanometers. An elliptical mirror is used to focus light onto a region above the conveyor belt at approximately ten inches from the optic system. When paper with the fluorescing additives is illuminated with the light source, light is re-radiated in the 400 to 550 nm range. The sensor has a second light source that emits light in the 480 nm range. This light source is used to determine if any type of paper is present on the conveyor belt. It is turned on momentarily every three milliseconds and a reflected light measurement is made to determine if paper is present on the conveyor belt. This sensor can only identify white ledger papers in a mixture of office waste. The inherent disadvantage of such a sensor is that some of the same grade paper (Bleached sulfite paper), also high-grade papers, are commercially available without the brightening additives that the sensor uses for distinguishing. Hence the sensor would falsely distinguish the same grade papers (bleached sulfite paper) into high-grade and low-grade papers depending on the presence or absence of fluorescence whitening additives. Also, some groundwood papers used for computer print outs etc are visually very similar to bleached sulfite paper due to the presence of brighteners. This sensor would be easily fooled by such kind of paper and would identify this paper as white ledger paper.Since the conventional methods of paper recognition used optical properties of paper and the evaluated optical sensors proved disadvantageous, it was proposed to investigate properties of paper other than optical properties that would aid in distinguishing the grades.
A thorough literature review was undertaken to understand the chemical composition of paper and to determine the characteristics of paper that would help to distinguish between various grades in real time.
3.4 Literature Review
12
Paper grades are distinguished from each other by the fiber quality, that is, amount of virgin fiber present and fiber strength, and also by the amount of lignin present in them. There are no suggested non-destructive and fast methods for determination of the first two quantities. Thus different grades of papers can be distinguished by determining the amount of cellulose or lignin present in them. There are various methods of determining fiber degradation like treating with an alkaline copper sulfate solution, giving a deposit of cuprous oxide. The amount of this reduced copper is a measure of the degree of degradation of the pulp. But this, evidently, is a time consuming process and is impractical to use as a high-speed detection technique. Similarly, other proven methods of cellulose determination are also time-consuming chemical processes and hence quantification of cellulose content to determine the paper grade is an impractical principle for use in a sensor for automating the waste paper sorting process.The other chemical characteristic of paper, which helps in distinguishing between different grades of paper, is the amount of lignin present in it. A low-grade paper, like newsprint or groundwood paper contains more amount of lignin and a high-grade paper like white ledger paper contains very little lignin.
To design the sensor, various methods for detection and determination of lignin were studied [1]. Most of the standardized detection and quantification methods suggested in various books are elaborate chemical procedures that require time consuming sample preparation. Some of the indirect methods used spectrophotometry, but they had all been tested and used for determination of lignin in pulp. Optical measurements can be performed fast and non-intrusively. Reflectance measurements, for example, can be performed at sampling rates in the MHz range, which corresponds to a sub-millimeter resolution on paper webs moving at 20 or 30 m/s. But these do not help to identify the chemical properties of paper. By studying the fluorescence emitted by an object following exposure to ultraviolet or visible light, information on the chemical composition of paper might be obtained.
Fluorescence is the phenomenon in which absorption of light of a given wavelength by a fluorescent molecule is followed by the emission of light at longer wavelengths. The distribution of wavelength-dependent intensity that causes fluorescence is known as the fluorescence excitation spectrum, and the distribution of wavelength-dependent intensity of emitted energy is known as the fluorescence emission spectrum.
13
on the order of Pico seconds can be detected if necessary.Because it is a non-invasive technique, fluorescence does not interfere with a sample. The excitation light levels required to generate a fluorescence signal are low, reducing the effects of photo-bleaching, and living tissue can be investigated with no adverse effects on its natural physiological behavior.
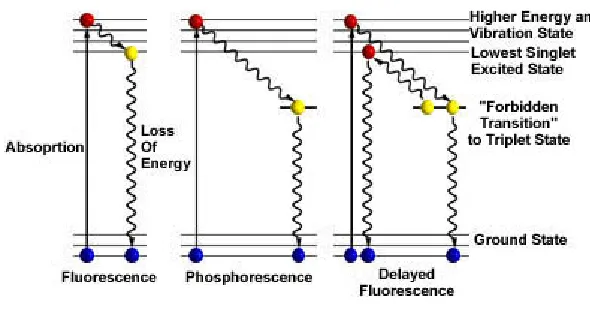
Figure 3.4 – Jablonski Diagram
14
Fig 3.5 – Characteristic Curve of White paperFig 3.6 – Behavior of Fluorescent Whitening Agent
15
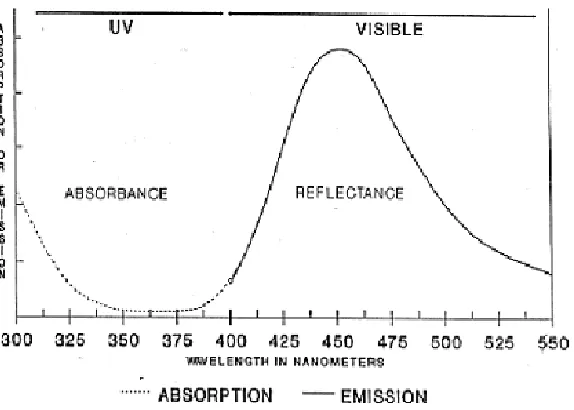
Fig 3.7 – Excitation and Emission Spectra Of CelluloseFig 3.7 shows excitation (ob = 450 nm) and emission (ex = 365 nm) of cellulose blotter sheet (dotted lines) and blotter treated with Fluorescent whitening agent (solid lines). Spectra of untreated blotter have been scaled up by a factor of 15 for comparison.
From the above three graphs we can safely infer that even though the amount of cellulose can be quantified using fluorescence techniques, it would be impractical to use principle to determine cellulose quantities in paper due to presence of FWA. Since both cellulose and FWAs have almost the same excitation and emission spectra, two papers containing the same amount of cellulose would give different intensity values if one contains FWA and the other does not.
16
weak if any fluorescence was seen from pure cellulose or TiO2, The fluorescence seen from copy paper andrecycled furnishes was then attributed to filler and fluorescence whitening agent, whereas emission from lignin dominated the spectrum of newsprint.
Previous research on quantification of lignin using fluorescence used ultraviolet as the excitation source. To establish a basis for the interpretation of the fluorescence spectra arising from lignin and lignin products, a variety of model compounds have been examined in [9]. The fluorescence properties of a variety of model compounds representing structural elements in lignin, industrial lignin compounds (lignin sulfonates, kraft lignin) and other lignin related polymers have been examined. The absorption spectra for all the examined lignin compounds were found to be a maximum in the ultraviolet region.
Fluorescence measurements in connection with the paper production environment have been applied to measurements of lignin in pulp, black liquor and pulp mill effluents. Two outstanding examples are Fluorescence Analyzer for Lignin [10] and On-line measurement of lignin in wood pulp by color shift of fluorescence [11]. The second patent is a system for on-line, in-situ monitoring and/or controlling the concentration of lignin in wood pulp and black liquor. The lignin concentrations from wood pulp samples are measured by applying an excitation light in the ultraviolet wavelength range to the samples in order to cause the lignin to emit fluorescence. A spectral distribution of the fluorescence is then determined and the lignin concentration is then calculated based on the spectral distribution signal. The setup consists of a probe connected to the light source and the polychromator, and located at the samples for conveying the excitation light (337 nm pulsed nitrogen laser) to the samples and for conveying the fluorescent emission light of the samples to the polychromator. A detector is to connected the polychromator and to a signal processor on the other end. The signal processor converts the proportional signals into a KAPPA number.
Chemical methods available require sample preparation and dilution prior to measurement and are therefore not in-situ, not real-time and introduce sampling and dilution errors and the methods [10] and [11] use UV light which are affected by the presence of FWAs.
17
All these papers show that cellulose absorbs light and re-emits a weak fluorescence. Lignin absorbs both ultraviolet and visible light and fluoresces weakly. The absorption of lignin is strong at short wavelengths and decreases when the wavelength is increased. The graphs below show three different types of pulps excited at two different wavelengths.Fig 3.8 – Fluorescence Spectra for excitation at 337 nm
18
The excitation sources were nitrogen laser operated at 337 nm and a dye laser operated at 590 nm. The spectra were recorded using an optical multi-channel analyzer with intensified CCD camera, gated on the laser pulses and connected to a spectrometer. The pulp types are mechanical pulp, bleached sulfate pulp and unbleached sulfate pulp. The importance of the choice of excitation wavelength can be understood from the fact that the pulp which gives the strongest fluorescence for one wavelength gives the weakest fluorescence for the other. For both excitation wavelengths, the main source of fluorescence is lignin. Upon excitation with longer wavelength, only lignin absorbs the excitation light and the fluorescence intensity then reflects the abundance of lignin in the pulp. The strongest fluorescence is obtained for the mechanical pulp and very little fluorescence is obtained for the bleached sulfate pulp. Following excitation with ultraviolet light, the strongest fluorescence is obtained for the pulp with lowest lignin concentration and for the pulp with the highest lignin concentration, the lowest fluorescence intensity is obtained. This is due to the strong re-absorption of the blue fluorescence light. It has been previously observed in measurements with ultraviolet light on pulp that at high lignin concentrations, the fluorescence intensity decreases as the lignin concentration increases [6, 10, 14]. A further complication that arises with the ultraviolet excitation light is that, there are other components of paper that contribute to fluorescence. The most important one being the FWAs whose function and spectral response was explained earlier.The fluorescence from lignin is thus advantageously studied using excitation with visible light. This way the problem of re-absorption is minimized. Also, an uncomplicated source such as diode laser can be used. It is imperative, for this research, that the fluorescence output is not affected by the presence or absence of FWAs since most grades can contain FWAs for better visual appeal, but still differ in fiber quality, lignin content etc. and hence cannot be recycled together.
19
4. Problem Definition
Currently, the sensors that are used in the automated sorting plants are either color and brightness sensors or vision systems, both of which are unreliable since they use reflective measurements to quantify the optical properties of paper. The optical properties of paper are determined not as much by direct reflection at the surface as by scattering inside the paper. Furthermore, reflective measurements of optical properties are not essentially characteristic of the chemical composition or the grade of the paper. They simply give data that would be useful for visual grading and color matching of paper. Data obtained from these kinds of sensors are prone to the make the same error as the human eye in distinguishing between coated groundwood, super-calendered groundwood, coated freesheet and super-calendered freesheet since they cannot determine the actual chemical composition of paper.
20
5. Conceptualization
From the literature review and initial experiments conducted to evaluate currently available commercial sensors, it was concluded that a lignin sensor that senses the lignin content of paper, would be used to distinguish between different grades of papers and a vision system would be used to sort papers as white and colored papers. At this point, it is not known if the lignin sensor could be used to determine the grade of colored papers, but in most cases this is not required as all colored papers are bleached and it is only the white papers that look alike to the naked eye and hence have to be distinguished as different grades. As already mentioned, low-grade papers can be made to look like high-grade papers by coating it and adding FWAs. This research topic concentrates on the design of the lignin sensor.
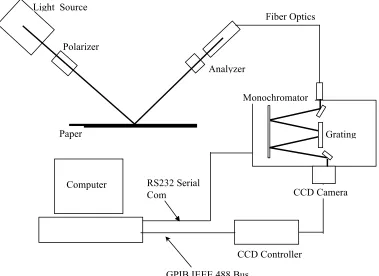
5.1 Spectroscopic Data Acquisition System
To establish the experimental set-up and to verify the fluorescence of lignin at visible wavelengths as suggested in the paper [8], a series of experiments was conducted using the resources belonging to the Physics Department at NC State University. A Spectroscopic Data Acquisition System was used to analyze the fluorescence properties of the various grades of paper.
21
Paper Light Source
Polarizer
Analyzer
Fiber Optics
GPIB IEEE 488 Bus
Grating
CCD Controller Computer
Monochromator
RS232 Serial
Com CCD Camera
Fig 5.1 – Spectroscopic Data Acquisition System
Experiments were conducted by exposing the sample to lights of different wavelengths. A 5 mw white light source was used with various filters, thus exposing the sample to only lights of specified wavelengths. The pixel readings obtained were converted to wavelengths to determine the peaks in the output spectrum. It was inferred from the experiments that the fluorescence emitted by the paper is very weak to be captured by a CCD camera and hence a more sensitive device has to be used. The results however were favorable but not distinct enough to pin point the exact wavelength. The wavelength sensitivity of the detector controller was from 210 nm to 950 nm. The graphs showed humps at wavelengths higher than excitation wavelengths indicating fluorescence. Excitation using small wavelengths such as 230 nm gave a much better fluorescence graph with bright white papers indicating the presence of fluorescence whitening agents. The hump in the output spectrum for this excitation wavelength was seen around 450 nm. The graphs were more pronounced and more distinguishable for various grades at wavelengths between blue and green lights. When a 590 nm filter was used with the white light source, humps were seen in the output graph at 640 nm.
22
would be practical to use a more sensitive detector like a photomultiplier in the place of a camera. Also, the excitation source should have a wavelength in the range of 500 to 600 nm and the power of the excitation light should be at least 15 mw. It would therefore be practical to use a laser light with a wavelength in this range so that the collimated high power laser beam will have more photons available for absorption by paper and hence higher intensities of fluorescence can be expected.23
6. Lignin Sensor Design
In the previous chapters we have seen how imperative a lignin sensor is, and that a lignin sensor can be designed using the principle that the fluorescence intensity of paper, when exposed to visible light, is due to lignin and lignin only. The initial experiments using the Physics Department’s Spectroscopic Data Acquisition system showed that the set-up must essentially have an excitation source, a filter, a beam splitter, a detector, a chopper and lock-in amplifier and a data acquisition system. The important task in the sensor design is the selection of these components. The following paragraphs elaborate on the criteria involved in the selection of each of the components and the advantages and disadvantages of the purchased components. Fig 6.1 shows the final experimental set-up.
Laser Light
Optical Chopper
Bifurcated Fiber
Paper Chopper Controller
Monochromator
Photomultiplier
Lock-in Amplifier
DAQ & Computer
Fluorescence
Figure 6.1 – Lignin sensor experimental set-up
6.1 Excitation Source
24
absorb the light and one will no longer be able to monitor lignin selectively. Also, since the absorption of long wavelength light (such as red) is weaker than for short wavelength light (such as blue), the penetration into the paper is better for longer wavelengths. This means that with a long wavelength excitation light, one can monitor the whole paper thickness. But since this sensor is used on mostly office waste, the papers are not expected to have very high basis weights. Further, the shorter the wavelength of the excitation light, the shorter will be the wavelength of the fluorescence light. This means that with short wavelength excitation light, the fluorescence will be at wavelengths for which the absorption is comparatively strong. Thus the re-absorption of fluorescence light will be stronger for short wavelength excitation light than with long wavelength excitation light. If a very long wavelength light is used, the fluorescence emitted by it will be at a longer wavelength. In practice, detectors that are less expensive and easily available have peak sensitivities in the visible light region. The sensitivities drop considerably at around 700 nm and most of them are not sensitive after 800 nm. This restricts the use of long wavelengths such as 650 nm for this application. Hence an excitation wavelength of 532 nm is chosen such that the emission spectrum maximum would still be in the sensitive region of the detector and still the excitation wavelength is long enough to prevent the re-absorption of fluorescence by the paper.A diode pumped solid state 532 nm laser light with power variable between 1 to 50 mw was chosen for this purpose. The model LCS-DTL-312 purchased has a turn key power supply and other features include controlling and setting output power continually from zero to maximum and modulating output power with sine or square wave waveform at 50-1000 Hz frequencies.
6.2 Detector
Since the fluorescence from paper is very weak and since the CCD camera used in the preliminary experiment stage was not sensitive it was decided to use a more sensitive detector, a photomultiplier tube. The photocathode of a photomultiplier tube converts energy of incident light into photoelectrons. The conversion efficiency (photocathode sensitivity) varies with the wavelength of the incident light. This relationship between photocathode sensitivity and wavelength is called the spectral response characteristic. The spectral response of the chosen multi-alkali photomultiplier, Perkin Emler C962 is 165 – 850 nm. On their way from the cathode to the anode, the photoelectrons pass through a narrow, semi conductive channel. Each time the electrons hit the inner wall of the channel, multiple secondary electrons are emitted. This effect occurs multiple times along the path leading to an avalanche effect with a gain exceeding 108.
25
The PMT is operated at high voltages of –3000V and a self-contained power supply, CHV 30N, specially designed for the PMT was also purchased. The power supply provides matching voltages for the cathode, the channel entrance and the channel end. Besides, the module is prepared to switch the potential between the two high voltages via an external TTL pulse in order to protect the PMT from over exposure or to apply a gating function. A potentiometer in the power supply allows the user to change the output from 0 to – 3000V, which can be constantly, monitored using a voltmeter from the leads provided. The output is the original output divided by –1000. In the design of the sensor, it has to be noted that the front-end of the photomultiplier should never be mounted into a conductive holder. Furthermore, when the sensor is used in the industrial environment, the input variables much be chosen such that the PMT is operated with an average anode current of 1 nA to 30 nA for long time operation.6.3 Lock-in Amplifier
The lock-in technique is used to detect and measure very small ac signals. A lock-in amplifier can make accurate measurements of small signals even when the signals are obscured by large noise sources that may be a thousand times larger. Essentially, a lock-in is a filter with an arbitrarily narrow bandwidth, which is tuned to the frequency of the signal. Such a filter will reject most unwanted noise to allow the signal to be measured. In addition to filtering, a lock-in also provides gain. For example, a 10-nanovolt signal can be amplified to produce a 10V output, a gain of one billion. For these reasons, it was decided to use a lock-in amplifier for the sensor, where the incident light will be modulated with a particular frequency and the output with the same frequency will be filtered and amplified by the lock-in thus making sure the fluorescence is only due to the incident light. This way, the sensing end of the sensor could be placed in an open area near the paper because the incident light is modulated and the lock-in amplifier amplifies only the output due to the modulated light. The technique requires that the experiment be excited at a fixed frequency in a relatively quiet part of the noise spectrum. The lock-in then detects the response from the experiment in a very narrow bandwidth at the excitation frequency.
There are two types of analog lock-in amplifier, single phase and dual phase. In the single-phase lock-in amplifier, the output would be r cosθ, where r is the magnitude and θ is the phase angle. In this case, the user has to have an external input 90 degrees out of phase with the actual input and then manually calculate the actual magnitude with the r cosθ and r sinθ, components. The dual phase lock-in amplifier that is used for this application does it internally and gives the amplified magnitude output.
26
band is always equal to 1/5th of the center frequency. The center frequency is continually adjusted to beequal to the internal demodulator frequency. When the reference frequency from the chopper is connected to the lock-in, the bandpass filter tracks the reference. The bandpass filter adds up to 20 dB of dynamic reserve for noise signals outside the pass band. The full-scale sensitivity ranges from 100 nV to 500 mV. The phase shift between the reference oscillator of the lock-in amplifier and the reference input signal is set to zero. There are two filters labeled PRE and POST in the output amplifier. These two filters provide attenuation of noise. The PRE filter has a time constant ranging from 1 ms to 100 s and the POST time filter has a time constant of 0 s to 1 s. These time constants are set to 1 ms and 1 s respectively in the experimental stages and then set to their least values when the sensor is used in the dynamic mode.
6.4 Optical Chopper
27
Chop at f
Using outer row of slots
Experiment
Detector
Lock-in Amplifier Chopper Wheel
Chopper Controller
Fig 6.2 -- Single Beam Chopping using the Optical Chopper
6.5 Accessories
In the set-up, as it can be seen, light from the excitation source has to reach the paper, and also, the fluorescence from the paper sample has to reach the photomultiplier tube. A beam splitter can be used for this purpose. A beam splitter is a mirror of partial reflectance. A proportion of light would be reflected from the beam splitter while the rest would be transmitted through it unaffected.
Photomultiplier Tube
Beam Splitter Laser
Incident Light
Collimating lens Fluorescence
Optical fiber
Fig 6.3 -- Beam Splitter
28
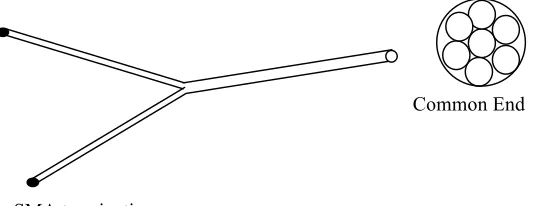
and to collimation optics at the common end.SMA termination
Common End
Fig 6.4 -- Bifurcated Cable
The central fiber is used as the light delivery leg and the surrounding six fibers are used as the read fibers, that is, the fibers that collect the fluorescence from the sample. The collimation optics at the common end is a screw-on lens, which effectively allows the user to increase the field of view.
29
Laser Head Chopper
Monochromator PMT Probe Head Bifurcated Cable Lock-in Amp
Chopper Controller Oscilloscope Laser Power Supply
Power Supply for PMT
Fig 6.5 -- Experimental setup
30
Laser Light
Optical Chopper
Probe head
Paper Chopper Controller
Photomultiplier
Lock-in Amplifier
DAQ & Computer Black Enclosure
Filter
Collimation and coupling package
Fig 6.6 -- Diagrammatic Representation of Sensor
The detector gives out a voltage output proportional to the light intensity that falls on the detector. The lock-in amplifier amplifies the detector output that corresponds to the frequency of the chopper and filters out the unwanted output of the detector. This output is read through a 400 MHz oscilloscope to avoid over exposure of light to the PMT.
6.6 Data Acquisition System
31
the PCI-DAS1000.The output from the lock-in amplifier can be connected to the DAQ board either as a single ended input or differential input. Differential inputs amplify the voltage between two distinct input signals. In the lignin sensor the differential mode is chosen to connect the output from the lock-in to the DAQ, since the differential input is much more immune to EMI that a single ended input. Most EMI induced noise in one lead is also induced in the other, the input only measures the difference between the two leads, and the EMI common to both is ignored. Fig 6.7 shows the basic differential input configuration.
I/O Connector LL GND
CH Low CH High
To A/D Input Amp
Fig 6.7 -- Differential Input
The DAQ was programmed in LabVIEW to read the output from the lock-in amplifier at a user-defined rate. LabVIEW is a graphical programming language where programs are created by wiring functions, variables etc. together.
32
waveform graph. The results at this stage are the digital 12 bit values of the equivalent analog voltage output from the lock-in amplifier. This is suffice for grade distinction, but for the purpose of clarity during the experimentation process, the data is further processed and converted to voltage values. It must be remembered that this portion of the program takes cycle time and makes the program slower. This portion of the program must be removed when this sensor is connected to the system since the digital values themselves provide an idea of the grade of the sample under the sensor. Figs 6.8 and 6.9 show the front end and the block diagram of the program.34
7. Paper Grade Identification Experiments
Besides being a proof-of-concept sensor for paper grade identification, this sensor’s inherent flexibility allows the same set-up to be used both for experimentation purposes and as an industrial standard sensor when the monochromator is removed. A series of experiments were conducted to study the effects of various chemicals in the paper and other factors that might influence the fluorescence due to lignin from the samples. Fluorescence intensity is a relative measurement that depends on instrument characteristics. Instrument factors, such as light source fluctuations, optical misalignments, and drift in the detector electronics, also affect fluorescence intensity measurements. Intensity measurements are also affected by nonspecific background fluorescence. Photobleaching of the fluorophore is another potential source of error in intensity-based fluorescence. Additionally, the presence of optically absorbing compounds in the sample can introduce additional measurement artifacts. This makes comparison of data taken with different instruments, or even with the same instrument at different times, difficult. Fluorescence intensities can be standardized only in conditions close to ideal and hence this attempt is not to standardize the fluorescence intensity values for each grade, instead, it is to provide a sensor that would distinguish between grades. In distinguishing between grades, it can be conveniently assumed that all grades are subjected to the same external conditions and also the output from every sample is subjected to the same instrument factors. All fluorescence intensity graphs obtained from this research have therefore been normalized to the peak values since it is the trends in the graphs and the ability of the sensor to distinguish between grades that matter. The sensor could be made more accurate by using ratiometric measurements, however, ratiometric measurements require an increase in instrument complexity and it is also instrument-dependent.
7.1 Samples
To conduct the experiments and to test the sensor a few handsheets of different paper samples were prepared by the Wood and Paper Science Department at North Carolina State University.
Table 7.1 Lab Prepared Samples
Sample Abbr. Used Weight (gms) Diameter KAPPA Number Bleached Sulfite Paper with
Fluorescence Whitening Agents
BSP w FWA 1.3
3.5
6” Unknown
Bleached Sulfite Paper without Fluorescence Whitening Agents
BSP w/o FWA 1.3 3.5
6” Unknown
Kraft Paper KP 1.3
3.5
35
Thermomechanical Pulp TMP 1.3
3.5
6” Unknown
Apart from these commercial samples like newsprint paper (NPS) and copy paper or white ledger paper (WLP) were used.
7.2 Fluorescence Spectra
The fluorescence spectra of the samples was obtained to (a) check if the fluorescence of paper is due to only lignin when the sample is excited by visible light, (b) check if the fluorescence is affected by the presence of Fluorescence Whitening Agents (FWAs), (c) check if the difference in fluorescence intensities between the various samples is measurable enough to distinguish between them and hence use the set-up as a sensor, and (d) determine the wavelength where the fluorescence intensity is maximum, in order to obtain a filter to replace a monochromator in the sensor. The experiment was conducted by fixing the variables sensitivity of detector and lock-in amplifier, chopper frequency, intensity of excitation source, and distance of the probe head from the paper, at some arbitrary values. The paper samples were exposed to the chopped incident light and the fluorescence that corresponded to the frequency of the chopper was amplified by the lock-in amplifier and was read off an oscilloscope. This procedure was repeated for various wavelengths between 610 and 700 nm. The starting wavelength of 610 makes sure that the incident light is cut off from the detector completely. Figs. 7.1 and 7.2 show the graphs obtained.
Fluorescence Spectra
0 0.2 0.4 0.6 0.8 1600 620 640 660 680 700
Wavelength (nm)
Normalized Fluorescence
BSP w FWA
BSP w/o FWA TMP
Kraft Paper
36
Fluorescence Spectra0 0.2 0.4 0.6 0.8 1
600 620 640 660 680 700
Wavelength (nm)
Normalized Fluorescence
WLP NPS
Fig 7.2 – Fluorescence spectra of commercial samples
Fig. 7.1 shows the fluorescence spectra of Lab prepared samples of Kraft Paper (KAPPA 116), Bleached Sulfite Pulp with FWA, Bleached Sulfite Pulp without FWA and Final Thermomechanical pulp. Fig. 7.2 shows the fluorescence spectra of commercially available White Ledger Paper and Newsprint Samples. From the graphs it can be inferred that the fluorescence of paper in both the spectra is due to lignin, since the chosen samples differ by the amount of lignin present in them. Appreciable difference in intensities is seen at 650 nm wavelength, hence proving the use of visible light as excitation source. Use of visible light ensures that fluorescence intensities are unaffected by the presence or absence of FWA. (Fig. 7.2, use of bleached sulfite pulp with and without FWA) From the above graphs it can be seen that the maximum fluorescence intensity occurs at 650 nm when the paper samples are excited with a 532 nm light source. These results were used to obtain a sharp cut off filter with cut off wavelength at 610 nm.
7.3 Effect of Chopper Frequency
37
the chopper frequency alone is varied from 500 to 3.7 KHz to see the effect it has on fluorescence intensity. Figs 7.3 and 7.4 show the results of the experiment.Effect of Chopper Frequency
0 0.2 0.4 0.6 0.8 1
500 1500 2500 3500
Chopper Frequency (Hz)
Normalized Fluorescenc e BSP w BSP w/o KP TMP
Fig. 7.3 – Effect of chopper frequency on lab prepared samples
Effect of Chopper Frequency
0 0.2 0.4 0.6 0.8 1 1.2
500 1500 2500 3500
Chopper Frequency (Hz)
Normalized WLP
NPS
Fig. 7.4 – Effect of chopper frequency on commercial samples
38
time delay during signal processing or due to the saturation of the PMT. A more detailed study into this is required if fluorescence is used to standardize the amount of lignin present in paper.Since the main objective of the sensor is to distinguish between grades, it is important that there is appreciable difference in intensity levels of the different samples. The difference in intensities decreases as the chopper frequency increases thus forcing the detector and amplifier to be more sensitive and the data acquisition system to be more accurate. Hence, from the results, a chopper frequency of 1500 Hz was chosen to be set as the standard frequency for the experiments to follow. At this frequency, the difference in intensities of various samples is appreciable and also the frequency is high enough to avoid low frequency ‘1/f’ noise as well as line noise. The frequency is low enough to avoid phase shifts and amplitude errors due to the RC time constant of the source impedance and the cable capacitance. Also the motor lifetime will be reduced if the unit is operated for extended periods above 2 KHz.
7.4 Effect of Incident Light Intensity
The incident light source, a diode pumped solid state laser had a light intensity that can be varied from 1 to 50 mw. The wavelength of the excitation source is 532 nm and is chosen to be thus because the absorption of the excitation light is higher for shorter wavelengths and also it is not so short as to be absorbed by FWAs. The variables amplifier, detector sensitivity and probe head distance are fixed and the fluorescence intensity of paper when exposed to different intensities of incident light is observed at 650 nm. Figs 7.5 and 7.6 show the results obtained.
Effect of Incident Light Intensity
0 0.2 0.4 0.6 0.8 1
0 1 2 3 4 5 6
Incident Light Intensity (mW)
Normalized Fluorescence
BSP w BSP w/o KP TMP
39
Effect of Incident Light Intensity0 0.2 0.4 0.6 0.8 1
0 1 2 3 4 5 6
Incident Light Intensity (mW)
Normalized Fluorescence
WLP NPS
Fig 7.6 – Effect of incident light intensity on commercial samples
The graphs show that as the incident intensity increases, the fluorescence intensity also increases as expected, the distance of the probe head from the sample being fixed. This could be an important factor while fixing the probe head distance from the paper sample. In the above experiment neutral density filters could be added to reduce the overload on the lock-in amplifier and obtain the intensity output for higher incident light intensities. It is assumed that the curve will flatten after a while when all the lignin in the area exposed is saturated with light and there is no more lignin present to absorb more incident light.
7.5 Effect of Distance
An experiment was conducted to determine the height at which the probe could be placed and still generate a difference in signals between lignin and non-lignin containing papers. This is important because the gap allowed for the movement of paper beneath the probe needs to sufficiently allow the paper to pass without plugging. It is common knowledge that the intensity of fluorescence and hence the sensitivity of the sensor would be maximum when the distance is minimum, but this would mean an enormous burden on the material handling system to hold every paper at exactly the same position when it passes below the sensor. This is possible in a production run, but in waste paper sorting, the objects being sorted are discarded papers and hence they would arrive in a disorderly fashion under the sensor.
40
progressively increased while all other variables were kept constant. In practice, it is would be suffice to keep just the incident light and the chopper inside an enclosure to make sure the fiber cable does not receive chopped ambient light. But it would also be advantageous to place the probe in an enclosure to avoid over-exposure of the detector, because, all the light that the paper emits and reflects falls on the detector and it is only in the lock-in stage the output due to the incident light is filtered out.Effect of Distance
0 0.2 0.4 0.6 0.8 1
0 2 4 6 8 10
Distance (Inches)
Normalized Fluorescence
BSP KP TMP
Fig 7.7 – Effect of distance on lab prepared samples
Effect Of Distance
0 0.2 0.4 0.6 0.8 1
0 2 4 6 8 10
Distance (Inches)
Normalized Fluorescence
WLP NPS
Fig. 7.8 – Effect of distance on commercial samples
41
distance between the probe and the sample increases. Mounting the probe as close to the sample as possible improves the distinction between lignin and non-lignin containing papers but increases the potential problems with the mechanical material handling system. Considering the trade-offs, a probe height of 3 to 4 inches would be ideal for this application. From graphs 7.7 and 7.8, it should be noted that as the distance approaches 10 inches, the fluorescence intensities are so close that the sensitivity and all parameters of the sensor should always function optimally to see the few-hundred millivolt difference between the various grades.By increasing the intensity of the incident light as the distance increases, a graph between relative intensity and distance can be obtained. Relative intensity of a sample is fluorescence intensity divided by incident intensity. It is assumed that the graphs will show a straight line for each sample at their corresponding relative intensities, but the graph will slope downwards after the first few inches. The difference in relative intensities between the various samples will be proportional to the difference in actual intensities between the samples. This graph could not be obtained as a fixed set of input intensities could not be used for very high lignin newsprint samples and very low lignin bleached sulfite samples as the distance increased.
7.6 Effect of Color
42
Effect of Color0 0.2 0.4 0.6 0.8 1
600 620 640 660 680 700
Wavelength (nm)
Green Yellow Lavendor Rose Blue WhiteFig 7.9 – Effect of color
From earlier results, we know that the fluorescence of paper is due to lignin and is a maximum at 650 nm. These graphs also show similar curves, but the intensities vary drastically for different colors of the same paper grade. Which means that even though the fluorescence is due to lignin, the presence of color also produces an effect on the output intensity. It can be seen from the graphs that the brighter/deeper colors (page 63) show higher intensities than the lighter colors. It should be noted that the excitation wavelength of 532 nm corresponds to green color in the visible spectrum and it lies in the middle of the visible spectrum. Since green colored paper absorbs all other colors and reflects green, the paper does not absorb the incident light (also green) and hence the fluorescence intensities arising from green colored papers, both bright and light samples, are the least. As mentioned earlier, fluorescence is caused by the absorption of incident light by the chemical compound under consideration. But in the case of colored papers, there are dyes in the paper which, depending on the color, absorb certain portions of the spectrum. For example, when light impinges on a green colored paper, the color dye in the paper absorbs all other colors of the spectrum other than green. Hence in the case of color papers, it is the dye in the paper that actually absorbs the incident light and probably passes on the absorbed energy to lignin. The color curves being similar to the fluorescence spectra due to lignin proves that the fluorescence in mainly due to lignin, but the presence of the dyes throws the intensity values off the mark and hence the sensor is fooled when used with colored papers.
7.7 Effect of Ink
43
treated with chemicals to loosen the ink and then the ink is washed away.It is of interest to understand how different amounts of ink/toner affect the output of the sensor. To investigate, the sensor output was determined on areas of a sheet of copy paper with different amounts of toner (grayness from 0 being unprinted to 100% being a solid black print). It is known that the light impinging on a paper sheet near a printed screen dot is scattered into the dot and is absorbed by it, making the dot appear larger than it is. The results are shown in fig 7.10.
Effect Of Ink
0 0.2 0.4 0.6 0.8 1
600 620 640 660 680 700
Wavelength (nm)
Normalized Fluorescence
Grey 80% Grey 50% Grey 40% Grey 25%Fig 7.10 – Effect of ink
The graph predictably shows that the fluorescence intensity of the sample decreases as the amount of toner in the sensed area increases. The increased amount of toner not only can absorb more of the incident light but also absorbs some of the light from fluorescence. For typical printing of text, it is assumed that ink will have very little or no effect on the sensor since the spot diameter of the incident light is about 0.7 inches at a probe height of 4 inches from the sample. To decrease the probability of striking a heavily printed spot, and hence falsely grading the paper, the detection algorithm will be designed to take a minimum of 3 tests per paper sample as the paper passes below the probe. In practice, a fully printed sheet (in which all three fluorescence tests are performed on solidly printed areas) should be classified as a colored sheet by the color image analysis portion of the system and handled accordingly.
44
and 700 nm. Figs 7.11 and 7.12 show the results obtained.Effect of Ink on NPS
0 0.2 0.4 0.6 0.8 1
600 620 640 660 680 700
Wavelength (nm)
nps-Violet nps-Indigo nps-Blue nps-Green nps-Yellow nps-Orange nps-Red nps- no inkFig 7.11 – Effect of colored ink on newsprint sample
Effect of Ink on WLP
0 0.2 0.4 0.6 0.8 1
600 620 640 660 680 700
Wavelength (nm)
wlp-Violet wlp-Indigo wlp-Blue wlp-Green wlp-Yellow wlp-Orange wlp-Red wlp- no inkFig 7.12 – Effect of colored ink on white ledger paper
45
7.8 Effect of WeightMost of the office use white ledger papers have the same weight of 20 lbs. But newspapers are much lighter than copy papers. Hence to pass different kinds of papers under the same sensor, the effect of weight of the sample on the sensor was studied. Samples of two different basis weight handsheets (6 inch diameter) were prepared and analyzed with the lignin sensor and the results are shown in fig 7.13. Basis weight of a paper is the weight of the paper divided by its area.
Effect of Weight
0 0.2 0.4 0.6 0.8 1
0 1 2 3 4
Weight (gms)
BSP TMP KP
Fig 7.13 – Effect of basis weight of paper
The graph shows that as the weight of the sample increases, the fluorescence intensity increase. It should be noted that the weight of the Bleached Sulfite pulp should be increased to an appreciably high amount for its fluorescence to equal the fluorescence of a light Thermomechanical paper or Kraft paper.
46
Effect of Multiple Sheets
0 0.2 0.4 0.6 0.8 1
1 10 100
Number of Sheets
Normalized Fluorescen
c
WLP NPS
Fig 7.14 – Effect of multiple sheets of paper
The results demonstrate that the relationship between number of sheets of copy paper or newsprint and the output intensity is not linear, increasing up to about 10 sheets of paper and then leveling off. The output unambiguously distinguishes the copy paper from the newsprint at all number of sheets analyzed. This indicates that the basis weight of the grades (or number of sheets) analyzed should not be an issue.
7.9 Penetration Test
47
Penetration Test
0 0.2 0.4 0.6 0.8 1
0 2 4 6 8 10
No of sheets on top of NPS
Normalized Fluorescen
c
Fig 7.15 – Penetration test for mixed grades
There is a drastic decrease in fluorescence intensity in the graph between the newsprint on the surface and when the newsprint sample is placed beneath just one sheet of copy paper. This indicates that either the light does not penetrate enough through the copy paper to the newsprint or the fluorescence from the newsprint is not strong enough to emerge through the copy paper to the surface of the sample. Since a 30-mw laser was used, the latter explanation sounds more applicable to this case.
The results from the effect of weight, distance and the penetration test also show us that there would not be much trouble in identifying crushed or crumpled pieces of paper either. When the papers are crushed, the distance from the probe decreases slightly, maybe in the order of mm or cm, and the sensor would see it as multiple papers of the same grade. From the penetration test, we have seen that the fluorescence intensity of multiple low-intensity copy papers is still lower than one high-intensity newsprint paper.
7.10 Effect of Angle of Probe Head and Incident Light
48
Effect of Angle0 0.2 0.4 0.6 0.8 1
0 10 20 30 40 50
Angle of Incident Light (Degrees)
WLP NPS
Fig 7.16 – Effect of angle of probe head
Effect of Angle
0 0.2 0.4 0.6 0.8 1
0 10 20 30 40 50
Angle of Probe Head (Degrees)
WLP NPS
Fig 7.17 – Effect of angle of incident light
From the graphs it can be seen that the as the angle of the probe head/incident light increases, the fluorescence intensity decreases, thus making the vertical position the ideal way to mount the sensor. In the second case (Fig 7.17), the intensity does not drop as low as the first case (Fig. 7.16) because the detector/probe head is placed vertically above the paper sample.
7.11 Effect of Coating