DESIGN AND DEVELOPMENT OF INTELLIGENT KNOWLEDGE DISCOVERY SYSTEM FOR STOCK EXCHANGE DATABASE
DR. MOHD NOOR MD SAP DR. HARIHODIN SELAMAT DR. SITI MARIYAM HJ. SHAMSUDDIN
RASHID HAFEEZ KHOKHAR
ZAMZARINA BT CHE MAT @ MOHD SHUKOR ABDUL MAJID AWAN
RESEARCH VOTE NO: VOT 74080
Faculty of Computer Science and Information Systems Universiti Teknologi Malaysia
ABSTRACT
ABSTRAK
TABLE OF CONTENTS
CHAPTER TITLE PAGE
1 INTRODUCTION 1
1.1 Overview 1
1.2 Problem Background 2
1.2.1 Time Series 2
1.2.2 Linear and Non-linear Statistical Models 4
1.2.3 Neural Networks 4
1.2.4 Support Vector Machine 5
1.2.5 Association Rules 6
1.2.6 Classification 7
1.3 Problem Statement 8
1.4 Objectives of the Project 9
1.5 Scope of the Project 10
1.6 Project Contributions 11
1.7 Project Report Organization 12
2 LITERATURE REVIEW 14
2.1 Introduction 14
2.2 Stock Exchange Mechanism 14
2.2.1 Stock Market Returns 16
2.3 Stock Market Prediction Techniques 18
2.3.1 Traditional Approaches 19
2.3.2 Prediction 21
2.4 Time Series Forecasting 23
2.5 Stock Market Prediction 29
2.5.3 Support Vector Machine (SVM) 33
2.5.4 Association Rules 35
2.5.5 Fuzzy Sets 36
2.5.6 Classification 38
2.6 Decision Tree Classification 40
2.6.1 Crisp Decision Tree 41
2.6.2 Fuzzy Decision Tree 42
2.7 Fuzzy Reasoning Methods 48
2.7.1 Turksen et al.’s Approximate Analogical Reasoning
Schema (AARS) 49
2.7.2 Chen’s Function T (FT) Method 51 2.7.3 Yeung et al.’s Equality and Cardinality (EC) Method 52
2.8 Support Vector Machine 53
2.8.1 Support Vector Machine for Classification Problem 57 2.9 Support Vector Machine for Regression Problem 63
2.10 Summary 65
3 RESEARCH METHODOGLOGY 66
3.1 Introduction 66
3.2 Operational Framework 67
3.2.1 Problem Formulation (phase 1) 67 3.2.2 System Development (phase 2) 68 3.2.2.1 Data Collection and Extraction 69 3.2.2.2 Data Cleaning and Exploration 70 3.2.2.3 Data Engineering 71 3.2.2.4 Algorithm Engineering 72 3.2.2.5 Running the Data Mining Algorithm 78 3.2.3 Implementation and Integration (phase 3) 79 3.2.3.1 Integrated System Components 80 3.2.3.2 System Performance Testing 81
4 INDUCTIVE LEARNING OF PREDICTIVE FUZZY
DECISION TREE 83
4.1 Introduction 83
4.2 Decision Trees Induction 83
4.3 Fuzzy Decision Tree Induction 84
4.4 Stock Market Data Collection and Extraction 90 4.5 Data Cleaning using ESTEEM (Elimination of Suspicious Training Examples with Error on the Model) Method 92 4.6 Predictive Fuzzy Decision Tree (FDT) 94 4.6.1 Centroids of Fuzzy Sets (K-Means Algorithm) 95 4.6.2 Fuzzification of Numerical Number 98 4.6.3 Triangular Membership Function 99 4.6.4 Predictive Fuzzy Decision Tree Algorithm 103
4.7 Summary 106
5 FUZZY REASONING METHOD BASED ON SIMILARITY
TECHNIQUE 107
5.1 Introduction 107
5.2 Weighted Fuzzy Production Rules (WFPRs) 108 5.2.1 Weighted Fuzzy Production Rules with Single
Antecedent 109
5.2.2 Weighted Fuzzy Production Rules with Multiple
Antecedents 110
5.2.3 Transformation of WFPRs from FDT 111
5.3 Knowledge Parameters 111
5.4 Similarity-Based Fuzzy Reasoning Methods 113 5.4.1 Approximate Analogical Reasoning Schema (AARS) 113
5.4.2 Function T (FT) Method 115
5.4.3 Degree of Subsethood (DS) Method 116 5.4.4 Equality and Cardinality (EC) Method 118
5.5.1 Similarity Measure 122
5.5.2 Aggregated Weighted Average 122
5.5.3 Modification Functions (MFs) 123
5.5.4 Rules Propositions 125
5.5.5 Fuzzy Reasoning algorithm 126
5.6 Experiments and Results 128
5.6.1 Applying the Data Mining Process 128
5.6.2 Experimental Design 130
5.6.3 Testing Results and Analysis of FDT 138 5.6.4 Rules Extraction and Experiments 141 5.6.5 Analyzing Prediction Results 146
5.7 Summary 148
6 STOCK MARKET PREDICTION USING SUPPORT VECTOR
MACHINE 150
6.1 Introduction 150
6.2 SVM for Regression Estimation 153
6.3 Weighted Kernel K-Means with Neighborhood Constraints 157
6.3.1 Handling outliers 164
6.3.2 Scalability 164
6.4 Experimental Settings for SVR-forecaster 165
6.4.1 Technical indicators 167
6.5 Experimental Results 171
6.6 Summary 179
7 CONCLUSIONS AND RECOMMENDATIONS 181
7.1 Introduction 181
7.2 Discussion 182
7.2.1 Fuzzy Decision Tree based system 182 7.2.1 Support Vector Regression based System 184
BIBLIOGRAPHY 188
APPENDICES 211
APPENDIX A List of Publications 211
APPENDIX B Algorithm for A-Close method 216
APPENDIX C Expended Attribute Selection Criterion for Fuzzy
Decision Trees 218
APPENDIX D Entropy and Gain Ratio 220
APPENDIX E A Part of Sample Data Used in Some Experiments 223 APPENDIX F Extraction of WFPRs from FDT in single experiment
of stock market data 227
APPENDIX G Case study 1-KLSE 231
APPENDIX H Case study 2-NYSE 232
APPENDIX I Case study 3-LSE 233
LIST OF TABLES
TABLE TITLE PAGE
2.1 Stock market analysis 20
2.2 Techniques applied in time series prediction 22 2.3 Local and global models in time series forecasting 25
2.4 Forecasting methods 27
2.5 Summary of analytical comparison of fuzzy decision trees 47
2.6 FPRs with single antecedent 50
2.7 FPRs with a multiple antecedents 50
2.8 Analysis of existing similarity-based methods 53
2.9 Advantages of SVM 56
2.10 Some well-known kernel functions 63
4.1 A comparison between the fuzzy decision tree and the crisp
decision tree 85
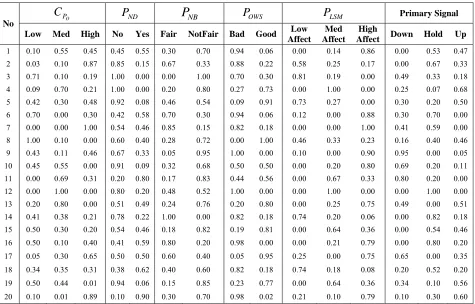
4.2 20 real time (5-Minute Bars) examples of stock market data 91 4.3 Change in stock trading prices for every 5 minutes of time
series stock market 92
4.4 After training real time examples of stock market with fuzzy
representation 102
5.1 Summary of the experiments for I = FuzzyID3, II =
Wang et al., and III = Predictive FDT 139 5.2 An example of 13 extracted WFPRs from FDT in a single
experiment 142
5.3 Testing results for significant rules using prediction in change
5.4 The mean squared error between the actual values and the predicted results for 3-case study stock price indexes is up
to 3 months 146
6.1 Common kernel functions 155
6.2 Independent and dependent variables
(input and output variables) 170
LIST OF FIGURES
FIGURE NO. TITLE PAGE
2.1 Typical trading process 15
2.2 Stock market prediction techniques 18
2.3 Support vector machine 54
2.4 Hyperplane 58
2.5 Separating hyperplanes 58
2.6 Support vectors with maximum margin boundary 59 2.7 Illustration of an SVM construction in 2d feature space 60
2.8 SVM input and feature space 62
2.9 Mapping nonlinear data to a feature space 62
2.10 SVR to fit a tube with radius ε 64
2.11 ε-insensitive regressor 64
3.1 Research operational frame work 68
3.2 System development process 75
3.3 Mainmenu window of the stock market prediction system 76 4.1(a) Fuzzy decision tree using Fuzzy ID3 heuristic
(Umanol et al., 1994) 89
4.1(b) Fuzzy decision tree by Yuan and Shaw’s (1995) heuristic 89 4.1(c) Fuzzy decision tree by using Wang et al., (2001) heuristic 89
4.2 The Esteem method of outlier removal 93
4.3 Procedure for predictive fuzzy decision tree classification
method 95
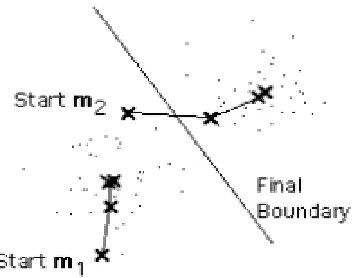
4.4 K-Means algorithms to find centers of the equal patterns 96
4.5 Centroids between two clusters 97
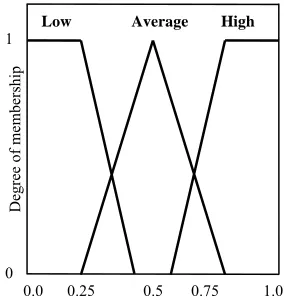
4.6(a) Linguistic terms for oil price 100
4.7 Fuzzy Decision Tree by using predictive FDT algorithm to
train table 4.2 106
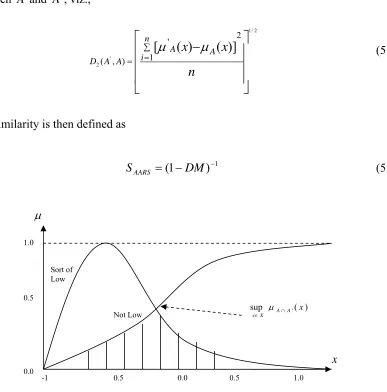
5.1 Disconsistency measure 114
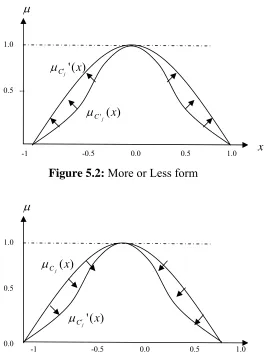
5.2 More or Less form 125
5.3 Membership value reduction form 125
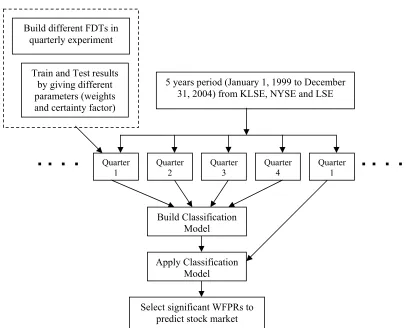
5.4 Experimental design for stock market prediction by using 5 years information (Jan 1, 1999 to Dec 30, 2004) from
KLSE, NYSE and LSE. 131
5.5 Welcome window of the KnowledgeMiner 133
5.6 Steps in the KnowledgeMiner 133
5.7 Selection of the type of stocks to predict 134
5.8 View panel for the extracted rules 135
5.9 Window for selecting long term or short term trading 136 5.10 Window showing results after extracting WFPRs 136
5.11 Window presenting prediction results 137
5.12(a) Experimental results of FuzzyID3, Wang FDT, and
Predictive FDT for KLSE 139
5.12(b) Experimental results of FuzzyID3, Wang FDT, and
Predictive FDT for NYSE 140
5.12(c) Experimental results of FuzzyID3, Wang FDT, and
Predictive FDT for LSE 140
5.13 The prediction process for Jan 1 to March 30, 2005 using the historical stock market data from (Jan 1, 1999 to Dec 30,
2004). 143
5.14 (a) Core Points of the rules for three months prediction 144 5.14 (b) Results using core points of rules for three months
predictions from (Jan 1, 1999 to Dec 30, 2004) 144 5.15(a) Three Months (Jan 1 to March 31, 2005) prediction of
Telekom Index from KLSE using random walk and
predictive FDT 147
5.15(b) Three Months (Jan 1 to March 31, 2005) prediction of DowChemical Index from NYSE using random walk and
5.15(c) Three Months (Jan 1 to March 31, 2005) prediction of ABN-Amro Index from LSE using random walk and
predictive FDT 148
6.1 ε-insensitive regressor; in SV regression, a tube with radius
ε is fitted to the data and positive slack variables ζi
measuring the points lying outside of the tube. 156 6.2 Algorithm WK-means: Weighted Kernel k-means
(weighted kernel k-means with neighborhood constraints) 163
6.3 System development process 166
6.4 MainMenu window of the overall Stock Market Prediction System: A user can select whether to use KnowledgeMiner (based on Fuzzy predictive decision tree) or SVR-Forecaster (based on support vector regression) 167
6.5 Procedural steps for SVR-Forecaster 172
6.6 Selection window of SVR-Forecaster; the user can select the type of stocks, past data, and the number of days
to predict the stock prices 173
6.7 Window showing selected past stock data 174 6.8 Main window of the SVR-Forecaster: user can select the
company along with dates to see the past behavior and future trend of its stock price: Graph showing past and future
predicted stock price values. 175
6.9 Actual and Predicted stock prices for a training period of
100 days 176
6.10 Actual and Predicted stock prices for training period of
LIST OF SYMBOLS AND ABBREVATIONS
O
P - Open price
C
P - Close price
V - Volume
O
P
C - Change in open ={Low,Average,High},
C
P
C - Change in close ={Low,Average,High},
V
C - Change in volume ={Low,Average,High},
) (k i
Entr - Minimum classification information-entropy for each attribute(k)
) (k i
Ambig - Minimum classification ambiguity for each attribute (k)
=
Th λo - Threshold value
CF =µ - Certainty factor
W - Weight for single and multiple antecedent Gw - Weighted average
w
AG - Aggregated weighted average
- Data point
- Cluster centre
k - Linguistic terms
S - Nonleaf node
∇ - Symmetrical difference of A and A'
GR - Gain ratio
A - Antecedent (pattern)
'
C - Consequent of a rule
'
C - Result of consequent
) (x
A
µ - Degree of membership by linguistic term x A
FDT - Fuzzy Decision Tree
WFPRs - Weighted Fuzzy Production Rules FPRs - Fuzzy Production Rules
KDD - Knowledge Discovery in Databases
AARS - Approximate Analogical Reasoning Schema SMP - System Marginal Price
FT - Function T
DS - Degree of Subsethood
IC - Inclusion Cardinality EC - Equality and Cardinality
PR - Predictive Reasoning
KLSE - Kuala Lumpur Stock Exchange NYSE - New York Stock Exchange LSE - London Stock Exchange
CF - Certainty Factor
CHAPTER 1
INTRODUCTION
1.1 Overview
et al., 2005; Cao & Tay, 2003; Kim, 2003). The related problems are mentioned in the following sections.
1.2 Problem Background
The stock market is a rather complicated system, and good predictions for its developments are the key to successful trading. Traders must predict stock price movements in order to sell at top range and to buy at bottom range. As stock trading is a very risky business (Torben and Lund, 1997), it is necessary to evaluate the risks and benefits before entering into any trading. The key to realize high profits in stock trading is to determine the suitable trading time when the risk of trading should be minimum. Many attempts have been made for meaningful prediction of stock market by using data mining and statistical techniques like Time Series (Agrawal et al., 1995a; Breidt, 2002), Support Vector Machine (Cao, 2003; Huang et al., 2005, Kim, 2003, Cao and Tay, 2003, Yang et al., 2002, 2004), Neural Networks (Wang et al., 2003; Raymond, 2004), Linear and Non-linear models (Weiss, 2000; Chinn et al., 2001), Association Rules (Ke and Yu 2000; Sarjon and Sap, 2002a) and Classification approaches (Agarwal et al., 2001; Han, J and Pei, 2000). However, these techniques for predicting the trend of stock market real time data are yet to be achieved as good classifiers (model). The following subsections present some general problem background regarding these techniques for predicting stock market trends, and prompt for the need of designing and developing a knowledge discovery system for this purpose.
1.2.1 Time Series
data are highly time-variant and are normally in a nonlinear pattern, predicting the future trend (i.e., rise, decrease, or remain steady) of a stock is a challenging problem. Agrawal et al. (1995a; 1995b) introduced different similarity queries on time series data to find the behaviors of selling or buying patterns of different stocks. In queries of this type, approximate rather than exact matching is required. Recently, some researchers used data mining techniques for attempting to index, cluster, classify and mine association rules from increasingly massive sources of time series data (Savnik et al., 2002; Yimin and Dit-Yan, 2004).
For example, Keogh and Pazzani (1998) introduce a new scalable time series classification algorithm. Das et al. (1998) attempt to show how association rules can be learned from time series. Han et al. (1999) investigate time series databases for periodic segments and partial periodic patterns using data mining methods. All these algorithms that operate on time series data need to compute the similarity between patterns by using Euclidean distance, and the Euclidean distance is sensitive to the absolute offsets of time sequences.
1.2.2 Linear and Non-linear Statistical Models
The Autoregressive Conditional Heteroskedasticity (ARCH) class of models (Chinn et al., 2001; Pierre and Sébastien, 2004) have become a core part of empirical finance. ARCH is a nonlinear stochastic process, where the variance is time-varying, and a function of the past variance. ARCH processes have frequency distributions which have high peaks at the mean and fat-tails, much like fractal distributions. The issue of forecasting with ARCH models has been discussed by Koenker and Zhao, (1996). However, the procedures developed are restricted to a limited class of ARCH models, and often do not take account parameter of uncertainty, and often have questionable finite sample properties. Another statistical model is Auto Regressive Integrated Moving Average (ARIMA). ARIMA models have been already applied to forecast commodity prices (Weiss, 2000; Chinn et al., 2001). However, since the ARIMA models are linear and most real world applications involve non-linear problems, this introduces a limitation in the accuracy of the predictions generated (Ferreira et al., 2004).
1.2.3 Neural Networks
hidden neurons. As tested in the experiments, no significant improvements appear, it may be due to not finding the optimal architecture and available training methods.
Some of recent studies, however, showed that ANN had some limitations in learning the patterns because stock market data has tremendous noise and complex dimensionality (Kim, 2003). Neural network training requires nonlinear optimization and bears the danger of getting stuck at local minima (Kim, 2003; Huang et al., 2005; Cao and Tay 2003). Back-propagation (BP) neural network, the most popular neural network model, however, suffers from difficulty in selecting a large number of controlling parameters which include relevant input variables, hidden layer size, learning rate, momentum term (Kim, 2003).
1.2.4 Support Vector Machine
Recently, support vector machine (SVM), a novel neural network algorithm, was developed by Vapnik and his colleagues (Vapnik, 1998). SVM is a very specific type of learning algorithms characterized by the capacity control of the decision function, the use of the kernel functions and the sparsity of the solution (Vapnik, 1995, 1998; Cristianini & Taylor, 2000). Many traditional neural network models had implemented the empirical risk minimization principle, whereas SVM implements the structural risk minimization principle. The former seeks to minimize the mis-classification error or deviation from correct solution of the training data but the latter searches to minimize an upper bound of generalization error. In addition, the solution of SVM may be global optimum while other neural network models may tend to fall into a local optimal solution. Thus, over-fitting is unlikely to occur with SVM.
Support Vector Regression (SVR), has also been successfully applied in the time series prediction (Mukherjee et al., (1997), especially in the financial time series forecasting (Cao, 2003; Huang et al., 2005, Kim, 2003, Cao and Tay, 2003, Yang et al., 2002, 2004). This model, using the ε-insensitive loss function, can control the sparsity of the solution and reduce the effect of some unimportant data points. Extending this loss function to a general ε-insensitive loss function with adaptive margins has shown to be effective in the prediction of the stock market (Yang et al., 2002, 2004). In financial data, due to the embedded noise, one must set a suitable margin in order to obtain a good prediction (Yang et al., 2002). Yang et al., (2002) has extended the standard SVR with adaptive margin and classified into four cases. The model proposed by them requires the adaptation of the margin width and the degree of asymmetry.
In modeling the financial time series, one key problem is its high noise, or the effect of some data points, called outliers, which differ greatly from others. Learning observations with outliers without awareness may lead to fitting those unwanted data and may corrupt the approximation function. This will result in the loss of generalization performance in the test phase. Hence, detecting and removing the outliers are very important. Specific techniques, e.g., a robust SVR network (Chuang et al., 2002) and a weighted Least Squares SVM (Suykens et al., 2001) have been proposed to enhance the robust capability of SVR. Some researchers tend to include novel factors in the learning process (Ince & Trafalis, 2004; Kim, 2003, Cao and Tay, 2003).
1.2.5 Association Rules
support threshold in large databases like stock market and also cannot generate association rules at higher levels. In another attempt, typical algorithms for discovering frequent itemsets in stock market by using association rules operate in a bottom-up, breadth-first search direction (Lin and Kedem, 2002). The computation starts from frequent 1-itemsets (the minimum length frequent itemsets) and continues until all maximal (length) frequent itemsets are found. During the execution, every frequent itemset is explicitly considered. Such algorithms perform well when all maximal frequent itemsets are short. However, performance drastically depreciates when some of the maximal frequent itemsets are long.
1.2.6 Classification
Among various approaches for discovering different kinds of knowledge from large databases, classification has been recognized as an important problem in data mining (Agarwal et al., 2001; Huang and Hsu, 2002). Classification is one kind of data mining technique to identify essential features of different classes based on a set of training data and then classify unseen instances into the appropriate classes. Many popular classification techniques, Apriori-like approach (Agarwal et al., 2001; Ma, 2004), FP-growth (Han and Pei, 2000; Xu et al., 2002), Naive Bayes’ Classifier (Huang and Hsu, 2002), Decision Theoretic Model (Elovici and Braha, 2003), Information Network (Last and Maimon, 2004) have been used as data mining problems. These approaches are still not suitable where the real databases contain all records. In such cases, huge space is required to serve the mining, and large applications need more scalability.
exchange rate. In another study, Aggarwal and Demaskey (1997) find that the classification performance of cross-hedging improves significantly if rates can be predicted. O’Connor et al., (1997) conduct a laboratory-based experiment and conclude that individuals show different tendencies and behaviors for upward and downward series. The findings in these studies are reasonable because accurate point estimation, as judged by its deviation from the actual observation, may not be a good predictor of the direction of change in the instruments price level.
1.3 Problem Statement
In recent years, there have been a growing number of studies looking at the direction or trend of movements of stock market indices with various kinds of statistical and data mining techniques (such as Mark et al., 2000; Elovici and Braha, 2003; Zhang and Zhou, 2004). However, as discussed in the problem background, these techniques have some limitations to handle time series and huge stock market data. Also, none of these studies provide a comparative evaluation of different classification techniques regarding their ability to predict the sign of the index return. Among the variety of data mining techniques, classification has been found to scale well, run fast, and produce highly interpretable results. Therefore, there is a critical need for developing an intelligent knowledge discovery system to predict the stock market behavior.
In this project, one of the main focus is on the development of classification data mining model to identify better decision making classifiers for stock market prediction. To achieve this, decision tree with fuzzy sets has been used to build classification models for predicting classes of unseen records. The predictive FDT algorithm and similarity-based fuzzy reasoning method are used to answer the following research questions:
• How the trader’s expectations can be fulfilled by handling uncertainty factors including political situation, oil price, overall world situation, local stock markets, etc.?
• How the optimal predictive FDT can be constructed that has better comprehensibility (number of rules), less complexity (number of nodes) and better learning accuracy?
• How similarity-based fuzzy reasoning method can improve the learning accuracy of generated weighted fuzzy production rules for the prediction of stock market data?
Moreover, we also explored how support vector machine can be applied for financial forecasting? How the prediction performance of the forecasting system can be improved by preprocessing the data in order to handle noise and outliers in the data? How the technical indicators, like volatility, relative strength index, moving average convergence divergence, relative difference in percentage, etc., affect the prediction performance?
1.4 Objectives of the Project
The objectives of this project are to build an accurate model by using computational intelligence techniques, like classification, fuzzy sets and support vector machine, in order to make the methods accessible, user-friendly, and prepared for the broader population of economists, analysts, and financial professionals. The main objectives of this project are as follows:
• To develop and enhance data mining algorithms for extracting the patterns of knowledge from stock market database.
• To disseminate and promote data mining technology in the financial and stock exchange industries.
1.5 Scope of Project
This project focuses on the enhancement of data mining algorithms in financial application. In data mining algorithms, classification model has been developed to extract the weighted fuzzy production rules for time series stock market prediction. In addition, a support vector machine based model is also implemented for the improvement of prediction results. The scope of this project covers the following points:
• Reviews and comparisons of the existing data mining methods for predicting future trends and behaviors in financial markets.
• Analyze and evaluate the performance of the predictive FDT algorithm by using data from three stock exchanges, i.e. KLSE, LSE, and NYSE.
• Test and analyze the predictive FDT algorithms on the chaotic and complex nature of intraday stock market data from 100 different associate stocks.
• Analyze and evaluate the results of predictive FDT and similarity-based fuzzy reasoning method for prediction of real time stock market.
• Test and analyze the results of support vector regression by incorporating some preprocessing and technical indicators
• Analyze and evaluate the results of SVR with backpropagation neural networks
1.6 Project Contributions
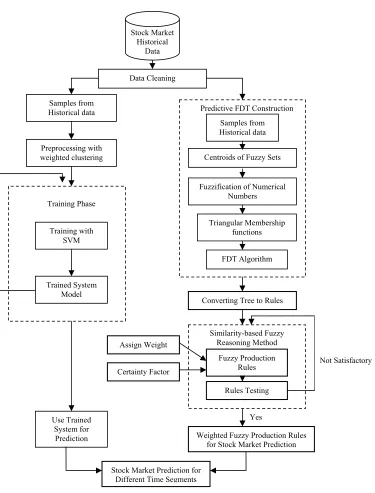
In this project, the data mining and artificial intelligence techniques are used to build classification model for stock market prediction. The knowledge discovery system developed in this project can produce accurate and effective information in order to facilitate economic activities. The system consists of mainly two parts: i) based on Fuzzy decision tree (FDT); and ii) based on support vector regression (SVR). In the FDT method: first we construct predictive fuzzy decision tree (FDT) with expressive power of fuzzy reasoning method, and then; for stock market prediction significant weighted fuzzy production rules (WFPRs) are extracted from predictive FDT. The SVR Prediction System is based on Support Vector machines approach. Weighted kernel based clustering method with neighborhood constraints is incorporated in this system for getting improved prediction results. Looking at the forecasting results presented by the two methods, i.e. FDT & SVR methods, the trader can confidently decide whether to buy a stock.
Some points of major contributions of this project are described as follows:
• The enhancement of classification based data mining algorithms to predict trends and behaviors in financial market.
• The construction of predictive fuzzy decision tree for classification, that provides the reasonable performance of the parameters like comprehensibility (number of rules), complexity (number of nodes), and predictive accuracy.
• Careful assignment of some uncertainty factors including oil price, local stock market, natural disasters, etc., for the classification of stock market index.
antecedent parts to have various degree of relative importance with respect to the same consequent.
• Enhancement of prediction results of SVR by incorporating our developed clustering algorithm–weighted kernel kmeans with neighborhood constraints–able to handle noise and outliers. Because, in the financial time series, the recent data points could provide more important information than the distant data points, in the weighted clustering algorithm, the weights are assigned accordingly.
• Enhancement of prediction performance by considering the technical indicators, like volatility, relative strength index, moving average convergence divergence, relative difference in percentage, etc.
1.7 Project Report Organization
CHAPTER 2
LITERATURE REVIEW
2.1 Introduction
In pursuit of developing an intelligent knowledge discovery system, statistical and data mining techniques are addressed and some important issues related to predicting future trends and behaviors in financial markets are discussed in this chapter. Some difficulties with existing classification techniques are also discussed to build accurate and efficient classifiers for data mining of time series stock market data. Three most popular fuzzy decision trees are discussed to underline how fuzzy decision trees are more suitable than the existing stock selection techniques in the perspective of knowledge discovery in databases. In this regard, three popular similarity-based fuzzy reasoning methods are addressed to mine significant WFPRs. Moreover, it is also discussed how support vector machine can be useful for stock market prediction.
2.2 Stock Exchange Mechanism
(Okamoto et al., 1995). A person X decides to invest in securities. Therefore, he asks a broker from a Stock Exchange Company to search for the best investment possible for a long-term period. The optimization goal is to obtain the good with the best relation between bid and offer.
Buying Investors
Buying Brokers
STOCK EXCHANGE
Selling Investors Selling
Brokers Fund
Securities
Figure 2.1: Typical trading processes.
On the other hand, a different person, Y, wants to have quickly some liquidity, in order to purchase some expensive goods. Therefore, he decides to sell some shares of a company, and contacts his broker and encharges him with the job. Both brokers access the electronic market data system and acquire data about the quotes on the market.
The floor brokers on the trading post try to get the best price for their customers, and the brokers representing persons X and Y agree finally on a price. The transaction is entered electronically, and persons X and Y are informed. Through the computer, the transaction is reported within minutes and appears on tickertapes across the country and around the world.
The transaction takes place electronically, crediting X's brokerage firm and debiting Y's. X settles its account within 3 business days, by paying for the amount A and a commission to his broker. Y settles its account within 3 business days, by collecting the money from the broker minus the commission.
The Stock Exchange is, in short terms, an auction market, where stocks are bought and sold at prices determined by the bids and offers of investors. These are represented on the trading floor by floor professionals, who use their skill, judgment and experience in order to obtain the best possible prices for their customers. The whole process is supported and made easier by the extensive usage of advanced technology. The stock exchange is the place where securities–negotiable investment claims against assets and their periodical return–are bought and sold (Fritz, 1940).
2.2.1 Stock Market Returns
Because the stock price patterns have non-linear time elasticity and differences in names and time spans, it is difficult to find these patterns by statistical models or simple rule-based approaches (Tetsuji et al., 1992). Several researchers claim that the stock market and other complex systems exhibit chaos, a nonlinear deterministic process which only appears random because it can not be easily expressed (Raman, 1997).
Many researches have been carried out in order to provide financial analysts with a clear direction with which they can predict movements of stocks in a certain direction. The ability of the network to keep updating it with historical information will allow it to predict the data even more accurately and thus aim to increase the profitability for the investors and the users. Some aspects that wish to be achieved by current researchers include (Asim et al., 2005):
• To aid the users to make valuable decisions by using intelligent computational techniques.
• Help the investors to generate and maximize their profits out of the investments they make in the stock market.
• Reduce the risk involved when investing in stocks. • Support the users in an efficient portfolio management
Stock market is a type of time series forecasting where it takes an existing series of data and forecast the future data values. Data of daily stock price can be treated as a time series. If we have the daily prices of a certain period, they can be fed to a network which predicts the future price of the first day following the end of the known period. We repeat this process iteratively to predict the price for the future working days (Saad
et al., 1996). In recent decades, an increasing focus has been put on this time series forecasting field especially on stock market prediction.
Apparently, it is significant for investors to estimate the stock price and then select the trading opportunities accurately in advance, which will bring high return to stockholders (Jing et al., 1997). Consequently, investors are seeing the need for flexible forecasting models.
2.3 Stock Market Prediction Techniques
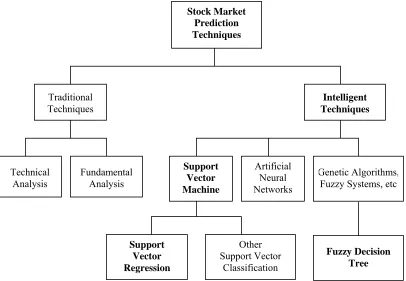
Normally, techniques on stock market prediction can be divided into two main categories. They are traditional techniques and intelligent techniques. The traditional techniques can be further categorized into technical analysis and fundamental analysis. Nowadays, intelligent techniques have become the main focus of the current researches and have been widely applied in stock market prediction.
Technical Analysis
Traditional
Techniques Techniques Intelligent
Fundamental Analysis
Artificial Neural Networks
Support Vector Machine
Genetic Algorithms, Fuzzy Systems, etc
Support Vector Regression
Fuzzy Decision Tree
Other Support Vector
Classification
Stock Market Prediction Techniques
The intelligent techniques consist of ANN, GA, Fuzzy Systems, SVM and others. These intelligent techniques are the superior prediction techniques that are widely applied by many individuals, including researchers, investment professionals and average investors. Figure 2.2 shows the techniques that have been applied in stock market prediction field (Teh, 2005).
2.3.1 Traditional Approaches
In the past, the major forecasting methods used in the financial area are either technical analysis or fundamental analysis before the introduction of intelligent techniques.
In a typical free market, trading is stimulated by the market moving prices up to tempt the sellers or moving prices low enough to attract the buyers. This price fluctuation thus behaves as a goad for promoting opportunities. The market as a result tries to establish an equilibrium between buying and selling forces. This dynamic mechanism of trading has inspired traders to predict the future trends of the market (Jang
et al., 1991).
Table 2.1: Stock market analysis. Analysis Types Descriptions
Fundamental analysis
• Forecasting is based on macro economic data such as exports and imports, money supply, interest rates, foreign exchange rates, inflationary rates and unemployment figures, etc.
• Basic financial status of companies is also taken into consideration.
Technical Analysis
• Predictions are made by exploiting implications hidden in past trading activities by analyzing patterns and trends shown on the price and volume charts.
• Based on the rationale that history will repeat itself and that the correlation between price and volume reveals market behavior. • Does not take any external influential factors, like breaking news,
into consideration.
• It is a method of evaluating securities by analyzing statistics generated by market activity, past prices, and volume. • Does not attempt to measure a security's intrinsic value. • Looks for patterns and indicators on stock charts that will
determine a stock’s future performance (Investopedia, 2006).
2.3.2 Prediction
Today the field of financial market research seems to be at the exciting stage of "crisis"–past results are being questioned, and new solutions are being proposed. In recent years, analysts have suggested that time series models better predict the price of the stock as compared to the traditional approaches (Asim et al., 2005). The forecasting of financial time series relies on the discovery of strong empirical regularities in observations of the system. Because these regularities are often masked by noise and time series often have nonlinear and non-stationary behavior it has been suggested that some financial time series are very difficult to predict.
According to Fayyad et al. (1996), prediction, or also known as regression, is a learning function that maps a data item to a real-valued prediction variable. Regression is the study of relationships among variables, a principal purpose of which is to predict, or estimate the value of one variable from known or assumed values of other variables related to it. Once the pattern is established, we can interpret and integrate it with other data. Besides that, prediction is also associated with the discovery and use of patterns in large volumes of time series data in which prediction of future values can be made (Liu
et al., 2001).
Table 2.2: Techniques applied in time-series prediction. Techniques Description
Smoothing Smoothing techniques are used to reduce irregularities (random
fluctuations) in time series data. They provide a clearer view of the true underlying behavior of the series.
Exponential Smoothing
Exponential smoothing is a smoothing technique used to reduce irregularities (random fluctuations) in time series data, thus providing a clearer view of the true underlying behavior of the series. It also
provides an effective means of predicting future values of the time series (forecasting).
Moving Average Smoothing
A moving average is a form of average which has been adjusted to allow for seasonal or cyclical components of a time series. Moving average smoothing is a smoothing technique used to make the long term trends of a time series clearer.
Running Medians Smoothing
Running medians smoothing is a technique analogous to that used for moving averages. The purpose of the technique is the same, to make a trend clearer by reducing the effects of other fluctuations.
Differencing Differencing is a popular and effective method of removing trend from a time series. This provides a clearer view of the true underlying behavior of the series.
Autocorrelation Autocorrelation is the correlation (relationship) between members of a time series of observations, such as weekly share prices or interest rates, and the same values at a fixed time interval later.
The classic (1970s) time series analysis approach uses a Box Jenkins algorithm to transform the data from a stationary process into Auto Regression and Moving Average components, the so-called ARMA. The method allows estimation of actual pulses or inclusion of forecast pulses that do not fit the ARMA methodology (Box and Jenkins, 1976).
Artificial neural network (ANN) is a non-linear, data-driven approach that depends on the available data to be “learned”, without any a priori hypothesis about the kind of relationship, which makes it suitable for complex data. However, neural network depends on network structure and complexity of samples, which cause over fitting and low generalization (Lin and Lin, 2003; Kim and Valdes, 2003; Zhu et al., 2002). This approach relies on building layers of nodes, each connected to a preceding layer through weights. By adding more and more layers, and incorporating memory delay lines so that previous inputs can be stored, the output of the network can come to resemble the time series (Junaida, 2005).
Support Vector machine is a new machine learning algorithm that have received much attention among researchers due to its principle of structural minimization risk which have greater generalization and proved success in time series prediction (Johan, 2001). SVM works by finding a hyperplane that separates the training set in a feature space induced by a kernel function used as the inner product in the algorithm (Cristianini and Taylor, 2000). The successes of SVM in time series prediction are evident from several researches; stock price forecasting (Bao et al., 2004), traffic speed prediction (Vanajakshi and Rilett, 2004) and travel time series prediction (Wu et al., 2004).
2.4 Time Series Forecasting
• continuous vs. discrete • univariate vs. multivariate
• evenly sampled vs. unevenly sampled • periodic vs. aperiodic
• stationary vs. nonstationary • short vs. long
These properties, as well as the sampling interval and temporal overlap of multiple series, must be considered in selecting a dataset for analysis.
According to (Bowerman & O’Connell, 1979), forecasting is the act of making prediction of future events and conditions while time series data is used in making predictions. In recent years, much literature on time series prediction have been utilizing numerous time series data with prediction methods that include exchange rate data, stock market index, air pollutant data, electricity load data and traffic speed data (Toth et al., 2000; Kamruzzaman et al., 2003; Lu et al., 2002; Chen et al., 2004; Vanajakshi & Rilett, 2004).
In general, there are two main goals of time series analysis and prediction:
• Identifying the nature of the phenomenon represented by the sequence of observations in the past and by the sequence of other system variables (supporting attributes) in case of the multivariate time series
• Forecasting – predicting future values of the phenomenon.
Different approaches have been investigated in time series prediction over the years (Weigend, 1993). The methods can be generally divided into global and local models as given in Table 2.3.
Table 2.3: Global and local model in time series forecasting. Models Descriptions
Global model • Only one model is used to characterize the phenomenon under examination.
• Generally better results with stationary time series. Stationary series are series that do not change with time (Jan et al., 2003).
Local model • Dividing the data set into smaller sets, each being modeled with a simple model.
Using a statistical approach, the integrated autoregressive moving average (ARIMA) methodology have been developed (Box et al., 1994). The methodology is useful for fitting a class of linear time series models. Statisticians in a number of ways have addressed the restriction of linearity in the Box-Jenkins approach. Robust versions of various ARIMA models have been developed. More recently, machine learning techniques (mainly neural networks) have been studied as an alternative to these nonlinear model-driven approaches. The process of constructing the relationships between the inputs and output variables is addressed by certain general-purpose ‘learning’ algorithms (Jan et al., 2003).
• Trend - referred to the upward or downward movement that characterizes a time series over a period of time.
• Cycle - refers to recurring fluctuations around trend levels which can last from 2 to 10 years or even longer measured from the peak to peak. • Seasonal variations - defined as periodic patterns in a time series that are
completed within the period of a calendar year and are then repeated on a yearly basis.
In forecasting, it is important to take into account the different components of time series since no forecasting technique best suits to every time series components (Bowerman & O’Connell, 1979). The analysis of time series, which exhibits seasonal variation, depends on whether it is appropriate to measure the seasonal effect or eliminate seasonality. In a study by Chen et al. (2004) in load forecasting, they found out that seasonality helps to improve prediction performance due to the capability of an SVM model to identify the patterns embedded in the electricity load.
Before discussing into detail on stock market prediction, it is better to understand about the useful forecasting methods. Table 2.4 enlists some commonly used forecasting methods.
Table 2.4 Forecasting methods (Hossein, 1996).
Methods Descriptions
Multiple Regression Analysis
Used when two or more independent factors are involved-widely used for intermediate term forecasting. Used to assess which factors to include and which to exclude. Can be used to develop alternate models with different factors. Nonlinear
Regression
Does not assume a linear relationship between variables-frequently used when time is the independent variable.
Trend Analysis Uses linear and nonlinear regression with time as the explanatory variable-used where pattern over time.
Decomposition Analysis
Used to identify several patterns that appear simultaneously in a time series-time consuming each time it is used-also used to deseasonalize a series.
Moving Average Analysis
Simple Moving Averages-forecasts future values based on a weighted average of past values-easy to update.
Weighted Moving Averages
Very powerful and economical. They are widely used where repeated forecasts required-uses methods like sum-of-the-digits and trend adjustment methods. Adaptive Filtering A type of moving average which includes a method of learning from past
errors-can respond to changes in the relative importance of trend, seasonal, and random factors.
Exponential Smoothing
A moving average form of time series forecasting-efficient to use with seasonal patterns- easy to adjust for past errors-easy to prepare follow-on forecasts-ideal for situations where many forecasts must be prepared-several different forms are used depending on presence of trend or cyclical variations.
Hodrick-Prescott Filter
This is a smoothing mechanism used to obtain a long term trend component in a time series. It is a way to decompose a given series into stationary and
nonstationary components in such a way that there sum of squares of the series from the nonstationary component is minimum with a penalty on changes to the derivatives of the nonstationary component.
Modeling and Simulation
Model describes situation through series of equations-allows testing of impact of changes in various factors-substantially more time-consuming to construct-generally requires user programming or purchase of packages such as
SIMSCRIPT. Can be very powerful in developing and testing strategies otherwise non-evident.
Probabilistic Models Use Monte Carlo simulation techniques to deal with uncertainty-gives a range of possible outcomes for each set of events.
Time series data are of growing importance in many new database applications, such as data mining. A time series is a sequence of real numbers, each number representing a value at a time point. For example, the sequence could represent stock or commodity prices, sales, exchange rates, weather data, biomedical measurements, etc. Different similarity queries on time-series have been introduced (Agrawal et al., 1995a, 1995b). For example, a user may want to find stocks that behave in approximately the same way (or approximately the opposite way) for hedging, or to find products that had similar selling patterns during the last year or years when the temperature patterns in two regions of the world were similar. In queries of this type, approximate rather than exact matching is required. However mining different queries from huge time-series data is one of the important issues for researchers. In useful data mining techniques like classification and clustering, to handle time-series data is one of the stimulating research issues.
Recently there has been an explosion of interest in time series data mining, with researchers attempting to index, cluster, classify and mine association rules from increasingly massive sources of data (Han et al., 1999; Savnik et al., 2002; Yimin & Dit-Yan, 2004). For example, Keogh and Pazzani (1998) introduce a new scalable time series classification algorithm. Das et al. (1998) attempt to show how association rules can be learnt from time series. It uses a sliding window to discretize the time series and then cluster these subsequences using a suitable measure of patterns. From these patterns they can find rules relating patterns in a time series to other patterns in that series, or patterns in one series to patterns in another series. Han et al. (1999) investigate time series databases for periodic segments and partial periodic patterns using data mining methods. Their techniques are aimed at discovering temporal patterns.
However, the Euclidean distance is sensitive to the absolute offsets of time sequences, so two time sequences that have similar shapes but with different vertical positions may be classified as dissimilar. And, also these methods are very sensitive to the computational algorithm with regard to the window’s width and the distance.
Savnik et al. (2002) present an algorithm for matching sequences with the set of time series. The algorithm can be employed for locating the starting time points of the undated sequences of values, and for locating the pattern templates which are common to the set of sequences. The algorithm was successfully used for the problems of dating and pattern recognition in tree-ring time series. However, the matching algorithm is not enough to be effectively used for other domains including stock market data, sensor data in engineering environments, and medical measurements. The model-based clustering method (Yimin and Dit-Yan, 2004) can incorporate prior knowledge more naturally in finding the correct number of clusters. Also, for time series data, they provide a principled approach for handling the problem of modeling and clustering time series of different lengths. However, the clustering performances of model-based clustering method degrade significantly when the underlying clusters are very close to each other. Another problem is that it is not designed for modeling the differences in trend of the time series.
2.5 Stock Market Prediction
In stock market, shares of stocks are bought and sold in an organized way for people to buy and sell stocks and corporations to raise money. Predicting stock market has been a research topic in the field of financial engineering for many years. Several recent researches presented encouraging results on stock market prediction using statistical and data mining techniques.
development of computer hardware and software and the rapid computerization of business, huge amount of data have been collected and stored in databases. The rate at which such data is stored is growing at a phenomenal rate. As a result, traditional ad hoc mixture of statistical techniques and data management tools are no longer adequate for analyzing this vast collection of data. Several domains where large volumes of data are stored in centralized or distributed databases include the financial Investment (e.g., stock indexes and prices, interest rates, credit card data) (Dwinnell et al., 2002). In the following subsections, some useful data mining and statistical methods for the prediction of time series stock market data are discussed.
2.5.1 Linear and Non-Linear Statistical Models
The autoregressive conditional heteroskedasticity (ARCH) model, a class of models, was originally introduced by (Engle, 1982) and has become a core part of empirical finance. The issue of forecasting with these models has been discussed by (Baillie and Bollerslev, 1992; Koenker and Zhao, 1996). However, the procedures developed are restricted to a limited class of ARCH models, often do not take account of parameter uncertainty, and often have questionable finite sample properties (Baillie and Bollerslev, 1992). Gaussian asymptotic prediction intervals were developed for the class of ARMA-GARCH models. However, for other ARCH models, such as ARCH-in-mean (Engle et al., 1987), analytical closed form formulae for prediction intervals do not currently exist.
the ARIMA models are linear and most real world applications involve non-linear problems, this introduces a limitation in the accuracy of the predictions generated (Ferreira et al., 2004). In order to overcome this limitation, many other approaches have been developed by independent researches such as the bilinear models (Subba and Gabr, 1984), the threshold models (Ozaki, 1985), the exponential autoregressive models (Priestely, 1988), and the general state dependent models (Rumelhart and McCleland, 1987). However these nonlinear models are still limited in that an explicit relationship for the data series at hand has to be hypothesized with little knowledge of the underlying data generating process.
2.5.2 Artificial Neural Networks (ANNs)
Recent research activities in artificial neural networks (ANNs) have shown that ANNs have powerful pattern classification and pattern recognition capabilities (Wang, 2003; Raymond, 2004). Inspired by biological systems, particularly by research into the human brain, ANNs are able to learn from and generalize from experience. Currently, ANNs are being used for a wide variety of tasks in many different fields of business, industry and science (Widrow et al., 1994).
If a consensus has arisen regarding ANNs, it is that they can outperform traditional models in certain situations, but neither approach dominates the other (Callen
independent and dependent variables, the existence of upper or lower thresholds for the influence of independent variables, or differences between forecasting up or down movements of the dependent variable. The advantage of using an ANN is that the researcher need not know the type of functional relationship that exists between the independent and dependent variables (Darbellay and Slama, 2000).
Szkuta et al. (1999) present the system marginal price (SMP) short-term forecasting implementation using the ANN computing technique. The described approach uses the three-layered ANN paradigm with back-propagation. The retrospective SMP real world data acquired from the deregulated Victorian power system was used for training and testing the ANN. Despite the fact that the achieved results were very satisfactory but the training data set was relatively small which together with the large daily variation in SMP made the ANN model rather difficult to evaluate. The model response appeared highly sensitive to the training parameters.
Using neural networks to model and predict stock market returns has been the subject of recent empirical and theoretical investigations by academics and practitioners alike (Wang et al., 2003). However several design factors significantly impact on the accuracy of neural network forecasting. Wang et al. (2003) investigate whether trading volume can significantly improve the forecasting performance of neural networks, or whether neural networks can adequately model such nonlinearity. Such types of neural networks cannot handle the nonlinearity between stock return and trading volume. Also, trading volume cannot significantly improve the forecasting accuracy of the suggested (Wang et al., 2003) neural networks. And, the improvements, if any, in mean absolutely percentage errors are quite erratic and infrequent by using neural networks.
effectiveness of iJADE Stock Advisor for online stock prediction. From an application point of view, Raymond (2004) demonstrates how HRBFN model can be successfully integrated with mobile-agent technology to provide a truly intelligent, mobile and interactive stock advisory solution. However, the model appeared highly sensitive to the training parameters and also these methods have various numbers of hidden neurons. As tested in the experiments, no significant improvements appear, it may be due to not finding the optimal architecture and available training methods.
Several distinguishing features of neural networks make them valuable and attractive for a forecasting task. Similarly many of the publications on financial markets by neural network researches have an “ad-hoc” or “financial engineering” flavor and do not relate to the broader theoretical infrastructure and “behavioral assumption” used in Economics and Finance. For this reason, unfortunately the broader academic community in Economics and Finance do not take much of this research seriously.
Some of recent studies, however, showed that ANN had some limitations in learning the patterns because stock market data has tremendous noise and complex dimensionality (Kim, 2003). Neural network training requires nonlinear optimization and bears the danger of getting stuck at local minima (Kim, 2003; Huang et al., 2005; Cao and Tay 2003). Back-propagation (BP) neural network, the most popular neural network model, however, suffers from difficulty in selecting a large number of controlling parameters which include relevant input variables, hidden layer size, learning rate, momentum term (Kim, 2003).
2.5.3 Support Vector Machine (SVM)
Cristianini & Taylor, 2000). Many traditional neural network models had implemented the empirical risk minimization principle, whereas SVM implements the structural risk minimization principle. The former seeks to minimize the miss-classification error or deviation from correct solution of the training data but the latter searches to minimize an upper bound of generalization error. In addition, the solution of SVM may be global optimum while other neural network models may tend to fall into a local optimal solution. Thus, over-fitting is unlikely to occur with SVM.
Recently, due to the advantage of the generalization power with a unique and global optimal solution, the Support Vector Machine (SVM) has attracted the interest of researchers and has been applied in many applications, e.g., pattern recognition (Burges, 1998), and function approximation (Vapnik et al., 1997). Its regression model, the Support Vector Regression (SVR), has also been successfully applied in the time series prediction (Mukherjee et al., 1997), especially in the financial time series forecasting (Cao, 2003; Huang et al., 2005; Kim, 2003; Cao and Tay, 2003; Yang et al., 2002, 2004). This model, using the ε-insensitive loss function, can control the sparsity of the solution and reduce the effect of some unimportant data points. Extending this loss function to a general ε-insensitive loss function with adaptive margins has shown to be effective in the prediction of the stock market (Yang et al., 2002, 2004). In financial data, due to the embedded noise, one must set a suitable margin in order to obtain a good prediction (Yang et al., 2002). Yang et al. (2002) has extended the standard SVR with adaptive margin and classified into four cases. The model proposed by them requires the adaptation of the margin width and the degree of asymmetry.
robust capability of SVR. Some researchers tend to include novel factors in the learning process (Ince & Trafalis, 2004; Kim, 2003, Cao and Tay, 2003). Detail about SVM is given in section 2.8.
2.5.4 Association Rules
Association rule is a popular data mining task for discovering knowledge from large amount of data in databases. It has been applied successfully in a wide range of business predicting problems (Bing and Wynne, 1999; Ke et al., 2000; Sarjon and Sap 2002a). Pasquier and Bastide (1997) proposed a new efficient algorithm, called a-close, for finding frequent closed itemsets and their support in a stock market database. A-close algorithm used A-closed itemset lattice framework that can be used for discovering frequent itemsets from stock market. Some advantages of a-close method and algorithms for the generation of all frequent itemsets and reduced itemsets from a database can be found in appendix B. However, a-close method is costly when mining long patterns or with low minimum support threshold in large database like stock market, and also it cannot generate association rules at higher levels. Typical algorithms for discovering frequent itemsets in stock market by using association rules operate in a bottom-up, breadth-first search direction (Lin and Kedem, 2002). The computation starts from frequent 1-itemsets (the minimum length frequent itemsets) and continuous until all maximal (length) frequent itemsets are found. During the execution, every frequent itemset is explicitly considered. Such algorithms perform well when all maximal frequent itemsets are short. However, performance drastically depreciates when some of the maximal frequent itemsets are long.
for different rules, and (ii) enable users to achieve the goal of having higher minimum support for rules that only involve frequent item-sets, and having lowering minimum support for rules that involve less frequent items. However, this method cannot discover association rules from different abstraction levels since it is conducted for mining association rules from raw data, and also it cannot identify which of the generated rules are interesting or not since it does not apply measurement association rules techniques.
Intelligent Mining Association Rules (IMAR) is another method for stock market prediction proposed by Sarjon and Sap (2002a; 2002b). IMAR consists of two main steps; training and running steps. In the training step, neural network knowledge base of data cleaning is created. Then, association rules step is used on the created neural networks knowledge base to support the running step for generating learnt complete data, transformed data and interesting rules intelligently and accurately. IMAR can reduce the number of generated interesting rules without loss of information and increase the performance accuracy up to 99% (Sarjon and Sap, 2002a; Sarjon and Sap, 2002b). IMAR has the following limitations: 1) cannot handle incomplete categorical and text data, 2) transforming raw data into higher levels and other data types, i.e. categorical and text data.
2.5.5 Fuzzy Sets
manner by using fuzzy sets and knowledge discovery in databases (Umanol et al., 1994; Wang et al., 2001; Dong and Kothari, 2001).
Experts predict the stock market using vague, imperfect and uncertain knowledge. As stock market prediction involves imprecise concepts and imprecise reasoning, fuzzy logic is a natural choice for knowledge representation. Fuzzy logic, founded by Zadeh (1965), is formalism for reasoning with vague knowledge. Hiemstra (1994) presents a forecasting support system that uses a fuzzy logic model for the prediction of quarterly stock market excess returns. The excess return is the market return minus the risk-free rate of return and is important for asset allocation, the diversification of an investment portfolio among the diversification of an investment portfolio among asset classes like stocks and cash. The basic model (Hiemstra, 1994) shows acceptable performance, however, given the great number of design parameters, tuning is too complex to follow a trial and error approach.
Pellizzari and Pizzi (1997) develop a fuzzy local approach to model and forecast time series. The method appears to be flexible both in modeling nonlinearities and in coping with weak non-stationarities. They estimate local linear approximation (LLA) by a fuzzy weighted regression and test the model on data from a simulated noisy chaotic map and on two real financial time series, namely FIAT daily stock returns and USD-LIT exchange return rates. The LLA produces very accurate forecasts and is able to identify the correct order of the chaotic map (Pellizzari and Pizzi, 1997). However, LLA might be more difficult to model when dealing large financial datasets because of structural changes and other irregularities.
approaches to get better fit and forecasts? It might be possible that a local approach might better cope with non-stationary and nonlinearity possibly present in financial data. Some kind of stationary behavior is of course necessary to estimate meaningful parameters and suppose that the data generating process is locally stable in some sense.
Complexity and vagueness of above issues lead us to consider some elements of fuzzy logic. Moreover, a fuzzy approach need not assume restrictive hypothesis on the underlying data generating process and can be intuitively interpreted in terms of similarity concepts. If desired, this technique can be embedded in a statistical framework to obtain sound probabilistic results (Pellizzari and Pizzi, 1997). Trying to get the best from the above ideas, WFPRs approach has been used in this project.
2.5.6 Classification
Building accurate and efficient classifiers for large databases is one of the essential tasks of data mining and machine learning research. Given a set of cases with class labels as training set, classification is to build a model (classifier) to predict future data objects for which the class label is unknown. Common classification methods are Apriori-like approach (Agrawal, 1994; Klemettinen et al., 1994), FP-growth (Han and Pei 2000; Xu et al., 2002), Naive Bayes Classifier (Huang and Hsu, 2002; Tang et al., 2002).
Most of the previous studies adopt an Apriori-like approach, whose essential idea is to iteratively generate the set of candidate patterns of length ( + 1) from the set of frequent patterns of length (for ≥ 1), and check their corresponding occurrence frequencies in the database. An important heuristic adopted in these methods, called Apriori heuristic (Agrawal, 1994; Klemettinen et al., 1994), which may greatly reduce the size of candidate pattern set, is the anti-monotonicity property of frequent sets (Agrawal, 1994; Klemettinen et al., 1994): if any length k pattern is not frequent in the database, its length ( + 1) super-pattern can never be frequent. The Apriori heuristic
fp
fp fp
achieves good performance gain by (possibly significantly) reducing the size of candidate sets. Recently another classification approach have been introduced called FP-tree (Han and Pei 2000; Xu et al., 2002). Efficiency of mining is achieved by three phases: 1) A large database is compressed into a highly condensed, much smaller data structure, which avoids costly, repeated database scans, 2) FP-tree-based mining adopts a pattern fragment growth method to avoid the costly generation of a large number of candidate sets, and 3) a partitioning-based divide-and-conquer method is used to dramatically reduce the search space.
Nevertheless, these proposed approaches (Agrawal, 1994; Klemettinen et al., 1994; Han and Pei, 2000; Xu et al., 2002) may still encounter some difficulties in different cases. First huge space is required to serve the mining. Second real databases contain all the cases. The only particular sets of cases cannot be selected, for example, telecommunication data analysis, market basket analysis, census data analysis, classification and predictive modeling, etc. It is hard to select an appropriate mining method on the fly if no algorithm fits all. Third, large applications need more scalability.
Some researchers investigate that classification is a useful data mining technique for stock market prediction (Mark et al., 2000). In recent years, there have been a growing number of studies looking at the direction or trend of movements of various kinds of financial instruments (such as Maberly, 1986; Wu and Zhang, 1997; O’Connor
et al., 1997). However, none of these studies provide a comparative evaluation of
different classification techniques regarding their ability to predict the sign of the index return. Given this notion, Mark et al. (2000) examine various financial forecasting models based on multivariate classification techniques and compare them with a number of parametric and nonparametric models that forecast the level of the return.