Transactions of the 17th International Conference on
Structural Mechanics in Reactor Technology (SMiRT 17) Prague, Czech Republic, August 17 –22, 2003
2
data is urgent to accurately evaluate the integrity of the structures. Taking the needs into consideration, this study focused on the development of the comprehensive D/B system that covers exhaustively from design and construction to maintenance. The D/B is expected to play a pivotal role in evaluating the integrity of containment buildings.
SYSTEM OVERVIEW
D/B System
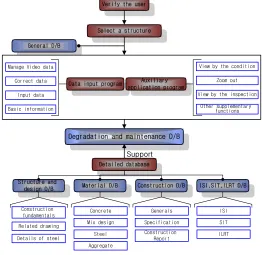
In this D/B system, when various data pertinent to design, construction and maintenance of containment buildings is input in a certain format on the window, they are organized and stored in a systematic manner on the computer. The data can be inquired or displayed on a terminal, a printer, etc in various ways at the user's request. Application programs are configured with 6 D/Bs - general D/B, structure and design D/B,
material D/B, construction D/B, degradation and maintenance D/B, and ISI SIT ILRT D/B. By interworking
with these DBs, the system enables a wide range of search and applications. Fig. 1 below illustrates the flowchart of this program.
General D/B
Verify the user
Select a structure
Detailed database
Structure and
design D/B Material D/B Construction D/B Data input program
Manage Video data
Auxiliary application program
ISI,SIT,ILRT D/B Degradation and maintenance D/B
Support
Basic information Correct data
Input data
View by the condition
Other supplementary functions
Zoom out
View by the inspection
Construction fundamentals
Related drawing
Details of steel
Concrete Aggregate Steel Mix design Generals Construction Report Specification ISI ILRT SIT
Fig. 1 System Flowchart
Window Configuration Programming
For efficient data input and output, the system window configuration programs should be installed by GUI (Graphic User Interface) method in the window environment. This system is built upon user-friendly policies. First, during window configuration programming, keys that are used to operate the system are simplified and second, most of the functions are designed to operate by clicking on the mouse. Fig. 2 shows the initial system window.
Data Management Window Coordinates
of dome, the center and the right horizon are considered 'the reference line'.
The user can figure out the length of degradation, its directionality and location just by clicking on the mouse since each piece of degradation information is accurately accumulated and displayed on the window in coordinates.
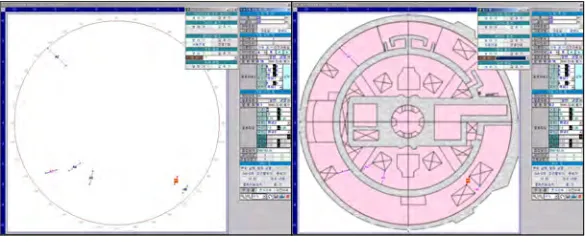
Data Management Window in Layer Structure
Since Layer can have drawing elements in connection to specific parts of the drawing, it, in general, can adjust the visibility of all the drawing elements. That is, it can selectively display the desired information on the window. Based on this function, this program adopted the following layers as control options: (1) a structure layer that displays types of structures on the basic background window and (2) a degradation layer that displays degradation and maintenance state. Fig. 3 shows these layers. (The left shows only the degradation layer, and the right shows both degradation and structure layers).
Fig. 2 System Initial Window Fig. 3 Slab Degradation Management Window (Left: Degradation
Layer, Right: Degradation Layer + Structure Layer)
Division of Management Area
This program divides the target structure into several areas based on structural roles that each member group plays. This process is necessary to efficiently manage degradation and maintenance data. The containment building is subdivided into a dome, an outer wall, a buttress, an internal structure, and a tendon gallery. The outer wall is subdivided into Side A, B and C and so is the buttress - Buttress A, B, and C. The slab also goes through the division process such as 100ft, 125ft. etc. Once this division process is completed, the management number, which is a combination of English and numbers (ex. A1, A2, A14, etc) is assigned to the input data. That is, one degradation phenomenon has a unique management number such as “"Yonggwang #1-Containment Building-outer wall-Side A-A2"” or “Yonggwang #1-Containment Building
-Internal Wall-100ft-No. Member-A1 [2].
D/B SYSTEM
4 that support the degradation and maintenance D/B.
When the program is started, the system enters into degradation and maintenance D/B management system state and at the user's request, it accesses other Sub D/Bs. The following provide the detailed information on each D/B.
General D/B
The general D/B is used to input and manage the general information (including specifications and the structure) on the corresponding NPP with containment building. This D/B is composed of 4 items - the current situation, specifications, the structure and the post-tensioning system - and the data are input by the item.
Degradation and Maintenance D/B
The degradation and maintenance D/B is composed of data obtained through close inspections on degradation in the structure or examinations through the naked eye. The target structures are a dome, an outer wall, a slab, an inner wall, and a tendon gallery. This D/B is designed to manage both concrete and steel members at the same time and is supported by various application programs (i.e., data search program). In addition, as the data are accumulated with the passage of time, they can be used to evaluate and further elongate the life span of structures in the future.
In case of a in-situ inspection, degradation data are collected pursuant to“[3] and the data are classified into items (i.e., cracks, net-shaped cracks, Honey combs, mortar repair, efflorescence, steel exposure, scaling, and others) and then input accordingly. Furthermore, when the degradation in the structure is repaired, the system manages details separate from the general maintenance data. The system distinguishes basic items of the general maintenance from details to maximize the efficiency. The basic items of the general maintenance
(i.e., names of construction companies, construction methods, maintenance materials, maintenance date,
conditions prior to maintenance, etc) must be input. However, in case of details, only details of maintenance materials, such as general features, physical and chemical features and durability features, are input.
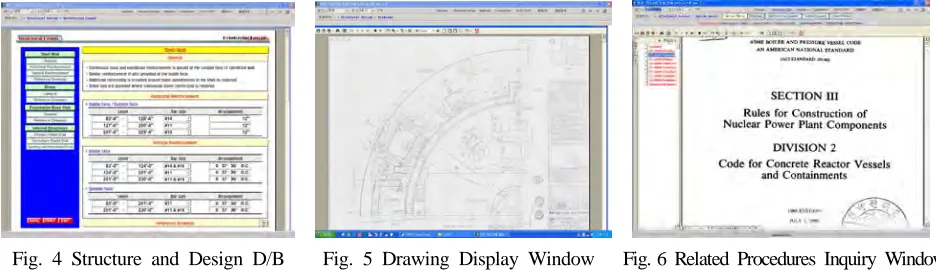
Fig. 4 Structure and Design D/B Fig. 5 Drawing Display Window Fig. 6 Related Procedures Inquiry Window
Structure and Design D/B
6
the difference is that it inputs the start point(X, Y) and the end point(X, Y) and then inputs width of degradation in the degradation input field.
(0, 0) Crack X₁ Y₁ X₂ Y₂ Degradation width End Point In-put X Y mm Start point (X, 0) (0, Y) ,Y₁ (X₁ ) ,Y₂ (X₂ ) Start point
End point
Coordinates (0, 0) Net-shaped crack Degradation width ,Y₂ (X₂ ) ,Y₁ (X₁ ) mm (X, 0) (0, Y)
Start point End point
Degradation width X₁ Y₁ X₂ Y₂ End Point In-put X Y Start point Coordinates Dome 45˚ 5m 36˚ 10m
Start point
In-put Angle Distance Degradation width mm Origin Start point End point 0˚ 180˚ 90˚ 270˚ End point
Fig. 7 Example of Linear Input Method Fig. 8 Example of Area Input Method Fig. 9 Example of Angle Input Method
Angle Input Method
The angle input method is used to input the degradation examined in spherical structures such as dome in this system. Unlike linear or area input methods, the distance reference in the degradation coordinates becomes the origin of the circle and for the reference of each angle, the right side of the window becomes 0°. That is, this method is strikingly similar to other methods in that the start and end points of the degradation needs to be input; however, the difference is that the input item of the start and end points are not (X, Y) coordinates, but (angle, distance) from the origin. For details, refer to Fig. 9.
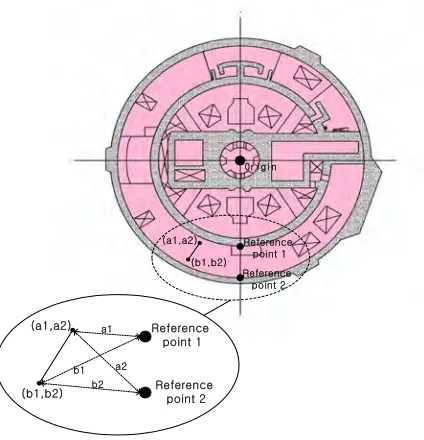
Relative Coordinates Input Method
When inspecting the degradation of members like a slab, it is difficult to determine the origin of the member. In this case, due to the nature of the slab, the center of the circle should be the origin, but it is impossible to measure the distance between the origin and the degradation. To solve this problem, the inspector can physically measure the distance from the degradation, not from the origin, by accessing the site or select 2 reference points to obtain the distance from the origin on the map and then calculate the correlation between (degradation-reference point) and (reference point-origin). Based on the information above, the inspector can obtain the coordinates between degradation and the origin.
33In inspecting relative coordinate degradation data, as shown in Fig. 10, the inspector should select the reference points A and B that can be checked on the drawing and measure the distance (a3,b3), (a4,b4) from the origin to the degradation. Next, he or she should obtain the coordinates of the origin and the reference points A and B on the drawing through office work and then input them. Once these steps are completed, the program automatically converts the coordinates of the origin and the degradation based on the data input and then stores the degradation data. When the data are input and stored correctly, the degradation drawing as in Fig. 10 will be shown on the window.
When the coordinates are input as shown in the figure right, the system obtains the actual coordinate values by the following formula (1), (2). The final
coordinates of (a3, b3), (a4, b4) are calculated as
follows:
Fig. 10 Example of relative coordinates input method for Slab