ABSTRACT
WEDDINGTON, MEGAN. Economic and cost analysis of the floriculture industry differentiated by market segment. (Under the direction of John M. Dole.)
Data were collected from bedding and potted plant growers serving the wholesale and retail markets to determine business characteristics, average annual gross sales, average fixed and variable costs, costs per square foot per week ($/ft2/wk) or costs per square foot per year ($/ft2/yr) and utilization of space. Business size, including
greenhouse area, outdoor pads, fields and supplemental buildings, ranged from 85,337 ft2 to 222,336 ft2. Greenhouses were the primary production area for bedding and potted plant growers, while cut flower growers primarily used field production. Bedding and potted plant growers averaged sales of $896,519 compared to sales of $45,423 for cut flower growers. Wholesale markets had higher sales than retail markets for bedding and potted plant businesses and cut flower businesses. Labor was the greatest expense for all market segments. Correlation analysis indicated a positive association between
advertising costs and sales in the wholesale markets. Positive associations in the retail markets were found between employee compensation and sales and conference/travel expense and sales.
and retail cut flower growers were used to determine space utilization and costs per square foot per year ($/ft2/yr). The wholesale cut flower businesses were determined to have a fixed cost of $1.220/ft2/yr, while the retail cut flower businesses yielded a cost of $0.787/ft2/yr for field production. Businesses can compare their own costs to these industry averages. Costs per square foot per week and costs per square foot per year are valuable tools for business management and efficiency analysis.
ECONOMIC AND COST ANALYSIS OF THE FLORICULTURE INDUSTRY DIFFERENTIATED BY MARKET SEGMENT
by
MEGAN WEDDINGTON
A thesis submitted to the Graduate Faculty of North Carolina State University
in partial fulfillment of the requirements for the Degree of
Master of Science
HORTICULTURAL SCIENCE
Raleigh 2003
APPROVED BY:
Charles D. Safley Brian E. Whipker John M. Dole
ii DEDICATION
I would like to dedicate this body of work to my parents and my fiancé.
Dad, you instilled in me a love of horticulture. You taught me to always pursue that which makes me happy and to be reflective in thought and decisive in action. Mom, you instilled in me a love of learning. You taught me to always try my best and make the best of every situation—even if it’s not what I expected. Together, you have
demonstrated the value of hard work and the importance of upholding my beliefs. I am most grateful for your endless support and encouragement throughout my academic journey, throughout my life.
Andy, you’ve been the source of my relief when the rigors of study seemed overwhelming. Your sense of humor, your reassurance, your concern and your devoted friendship reaches across the miles—129 miles, to be exact—to support me daily.
iii BIOGRAPHY
Megan Weddington was born on February 13, 1979 in Salisbury, NC. She received her elementary and secondary education in China Grove, NC and graduated from South Rowan High School in 1997.
She attended North Carolina State University where she participated in the Thomas Jefferson Scholars, a dual degree program. She received a Bachelor of Science degree in horticultural science and a Bachelor of Arts degree in multi-disciplinary studies with a concentration in science journalism. Megan was recognized as a Class of 2001 Valedictorian.
Megan is the daughter of John and Alice Weddington of China Grove, North Carolina.
iv ACKNOWLEDGEMENTS
I wish to express my deepest sincere thanks to John Dole, my teacher, my advisor and my friend. John has provided professional guidance and personal support throughout my degree program.
Thanks to Brian Whipker and Charles Safley, my committee members, who have offered time and guidance through the research process. Their commitment to the industry, as is evidenced by their own research efforts, gave me confidence to pursue this research of practical management tools.
Thanks also to Lane Greer, Diane Mays, Ingram McCall, Frankie Fanelli and the other floriculturists who have energized the learning and work environment. Their friendship has been invaluable over the past two years.
Kurt Weddington, my younger brother, thanks for always making sure I kept things in perspective, in my research and in life. I know I can always count on you for an honest opinion and practical advice.
Vanessa Corriher, Stephanie Sharples, Stephanie Avett, Cheri Borries and Amanda Guthrie—thank you for lots of laughter, encouragement and a constant interest in how school was going.
I am grateful to my fellow graduate students for their contagious enthusiasm to learn. Their dedication to their field is admirable and their desire to share their knowledge and love of horticulture has been an inspiration.
v TABLE OF CONTENTS
Page
LIST OF TABLES... vi
LIST OF FIGURES ... viii
INTRODUCTION ... 1
Literature Review ... 3
Literature Cited ... 5
ECONOMIC ANALYSIS OF THE FLORICULTURE INDUSTRY DIFFERENCIATED BY MARKET CHANNEL ... 7
Introduction ... 9
Materials and Methods ... 10
Results and Discussion ... 11
Wholesale bedding and potted plant growers selling primarily to garden centers and landscapers ... 13
Retail bedding and potted plant growers ... 16
Wholesale cut flower growers selling primarily to florists and specialty grocers ... 17
Retail cut flower growers ... 19
Summary ... 21
Literature Cited ... 23
COST ANALYSIS OF THE FLORICULTURE INDUSTRY DIFFERENCIATED BY MARKET CHANNEL ... 37
Introduction ... 39
Materials and Methods ... 41
Results and Discussion ... 43
Wholesale bedding and potted plant growers selling primarily to garden centers and landscapers ... 46
Retail bedding and potted plant growers ... 47
Wholesale cut flower growers selling primarily to florists and specialty grocers ... 50
Retail cut flower growers ... 50
Applications ... 51
Summary ... 54
Literature Cited ... 54
APPENDICES ... 66
Appendix A. Floriculture Cost Efficiency Analysis Survey ... 66
vi LIST OF TABLES
Page Chapter I.
1. Business parameters for wholesale bedding and potted plant
growers selling primarily to garden centers and landscapers ... 24
2. Revenue for wholesale bedding and potted plant growers selling primarily to garden centers and landscapers, retail bedding and potted plant growers, wholesale cut flower growers selling primarily to florists and specialty grocers, and retail cut flower growers ... 25
3. Expenses for wholesale bedding and potted plant growers selling primarily to garden centers and landscapers ... 26
4. Selected correlations for wholesale bedding and potted plant growers selling primarily to garden centers and landscapers ... 27
5. Business parameters for retail bedding and potted plant growers .... 28
6. Expenses for retail bedding and potted plant growers ... 29
7. Selected correlation for retail bedding and potted plant growers ... 30
8. Business parameters for wholesale cut flower growers selling primarily to florists and specialty grocers ... 31
9. Expenses for wholesale cut flower growers selling primarily to florists and specialty grocers ... 32
10. Selected correlations for wholesale cut flower growers selling primarily to florists and specialty grocers ... 33
11. Business parameters for retail cut flower growers ... 34
12. Expenses for retail cut flower growers ... 35
13. Selected correlations for retail cut flower growers ... 36
Chapter II. 1. Percent utilization of production areas for bedding and potted plant growers ... 56
vii 3. List of fixed costs ... 58
4. Overall mean fixed costs ($), distribution of expenses (%) and
distribution of space (ft2) for each market segment ... 59 5. Costs per square foot per week for bedding and potted plant
growers and costs per square foot per year for cut flower growers ... 60
Appendix B
1. Inputs used for the calculation of $/ft2/wk for wholesale bedding
and potted plant growers ... 76 2. Inputs used for the calculation of $/ft2/wk for retail bedding and
potted plant growers... 77 3. Inputs used for the calculation of $/ft2/yr for wholesale cut flower
growers ... 78 4. Inputs used for the calculation of $/ft2/yr for retail cut flower
viii LIST OF FIGURES
1. Utilization of production areas for wholesale bedding and potted plant growers ... 61 2. Utilization of production areas for retail bedding and potted plant
growers ... 62 3. Rate of cost increase over time comparing the results of this
1 Introduction
The floriculture industry has become a significant contributor to the total
agricultural economy. The 1997 United States Census of Agriculture reported floriculture
sales greater than $4.4 billion (United States Department of Agriculture, 2000). In North
Carolina, the 2000 estimate for total wholesale value of all floriculture crops was $160.8
million (North Carolina Department of Agriculture & Consumer Services, 2002). With
advanced breeding techniques, the diversity of plant material continues to grow in a
direction guided by consumer desires and production needs.
While the industry is strong and growing, several concerns exist. Many small
retailers find themselves competing with “big box” stores (mass marketers) whose large
budgets and diverse product lines allow them to sell a higher volume of product at a
lower profit margin. Some growers supplying mass marketers are faced with the task of
merchandising their products, increasing labor needs beyond traditional production inputs
and subsequently increasing labor costs. The cut flower industry faces increased
international competition as the quality of imported cut flowers has increased while the
prices have remained low. Also, the rising cost of fuel has forced many growers to alter
their production schedules or product selection. As plant suppliers invest in research to
develop superior plant material, i.e. well branched with plentiful flowers, disease
resistance or specific flower colors—they patent and license their product to recoup their
research and development costs through royalties paid by the grower. The increase in the
cost of plant material means growers must pass this cost onto the consumers. Reluctant
markets may require education and promotional activities to increase the consumers’
2 To overcome the challenges facing today’s grower, good management practices
are essential. Members of the floriculture industry are primarily plantsmen and the
management of the business is a secondary concern. As plantsmen, growers are
interested in producing a quality crop. However, to maintain a successful business, to
distribute that quality crop to the gardening public, growers must also consider costs of
production to ensure a return on their investments of time and money.
This research offers growers a management tool that can be used to identify areas
of inefficiency by comparing their firm’s costs with the average costs of other firms in
similar market channels. Most firms currently have little idea how their business
compares to others in the industry. Since cut flower growers and bedding and potted plant
growers have different significant costs, separate analyses were done for each of these
industry segments.
Production decisions are often based on intuition or previous experience with
little regard to economic impact. To maximize efficiency in an increasingly competitive
market, firms must determine the most cost effective production method. To compare
possible methods, growers can calculate the total cost of producing a crop using the cost
per square foot per week ($/ft2/wk) or cost per square foot per year ($/ft2/yr) method. This
figure is important because it incorporates crop timing with fixed and variable costs. For
best management, each greenhouse business should perform a yearly cost analysis to
account for production changes.
Cost accounting budgets can and should be used to establish a minimum selling
price based on accurate production costs. A final selling price should include a fair return
3 established businesses, rely solely on competitive pricing. This is poor financial
management since the competitor’s production costs are likely different (perhaps even
less), and their prices may not be based on their production costs. However, in the
market-driven economy, the producer must be sensitive to the consumer’s valuation. By
understanding the market value of a product, the producer can determine if he/she can
provide that product at a lower cost to ensure a profit. Another pricing “strategy” is to
increase all prices a given percentage periodically. This method is flawed since it fails to
reflect changes in production costs. Over time, cost changes will occur, but it is unlikely
that all crops will be affected in the same way. Cost analysis is the key to evaluating
business alternatives and developing an effective pricing strategy.
Literature Review
In 1980, Brumfield et al. (1982) analyzed fixed costs of greenhouse firms
differentiated by size of firm and market channel. Since then, however, little
comprehensive work has been done in the greenhouse industry that would yield a current
cost per square foot per week figure. Brumfield’s focus on fixed costs allowed managers
to evaluate the effects of changes in firm size, machine replacement or market channel.
Expenses are most commonly calculated on a square foot basis in the greenhouse
industry, which allows managers to compute expenses involved in production of various
sized merchandise units.
Cavins and Dole (2001) incorporated $/ft2/wk into experiments which evaluated
the affects of photoperiod, juvenility and light intensity on the production and economics
4 growers serving floral shops was used and adjusted using the consumer price index. A
current $/ft2/wk figure would yield a more accurate analysis of profitability and would
not rely on a non-industry measure for an updated figure.
Jenkins and Brumfield (1987) analyzed costs to determine whether plug or
seedling production is more cost effective. Their analysis also differentiated between size
of firm and the presence or absence of automation for plug production. Jenkins and
Brumfield analyzed per unit costs and found that most firms had lower costs using plug
production rather than seedling production. This type of analysis should be employed by
greenhouse business according to their production alternatives.
Brumfield and Sim (1987) took a closer look at automation by analyzing
technology use in Pennsylvania floriculture production. They determined that nine
statistical clusters, based on 32 technologies, described the state of automation in the
industry. Distinguishing factors included media preparation techniques, watering and
fertilizing systems, product transport systems, environmental control systems, and
management and marketing techniques.
Prince et al. (1987) surveyed growers throughout the United States to determine
how the industry is segmented by product mix, marketing season and channel of
distribution. They found that six segments exist, some specializing in specific pot sizes,
marketing seasons and channels of distribution, while other segments tend to diversify
their production and marketing behavior. This variability raises questions concerning
management strategies of production, marketing and finance of the firms. Greater
5 Economic analyses are also used to show the importance of the greenhouse
industry to a state’s economy. Uva (1991) and Uva and Richards (2003) analyzed the
economic dimensions of the greenhouse industry in New York by surveying businesses
and researching USDA census information. They determined the contribution of sales,
business size and employment to New York’s economy. Industry sales were found to
vary significantly depending on the business size and market outlets.
Individual commodity groups within the floriculture industry have offered
financial management advice as well. Gunter and Otte (1978) approximated foliage plant
costs using existing records. Additionally, they related the costs to market prices and
profits. The bedding plant growers have been given similar means to measure
profitability of their operations (Strain, 1981).
Literature Cited
Brumfield, R.G. and L.E. Sim. 1987. An analysis of Pennsylvania floricultural
production differential technology. Acta Hori. 203:139-146.
Brumfield, R.G., P.V. Nelson, A.J. Coutu, D.H. Willits, and R.S. Sowell. 1982. Fixed
cost and greenhouse firms differentiated by size of firm and market channel. N.C.
Agr. Res. Ser. Tech. Bul. No. 269.
Cavins T.J. and J.M. Dole. 2001. Photoperiod, juvenility, and high intensity lighting
affect flowering and cut stem quality of Campanula and Lupinus. HortScience
36:1192-1196.
Gunter, D.L. and J.A. Otte. 1978. A guide for estimating foliage plant costs. Fla.
6 Jenkins, C.R. and R.G. Brumfield. 1987. Economic analysis of the Pennsylvania
bedding plant industry. Acta Hort. 203:131-137.
North Carolina Department of Agriculture and Consumer Services. 2000. Agriculture
Statistics Division—Floriculture. [Internet] Available from:
<www.ncagr.com/stats/flor/flrallyr.htm> [Accessed February, 2002].
Prince, T.L., D.A. Schilling, W.T. Rhodus, S.L. Born, and J.G. Seeley. 1987. Segmenting
the flowering plant industry by product mix, marketing season, and channel of
distribution. Acta Hort. 203:205-212.
Strain, J.R. 1981. Analyzing financial statements: bedding plant operations.
Univ. of Fla. Staff Paper Series 177.
United States Department of Agriculture. 2000. 1997 Census of Agriculture, Census of
Horticultural Specialties (1998). Volume 3, Special Studies, Part 2. Wash., D.C.
Uva, W.L. 1991. An analysis of the economic dimensions of the New York state
greenhouse industry. Res. Bul. 99-08.
Uva, W.L., and S. Richards. 2003. New York greenhouse business summary and
7 Economic Analysis of the Floriculture Industry Differentiated by Market Segment
Megan Weddington and John M. Dole, Department of Horticultural Science, North
Carolina State University, Raleigh, NC 27695-7609
This research was supported by the North Carolina Commercial Flower Growers’
Association. Appreciation is expressed to Charles Safley and Brian Whipker for
assistance with this research project. Special thanks are extended to the greenhouse and
cut flower growers who participated in this study.
Additional index words. Cost accounting, wholesale, retail, greenhouse, cut flowers,
expenses, sales, business parameters.
Abstract. Data was collected from bedding and potted plant growers and cut
flower growers serving the wholesale and retail markets to determine business
characteristics and fixed and variable costs. Business size, including greenhouse area,
outdoor pads, fields and supplemental buildings, ranged from 10,400 ft2 to 463,400 ft2.
Greenhouses were the primary production area for bedding and potted plant growers,
while cut flower growers primarily used field production. Bedding and potted plant
growers averaged sales of $896,519 compared to average sales of $45,425 for cut flower
growers. Wholesale markets had higher sales than retail markets for bedding and potted
8 Correlation analysis indicated positive associations in the retail markets between
9 Introduction
Good management practices are essential to overcome the challenges facing
today’s grower. Members of the floriculture industry are often plantsmen first; while the
role of businessmen is usually secondary. As plantsmen, growers are interested in
producing a quality crop. However, to maintain a successful business, growers must also
consider costs of production to ensure a return on their investments of time and money.
Growers require management tools that can be used to identify areas of
inefficiency by comparing their firm’s costs with the average costs of other firms in
similar market channels. Most firms currently have little idea how their business
compares to others in the industry. The expenses of cut flower growers and bedding and
potted plant growers differ so separate tools are required for each of these industry
sectors.
Bedding and potted plant growers and cut flower growers produce their crops in
greenhouses, outdoors or both locations. Whether a business uses greenhouses, and to
what extent, affects its costs of production. Heat and utilities, typically required
greenhouse costs, are minimal in outdoor production. However, heating and cooling
allows crop seasons to be extended, earlier and later than natural occurrence, creating the
opportunity for multiple “turns”—producing more than one crop in the same space. If the
market is available, multiple turns may result in increased sales to counterbalance the
increased heating or cooling expense. In addition, the shorter the crop time, the more
turns possible in a space.
While some businesses have a diverse market, most are managed according to the
10 more likely to deliver its products to retail centers so its vehicle expenses might be
greater than a retail business’; however, a retail business typically requires more
employees than a wholesale business to meet customer service needs. In either market,
the costs of production should be the primary management concern. If an expense
category is significantly greater than the average, perhaps an alternative production
practice should be considered to lower costs and ultimately increase profits. To utilize
this information, individual firms must have accurate records.
The objective of this research was to compile a summary of fixed and variable
costs incurred by six sectors of the floriculture industry based on product type and market
channel.
Materials and Methods
Potential survey participants (160) were initially contacted to discuss the purpose
of the survey and secure their cooperation. A comprehensive survey (Appendix A) was
mailed or faxed to each willing participant (120). Floriculture firms were pre-selected
based on the market channels: 1) wholesale bedding and potted plant growers selling
primarily to mass marketers, 2) wholesale bedding and potted plant growers selling
primarily to garden centers and landscapers, 3) retail bedding and potted plant growers,
4) wholesale cut flower growers selling primarily to mass marketers, 5) wholesale cut
flower growers selling primarily to florists and specialty grocers, and 6) retail cut flower
growers. Twenty-nine surveys were returned with sufficient information provided for
analysis. The survey participants were primarily from North Carolina and the
11 The survey provided data in the following areas: distribution of sales by market,
business size, product itemization, distribution of sales by production area, distribution of
expenses by production area, revenue and overall expenses. The data was categorically
averaged for each of the defined market channels. Response means were determined
based on the number of responses for each category and overall means were determined
based on the number of surveys returned for each market segment. Data were analyzed
using means and correlations in SAS Version 8 (SAS Institute, Inc., Cary, N.C.).
Results and Discussion
Of the 120 surveys distributed, 41 responses were received (34.2%). Nine
participants did not have the time or resources to contribute to this research, resulting in
32 completed surveys (26.7%). This may seem low relative to the number of floriculture
operations in North Carolina; however, previous studies had a similar response when
attempting to collect financial data. Uva and Richards (2003) collected data from 45
greenhouse businesses, Brumfield (1980) surveyed 32 businesses, and 31 businesses
responded to a survey conducted by Brumfield and the Ohio Florists’ Association (1994).
Surveys focusing on non-financial business characteristics have yielded greater response
rates of 64 to 68% (Prince et al., 1987, Scoggins et al., 2003).
Despite repeated contacts to obtain sufficient survey data from each market
channel, there were insufficient responses in the categories of wholesale bedding and
potted plant growers selling primarily to mass marketers and wholesale cut flower
growers selling primarily to mass marketers; therefore, these market segments were
12 suppliers account for the greatest sales volume, they represent the smallest market
segment by number of businesses. Ten wholesale bedding and potted plant growers
selling primarily to garden centers and/or landscapers returned completed surveys, and
four retail bedding and potted plant growers participated. Seven surveys represented the
wholesale cut flower growers selling primarily to florists and specialty grocers, and eight
surveys were analyzed for the retail cut flower growers category. Twenty-one
respondents were from North Carolina, three from Virginia, two from Maryland and one
from South Carolina. In addition to these east coast firms, one survey response from
Oklahoma and Idaho were solicited and received.
Financial data collected from each firm was analyzed by market segment to
determine mean itemized costs. Using the data collected, two means were determined.
The response mean was calculated based on the number of responses for each category of
data. Since all participants did not respond to every category, the divisor may have been
less than the total number of surveys returned for the market segment. The response mean
is useful for evaluating the occurrence of an expense and comparing an expense of an
individual firm to the average of those incurring that expense. The overall mean was
determined by using the total number of surveys returned in a given market segment as
the divisor for each category. The overall mean creates a representative firm allowing for
categorical industry averages. Unless otherwise noted, all means reported in the text refer
13 Wholesale bedding and potted plant growers selling primarily to garden centers and
landscapers
Business parameters. These businesses, though selling primarily to garden centers
and landscapers, have a diverse market (Table 1). Thirty percent of the businesses
surveyed also sell to mass marketers and 30% service retail customers. Greenhouse
production space averaged 51,094 ft2 and outdoor production space (pads/benches)
averaged 30,700 ft2. Hanging baskets occupied an additional 7,708 ft2 of greenhouse
space. The total business size including non-production area and supplemental buildings
was 109,987 ft2.Brumfield et al. (1982) defined small, medium and large firms as 20,000
ft2, 100,000 ft2 and 400,000 ft2, respectively. More recently, an analysis of the Virginia
greenhouse industry categorized size based on heated space as small (<10,000 ft2),
medium (10,000 ft2 to 29,999 ft2) and large (>30,000 ft2) (Scoggins et al., 2003). Thus the
businesses in this study would be characterized as medium to large firms with greenhouse
space ranging from 21,000 ft2 to 135,000 ft2 and additional outdoor space of 10,000 ft2 to
107,000 ft2.
Though the area of greenhouse and outdoor production was similar, 86% of sales
and 92% of expenses were attributed to the greenhouse, compared to 14% of sales and
8% of expenses attributed to outdoor production. This discrepancy between size and
financial input and output may be attributed to the environmental control in the
greenhouse which allows for more turns throughout the year and to the additional
revenue of layered plant material, such as hanging baskets produced above or shade
plants grown underneath greenhouse benches. Of course, the greenhouse would be
14 potted plant segment of the industry, labor is more intensive in the greenhouse than for
outdoor crops grown on pads.
These businesses primarily sold wholesale finished plants. No plug or cutting
sales were reported and the amount of pre-finished plant material sold was insignificant.
Flowering potted plants yielded the highest average grossing product category
($394,635). Bedding plants, including hanging baskets for outdoor use, earned only
slightly less with a reported average value of $388,289. Both were distantly followed by
potted foliage which averaged gross sales of $48,920.
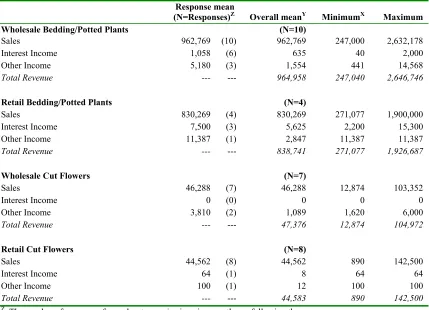
Revenue and expenses. The mean sales of wholesale bedding and potted plant
growers selling primarily to garden centers and landscapers was $962,769 (Table 2). The
minimum response was $247,000 and the maximum sales reported was $2,632,178.
The detailed expense data revealed that labor was the greatest cost (Table 3).
Labor, including owner and employee compensation, totaled an average of $309,168, or
33.4% of the expenses. While many small business owners consider the net income their
compensation, all business owners in this market segment reported a salary, averaging
$83,436. Employee compensation, consisting of a base wage or salary, required payroll
expenses and fringe benefits, averaged $225,732. The businesses in this market segment
averaged seven full-time employees and five part-time or seasonal employees (Table 1).
The minimum number of employees was one full-time and two part-time workers in
addition to the owner.
Plants and seeds ($283,319) and materials and supplies ($123,194) were the next
highest expense categories. Patented, royalty-bearing plant material and premium pots
15 these cost categories have potential to increase in the next few years. While facilities rent
($46,284) was the next greatest expenses, this cost was only incurred by 60% of the
businesses. Heating fuel and utilities, expenses incurred by all greenhouse businesses,
averaged $49,592, accounting for 5.4% of total expenses. The top five expenses account
for 87.6% of the mean total costs, $926,712.
The average net income for wholesale bedding and potted plant growers selling
primarily to garden centers and landscapers was $38,246. Since the owners’ salaries have
already been allocated as an expense, this represents income that can be reinvested in the
business or awarded as bonus compensation.
Costs correlations. Correlational analysis indicated several strong associations
between data categories (Table 4). Though correlation does not indicate causation, these
associations may indicate cost relationships not previously considered. Total employee
compensation, and more specifically, employee benefits were strongly associated with
sales. Since this is a wholesale market, employees do not directly affect sales volume
through customer service, as would be the case in the retail market. Benefits are usually
reserved for returning seasonal and full-time employees. These individuals are more
likely to be committed to task efficiency and producing a quality product.
Not surprising, total expenses were strongly associated with sales. Though owner
compensation was associated with sales, net income was not. This may indicate that as
the business grows financially, the owner compensation is increased rather than the net
income. Also, advertising and conference and travel expenses were strongly associated
with sales for this market segment. The question remains whether businesses that
16 same question can be asked about the relationship between sales and the knowledge
gained by attending conferences.
Retail bedding and potted plant growers
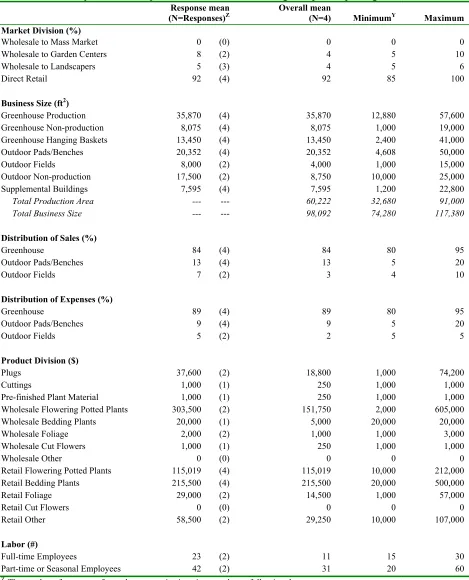
Business parameters. Retail bedding and potted plant growers sold only eight
percent of their product to wholesale outlets with the remainder sold to consumers in the
direct retail market (Table 5). The average business size was 98,092 ft2 with 60,222 ft2
devoted to production. Greenhouse production area was 35,870 ft2 and hanging baskets
utilized an additional 13,450 ft2 of greenhouse space. Outdoor pads and benches
contributed 20,352 ft2 to the production area.
The majority of sales (84%) and expenses (89%) were attributed to the
greenhouse. Only 16% of sales and 11% of expenses were reported from outdoor
production. Retail sales of bedding plants averaged $215,500, potted plants generated
$115,019 and foliage accounted for $29,250 in average gross sales.
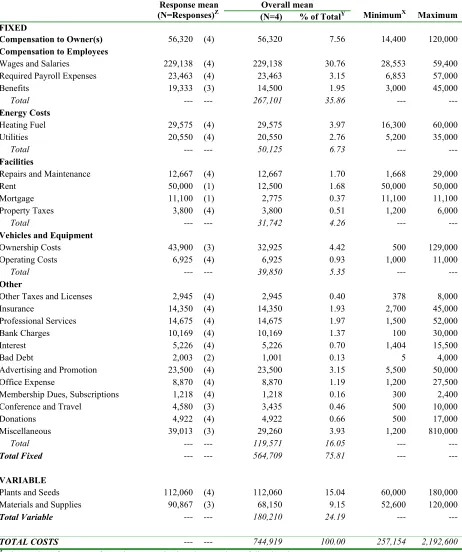
Revenue and expenses. Total sales for this market segment averaged $830,269
with a minimum of $271,077 and a maximum of $1,900,000 (Table 2). Labor was the
greatest expense with an average total employee compensation of $267,101 and owner
compensation of $56,320 (Table 6). All owners in this market segment earned an
expensed salary. Combined, labor costs accounted for 43.4% of the total expenses. The
next greatest expenses were plants and seeds ($112,060) and materials and supplies
($68,150). Other significant expenses reported by all survey respondents were heating
fuel ($29,575), utilities ($20,550) and advertising ($23,500). Total expenses for retail
17 Cost correlations. Employees play a major role in the retail market. This research
found that sales was strongly associated with employee compensation (Table 7). A
further consideration might be determining if there is a relationship between employee
compensation and horticultural background (education or experience). Perhaps those
employees more highly compensated can provide hesitant customers with information
and reassurance to make purchases and thereby increase sales. The association between
sales and conference and travel expense may already support this theory. Certainly the
knowledge gained at conferences can be utilized in the retail setting and passed along to
consumers. Interestingly, advertising in the retail market was not associated with sales.
Not surprising, sales were positively associated with total expenses. Labor expenses—
owner and employee compensation—were negatively associated with net income.
Wholesale cut flower growers selling primarily to florists and specialty grocers
Business parameters. The wholesale cut flower growers tend to focus only on the
wholesale market. Only one out of seven growers sold wholesale to mass marketers or
sold direct retail (Table 8). While all used field beds as the primary production area, 57%
also used greenhouses for production. The average field space used in production was
56,792 ft2 (1.3 acres) and greenhouse space averaged 1,920 ft2.Seventy-one percent of
the growers reported supplemental buildings averaging 706 ft2. Many cut flower growers
have coolers to refrigerate and store their fresh-cut product, though supplemental
buildings may also include packing and equipment storage facilities. The total average
size of wholesale cut flower businesses selling primarily to florists and specialty grocers
18 Field grown cut flowers accounted for 89% ($41,196) of sales while 11%
($5,092) of sales were attributed to plants produced in greenhouses. Ninety-two percent
of the total expenses were related to field costs ($44,092). Greenhouse costs ($3,834)
were relatively low in comparison, though greenhouse area accounted for only 2.2% of
total business size. Most cut flower growers need only minimal heat in the winter and
some growers only use greenhouses to start field crop transplants, resulting in lower labor
input in the greenhouses.
Revenue and expenses. Total mean sales for wholesale cut flower growers selling
primarily to florists and specialty grocers was $46,288 with a minimum of $12,874 and a
maximum of $103,352 (Table 2). Labor was the greatest expense at $19,092 (Table 9).
This expense, including owner and employee compensation, accounts for 39.8% of the
total expenses ($47,926). Owner compensation was allocated in various ways in this
market segment. Some owners were paid a pre-determined salary and others considered
the year-end net income their compensation. By consolidating these methods, the average
owner compensation was determined to be $9,288, ranging from $0 to $32,895.
Employee compensation was the single greatest expense ($9,804), but interestingly, no
survey participant reported any fringe benefits for their employees. This may be due to
the predominately part-time status of the employees in this market segment. Fifty-seven
percent of surveyed firms reported employing two to nine part-time or seasonal
employees, with an average of six (Table 8). Only one out of seven had a full-time
employee in addition to the owner.
The next greatest expense reported by all firms was plants and seeds ($5,628),
19 firms averaged $3,220; however, no outstanding mortgages were reported. Heating fuel
and utilities costs, reported by those businesses with greenhouse structures, totaled
$2,921. These top five expenses account for 71.8 % of the total expenses ($47,926) for
this market segment.
The mean net income was determined to be -$549. The lack of net income may be
attributed to the method of owner compensation. If the owner receives the total net
income as compensation, the net income for the business will be $0. Conversely, if the
business does not yield a positive net income, the owner will not be compensated. He/she
may have to personally contribute financial assistance to the business to pay outstanding
debt. Net income-as-owner compensation was the predominant method used by these
businesses, explaining the reported net income of less than $0.
Cost correlations. Business size and total expenses were strongly associated with
wholesale cut flower sales (Table 10). These businesses appear to be utilizing their area
and resources efficiently. Not surprisingly, total size was also strongly associated with
total expenses suggesting the larger a business, the more costly it is to operate.
Retail cut flower growers
Business parameters. Half of the cut flower businesses that primarily sell directly
to retail customers also sell wholesale to other retail establishments (Table 11).
Twenty-five percent of these businesses had greenhouse production space. All used field beds as
their primary production area with a minimum of 10,000 ft2 and an average of 102,158 ft2
20 Field crops yielded 97% of sales ($43,226) while the remaining 3% came from
greenhouse-produced crops. The majority of the expenses ($43,638, 98%) were also
attributed to field production.
Revenue and expenses. Total sales for retail cut flower growers was $44,562
(Table 2). Labor was the greatest expense accounting for 47.8% of the total expenses
(Table 12). Labor costs included owner and employee compensation. Unlike the other
market segments, retail cut flower growers have greater owner compensation ($14,001)
than employee compensation ($7,262). This is likely due to the fact that only part-time
or seasonal employees supplement the owner’s labor (Table 11). Sixty-three percent of
the businesses surveyed employed an average of six part-time or seasonal workers.
Plants and seeds and materials and supplies were the next greatest expenses with
averages of $3,130 and $3,254, respectively. Vehicle and equipment costs accounted for
13% of the total expenses with an average of $5,783. Professional services were not
utilized by all businesses, but with an average of $1,852 account for 4.2% of the
expenses. These top five costs account for 79.2% of total expenses ($44,529).
The average net income was determined to be $54 with a minimum of -$191 and
a maximum of $561 reported. As with wholesale cut flower businesses, many retail firms
do not allocate a salary for the owner. Net income is returned to the owner as his/her
compensation, leaving $0 for reinvestment in the business.
Cost correlations. Sales was strongly associated with total expense (Table 13).
Interestingly though, while employee compensation was also strongly associated with
total expense and sales, owner compensation was not associated with either. In this
21 travel expenses were. While more advertising dollars are spent in the retail market to
attract customers, the correlations suggest that customer service provided by employees
has a stronger relationship to sales.
Summary
Several overarching conclusions can be made from the economic analysis of these
four market segments. First, labor remains the greatest expense in every market segment.
Goodrich (1968), surveying New York floriculture firms, and Brumfield (1982),
surveying North Carolina firms, both found labor to be the greatest expense. This survey
did not consider the contribution of unpaid family labor—a common occurrence in small
and newly established businesses. Despite the availability of “labor-saving” technologies,
the businesses surveyed either are not investing in these technologies or have
implemented these technologies, only to increase labor demand for other tasks. Most
agricultural enterprises, floriculture included, are subject to seasonal peaks in product
demand. The labor input required to meet that demand is also seasonal resulting in few
full-time employees. While part-time and seasonal employees may be financially
appealing (wage-based compensation and limited benefits), the number of returning
employees may vary and the time and effort required to train new employees drastically
affects efficiency at a time when task management must be optimized to meet production
demands.
The methods of owner compensation had a major impact on net income,
particularly for the cut flower markets. Sales by wholesale and retail cut flower
22 business seemed to be less of a determining factor of owner compensation than sales. The
field cut flower business requires less initial financial input—no requirement for
greenhouses or the energy costs associated with greenhouses—allowing gardeners and
hobbyist to slowly grow a business enterprise. The entrepreneur usually starts selling
flowers as supplemental income, considering their labor “free,” but pocketing any profits.
Transitioning this hobby approach to a business mindset takes confidence that an
enjoyable hobby can produce a sustainable income. Until these businesses are confident
their sales can consistently exceed other expenses, the owner will consider any profit
sufficient payment for the opportunity to garden full-time. However, if the owner is
dependent on income from the cut flower business, a salary-type compensation may be
determined sooner. Goodrich (1968) also observed that owners/growers at larger
operations drew a higher salary compared to smaller growers who relied heavily on the
net income of the business.
Interestingly, advertising costs were associated with sales for the wholesale
operations, but no association was present for the retail operations. Retail businesses
spend more on advertising than wholesale operations, but perhaps wholesale
advertisements are more targeted to their audience, such as sending a direct mail flyer to
existing customers, resulting in a higher response rate. Retail operations often advertise to
a much wider audience through many media outlets such as the local newspaper or
on-site promotional signage. Noting that employee compensation was associated with sales
in the retail markets, these businesses should consider whether their dollars are best spent
on broadcast advertisements or employee training and education. Conference and travel
23 making an effort to inform their employees and/or themselves and that effort is literally
paying off.
Literature Cited
Brumfield, R.G. 1980. Fixed costs and costs of production of Easter lilies differentiated
by size of firm and market channel. MS Thesis, N.C. State Univ., Raleigh.
Brumfield, R.G. 1994. Cost accounting, pp323-336. In: J. Holcomb(ed). Bedding Plants
IV, Ball Publishing, Batavia, Ill.
Brumfield, R.G., P.V. Nelson, A.J. Coutu, D.H. Willits, and R.S. Sowell. 1982. Fixed
cost and greenhouse firms differentiated by size of firm and market channel. N.C.
Agr. Res. Ser. Tech. Bul. No. 269.
Goodrich, D.C. 1968. Selected costs and returns in flower production and marketing.
A.E. Res. 271
Prince, T.L., D.A Schilling, W.T. Rhodus, S.L. Born, and J.G. Seeley. 1987. Segmenting
the flowering plant industry by product mix, marketing season, and channel of
distribution. Acta Hort. 203:205-212.
Scoggins, H.L., J.G. Latimer, and V.T. Barden. 2003. Profile of the Virginia commercial
greenhouse industry. HortTechnology 13:526-531.
Uva, W.L. and S. Richards. 2003. New York greenhouse business summary and financial
24 Table 1. Summary of business parameters for wholesale bedding and potted plant
growers selling primarily to garden centers and landscapers.
Response mean
(N=Response)Z Overall mean (N=10) MinimumY Maximum
Market Division (%)
Wholesale to Mass Market 8 (3) 3 5 10
Wholesale to Garden Centers 86 (9) 77 45 100
Wholesale to Landscapers 35 (4) 14 5 70
Direct Retail 22 (3) 6 15 30
Business Size (ft2)
Greenhouse Production 51,094 (10) 51,094 18,240 110,000 Greenhouse Non-production 9,809 (10) 9,809 2,760 25,000
Greenhouse Hanging Baskets 8,565 (9) 7,708 2,360 18,000 Outdoor Pads/Benches 51,167 (6) 30,700 10,000 107,000
Outdoor Fields 0 (0) 0 0 0
Outdoor Non-production 11,055 (3) 3,317 3,000 25,000 Supplemental Buildings 7,360 (10) 7,360 1,200 20,000
Total Production Area --- --- 81,794 29,320 167,000
Total Business Size --- --- 109,987 47,592 204,400
Distribution of Sales (%)
Greenhouse 86 (10) 86 60 100
Outdoor Pads/Benches 24 (6) 14 5 40
Outdoor Fields 0 (0) 0 0 0
Distribution of Expenses (%)
Greenhouse 92 (10) 92 75 100
Outdoor Pads/Benches 13 (6) 8 5 25
Outdoor Fields 0 (0) 0 0 0
Product Division by Sales ($)
Plugs 0 (0) 0 0 0
Cuttings 0 (0) 0 0 0
Pre-finished Plant Material 20,000 (1) 2,000 20,000 20,000 Wholesale Flowering Potted 394,635 (10) 394,635 66,000 982,163 Wholesale Bedding Plants 485,361 (8) 388,289 62,000 1,100,000 Wholesale Foliage 97,839 (5) 48,920 51,693 200,000
Wholesale Cut Flowers 1,500 (1) 150 1,500 1,500 Wholesale Other 8,951 (1) 895 8,951 8,951
Retail Flowering Potted Plants 92,347 (3) 27,704 21,000 200,000 Retail Bedding Plants 165,380 (2) 33,076 130,760 200,000 Retail Foliage 75,000 (1) 7,500 75,000 75,000
Retail Cut Flowers 0 (0) 0 0 0
Retail Other 325,000 (1) 32,500 325,000 325,000 Labor (#)
Full-time Employees 7 (10) 7 1 22
Part-time or Seasonal Employees 5 (10) 5 2 9
Z The number of responses for each category is given in parentheses following the response mean.
YThe value listed is the minimum of those businesses reporting the respective category. Minimum for categories with
25 Table 2. Revenue ($) by market segment.
Response mean
(N=Responses)Z Overall meanY MinimumX Maximum
Wholesale Bedding/Potted Plants (N=10)
Sales 962,769 (10) 962,769 247,000 2,632,178
Interest Income 1,058 (6) 635 40 2,000
Other Income 5,180 (3) 1,554 441 14,568
Total Revenue --- --- 964,958 247,040 2,646,746
Retail Bedding/Potted Plants (N=4)
Sales 830,269 (4) 830,269 271,077 1,900,000
Interest Income 7,500 (3) 5,625 2,200 15,300
Other Income 11,387 (1) 2,847 11,387 11,387
Total Revenue --- --- 838,741 271,077 1,926,687
Wholesale Cut Flowers (N=7)
Sales 46,288 (7) 46,288 12,874 103,352
Interest Income 0 (0) 0 0 0
Other Income 3,810 (2) 1,089 1,620 6,000
Total Revenue --- --- 47,376 12,874 104,972
Retail Cut Flowers (N=8)
Sales 44,562 (8) 44,562 890 142,500
Interest Income 64 (1) 8 64 64
Other Income 100 (1) 12 100 100
Total Revenue --- --- 44,583 890 142,500
Z The number of responses for each category is given in parentheses following the response mean. Y Overall mean was determined using the number of responses in each market segment.
X The value listed is the minimum of those businesses reporting the respective revenue. Minimum for categories with
26 Table 3. Fixed and variable expenses ($) for wholesale bedding and potted plant growers selling primarily to garden centers and landscapers.
Overall mean Response mean
(N=Responses)Z
(N=10) % of TotalY MinimumX Maximum
FIXED
Compensation to Owner(s) 83,436 (10) 83,436 9.00 10,202 192,000 Compensation to Employees
Wages and Salaries 183,597 (10) 183,597 19.81 47,826 431,660 Required Payroll Expenses 23,519 (10) 23,519 2.54 17,244 52,712
Benefits 23,270 (8) 18,616 2.01 12,087 46,895
Total --- --- 225,732 24.36 --- ---
Energy Costs
Heating Fuel 36,232 (10) 36,262 3.91 4,325 75,375
Utilities 13,330 (10) 13,330 1.44 5,800 31,000
Total --- --- 49,592 5.35 --- ---
Facilities
Repairs and Maintenance 131,801 (10) 13,180 1.42 2,427 41,000
Rent 77,139 (6) 46,284 4.99 1,746 430,000
Mortgage 52,500 (2) 10,500 1.13 23,000 82,000
Property Taxes 2,550 (10) 2,550 0.28 664 5,812
Total --- --- 72,514 7.82 --- ---
Vehicles and Equipment
Ownership Costs 21,833 (8) 17,467 1.88 13,854 5,000 Operating Costs 15,767 (10) 15,767 1.70 10,488 5,250
Total --- --- 33,234 3.58 --- ---
Other
Other Taxes and Licenses 2,041 (7) 1,429 0.15 20 8,770
Insurance 12,049 (7) 8,434 0.91 482 21,180
Professional Services 2,682 (10) 2,682 0.29 245 5,361
Bank Charges 2,734 (8) 2,187 0.24 45 18,716
Interest 11,452 (8) 9,162 0.99 200 33,360
Bad Debt 1,402 (7) 981 0.11 49 4,512
Advertising and Promotion 10,226 (6) 6,136 0.66 500 40,428 Office Expense 5,812 (10) 5,812 0.63 322 25,516
Membership Dues, Subscriptions 721 (10) 721 0.08 70 2,379 Conference and Travel 2,711 (9) 2,440 0.26 87 9,355
Donations 1,413 (7) 989 0.11 200 3,800
Miscellaneous 29,440 (5) 14,720 1.59 580 88,827
Total --- --- 55,693 6.02 --- ---
Total Fixed --- --- 520,199 56.13 --- ---
VARIABLE
Plants and Seeds 283,319 (10) 283,319 30.57 20,954 650,028 Materials and Supplies 123,194 (10) 123,194 13.29 29,000 454,249
Total Variable --- --- 406,513 43.86 --- ---
TOTAL COSTS --- --- 926,712 99.99W 178,789 2,516,409
Z The number of responses for each category is given in parentheses following the response mean. Y % of total expenses based on mean (N=10).
XThe value listed is the minimum of those businesses reporting the respective expense. Minimum for categories with
fewer than 10 responses, as indicated under response mean, is understood to be 0.
27
Table 4. Selected correlations for wholesale bedding and potted plant growers who sell primarily to garden centers and landscapers based on overall mean.
Sales Compensation Owner Compensation Employee Employee Benefits Advertising Conference and Travel Expenses Total Net Income
Sales 1.000 (0.0147)0.7385YZ (0.0023) 0.8415 (0.0067) 0.7889 (0.0028) 0.8331 (0.0080) 0.7786 (<0.0001) 0.9963 NS
Owner
Compensation (0.0147) 0.7385 1.000 NS NS NS NS (0.0126) 0.7495 NS Employee
Compensation (0.0023) 0.8415 NS 1.000 (0.0242) 0.7001 (0.0016) 0.8550 (0.0039) 0.8172 (0.0010) 0.8726 NS Employee
Benefits
0.7889
(0.0067) NS
0.7001
(0.0242) 1.000 NS NS
0.7799
(0.0078) NS
Advertising (0.0028) 0.8331 NS (0.0016) 0.8550 NS 1.000 (0.0055) 0.8000 (0.0024) 0.8399 NS
Conference
and Travel (0.0080) 0.7786 NS (0.0039) 0.8172 NS (0.0055) 0.8000 1.000 (0.0077) 0.7805 NS
Total Expenses (<0.0001) 0.9963 (0.0126) 0.7495 (0.0010) 0.8726 (0.0078) 0.7799 (0.0024) 0.8399 (0.0077) 0.7805 1.000 NS
Net Income NS NS NS NS NS NS NS NS
ZR2
YP ≤ indicated value.
28 Table 5. Summary of business parameters for retail bedding and potted plant growers.
Response mean
(N=Responses)Z Overall mean (N=4) MinimumY Maximum
Market Division (%)
Wholesale to Mass Market 0 (0) 0 0 0
Wholesale to Garden Centers 8 (2) 4 5 10
Wholesale to Landscapers 5 (3) 4 5 6
Direct Retail 92 (4) 92 85 100
Business Size (ft2)
Greenhouse Production 35,870 (4) 35,870 12,880 57,600 Greenhouse Non-production 8,075 (4) 8,075 1,000 19,000
Greenhouse Hanging Baskets 13,450 (4) 13,450 2,400 41,000 Outdoor Pads/Benches 20,352 (4) 20,352 4,608 50,000
Outdoor Fields 8,000 (2) 4,000 1,000 15,000
Outdoor Non-production 17,500 (2) 8,750 10,000 25,000 Supplemental Buildings 7,595 (4) 7,595 1,200 22,800
Total Production Area --- --- 60,222 32,680 91,000
Total Business Size --- --- 98,092 74,280 117,380
Distribution of Sales (%)
Greenhouse 84 (4) 84 80 95
Outdoor Pads/Benches 13 (4) 13 5 20
Outdoor Fields 7 (2) 3 4 10
Distribution of Expenses (%)
Greenhouse 89 (4) 89 80 95
Outdoor Pads/Benches 9 (4) 9 5 20
Outdoor Fields 5 (2) 2 5 5
Product Division ($)
Plugs 37,600 (2) 18,800 1,000 74,200
Cuttings 1,000 (1) 250 1,000 1,000
Pre-finished Plant Material 1,000 (1) 250 1,000 1,000
Wholesale Flowering Potted Plants 303,500 (2) 151,750 2,000 605,000 Wholesale Bedding Plants 20,000 (1) 5,000 20,000 20,000
Wholesale Foliage 2,000 (2) 1,000 1,000 3,000
Wholesale Cut Flowers 1,000 (1) 250 1,000 1,000
Wholesale Other 0 (0) 0 0 0
Retail Flowering Potted Plants 115,019 (4) 115,019 10,000 212,000
Retail Bedding Plants 215,500 (4) 215,500 20,000 500,000
Retail Foliage 29,000 (2) 14,500 1,000 57,000
Retail Cut Flowers 0 (0) 0 0 0
Retail Other 58,500 (2) 29,250 10,000 107,000
Labor (#)
Full-time Employees 23 (2) 11 15 30
Part-time or Seasonal Employees 42 (2) 31 20 60
Z The number of responses for each category is given in parentheses following the response mean.
YThe value listed is the minimum of those businesses reporting the respective category. Minimum for categories with
29 Table 6. Fixed and variable expenses ($) for retail bedding and potted plant growers.
Overall mean Response mean
(N=Responses)Z
(N=4) % of TotalY MinimumX Maximum
FIXED
Compensation to Owner(s) 56,320 (4) 56,320 7.56 14,400 120,000 Compensation to Employees
Wages and Salaries 229,138 (4) 229,138 30.76 28,553 59,400 Required Payroll Expenses 23,463 (4) 23,463 3.15 6,853 57,000
Benefits 19,333 (3) 14,500 1.95 3,000 45,000
Total --- --- 267,101 35.86 --- ---
Energy Costs
Heating Fuel 29,575 (4) 29,575 3.97 16,300 60,000
Utilities 20,550 (4) 20,550 2.76 5,200 35,000
Total --- --- 50,125 6.73 --- ---
Facilities
Repairs and Maintenance 12,667 (4) 12,667 1.70 1,668 29,000
Rent 50,000 (1) 12,500 1.68 50,000 50,000
Mortgage 11,100 (1) 2,775 0.37 11,100 11,100
Property Taxes 3,800 (4) 3,800 0.51 1,200 6,000
Total --- --- 31,742 4.26 --- ---
Vehicles and Equipment
Ownership Costs 43,900 (3) 32,925 4.42 500 129,000 Operating Costs 6,925 (4) 6,925 0.93 1,000 11,000
Total --- --- 39,850 5.35 --- ---
Other
Other Taxes and Licenses 2,945 (4) 2,945 0.40 378 8,000
Insurance 14,350 (4) 14,350 1.93 2,700 45,000
Professional Services 14,675 (4) 14,675 1.97 1,500 52,000 Bank Charges 10,169 (4) 10,169 1.37 100 30,000
Interest 5,226 (4) 5,226 0.70 1,404 15,500
Bad Debt 2,003 (2) 1,001 0.13 5 4,000
Advertising and Promotion 23,500 (4) 23,500 3.15 5,500 50,000 Office Expense 8,870 (4) 8,870 1.19 1,200 27,500 Membership Dues, Subscriptions 1,218 (4) 1,218 0.16 300 2,400 Conference and Travel 4,580 (3) 3,435 0.46 500 10,000
Donations 4,922 (4) 4,922 0.66 500 17,000
Miscellaneous 39,013 (3) 29,260 3.93 1,200 810,000
Total --- --- 119,571 16.05 --- ---
Total Fixed --- --- 564,709 75.81 --- ---
VARIABLE
Plants and Seeds 112,060 (4) 112,060 15.04 60,000 180,000 Materials and Supplies 90,867 (3) 68,150 9.15 52,600 120,000
Total Variable --- --- 180,210 24.19 --- ---
TOTAL COSTS --- --- 744,919 100.00 257,154 2,192,600
Z The number of responses for each category is given in parentheses following the response mean. Y % of total expenses based on mean (N=4).
XThe value listed is the minimum of those businesses reporting the respective expense. Minimum for categories with
30
Table 7. Selected correlations for retail bedding and potted plant growers based on overall mean.
Sales Compensation Owner Compensation Employee Advertising Conference and Travel Expenses Total Income Net
Sales 1.00 NS (0.0003)0.9997YZ NS (0.0244) 0.9756 (0.0010) 0.9990 (0.0426) -0.9574
Owner
Compensation NS 1.00 NS (0.0390) 0.9610 (0.0259) 0.9741 (0.0457) 0.9543 (0.0089) -0.9911
Employee Compensation
0.9997
(0.0003) NS 1.00 NS (0.0229) 0.9771 (0.0006) 0.9994 (0.0387) -0.9613
Advertising NS (0.0390) 0.9610 NS 1.00 (0.0113) 0.9887 NS (0.0120) -0.9880
Conference and Travel
0.9756 (0.0244)
0.9741 (0.0259)
0.99771 (0.0229)
0.9887
(0.0113) 1.00
0.9840 (0.0160)
-0.9942 (0.0058)
Total Expenses (0.0010) 0.9990 (0.0457) 0.9543 (0.0006) 0.9994 NS (0.0160) 0.9840 1.00 (0.0306) -0.9694
Net Income (0.0426) -0.9574 (0.0089) -0.9911 (0.0387) -0.9613 (0.0120) -0.9880 (0.0058) -0.9942 (0.0306) 0.9694 1.00
ZR2
YP ≤ indicated value.
31 Table 8. Summary of business parameters for wholesale cut flower growers selling primarily to florists and specialty grocers.
Response mean
(N=Responses)Z Overall mean (N=7) MinimumY Maximum
Market Division (%)
Wholesale to Mass Market 13 (1) 2 13 13
Wholesale to Florists 97.9 (7) 98 87 100
Direct Retail 2 (1) 0 2 2
Business Size (ft2)
Greenhouse Production 3,360 (4) 1,920 1,120 5,796 Greenhouse Non-production 2,761 (4) 1,578 704 5,484
Greenhouse Hanging Baskets 0 (0) 0 0 0
Outdoor Pads/Benches 2,146 (2) 613 600 3,692
Outdoor Fields 56,792 (7) 56,792 6,900 130,680 Outdoor Non-production 44,345 (4) 25,340 3,200 130,680
Supplemental Buildings 988 (5) 706 80 2,400
Total Production Area --- --- 59,325 6,900 136,476
Total Business Size --- --- 86,948 10,400 275,040
Distribution of Sales (%)
Greenhouse 25 (3) 11 16 42
Outdoor Pads/Benches 0 (0) 0 0 0
Outdoor Fields 89.3 (7) 89 58 100
Distribution of Expenses (%)
Greenhouse 13.3 (4) 8 1 25
Outdoor Pads/Benches 1 (1) 0 1 1
Outdoor Fields 92.3 (7) 92 75 100
Product Division ($)
Plugs 0 (0) 0 0 0
Cuttings 0 (0) 0 0 0
Pre-finished Plant Material 0 (0) 0 0 0
Wholesale Flowering Potted Plants 2,095 (1) 299 2,095 2,095
Wholesale Bedding Plants 0 (0) 0 0 0
Wholesale Foliage 0 (0) 0 0 0
Wholesale Cut Flowers 45,463 (7) 45,463 12,874 105,000
Wholesale Other 0 (0) 0 0 0
Retail Flowering Potted Plants 0 (0) 0 0 0
Retail Bedding Plants 0 (0) 0 0 0
Retail Foliage 0 (0) 0 0 0
Retail Cut Flowers 275 (1) 39 275 275
Retail Other 50 (1) 7 50 50
Labor (#)
Full-time Employees 1 (1) 0 1 1
Part-time or Seasonal Employees 6 (4) 3 2 9
Z The number of responses for each category is given in parentheses following the response mean.
YThe value listed is the minimum of those businesses reporting the respective category. Minimum for categories with
32 Table 9. Fixed and variable expenses ($) for wholesale cut flower growers selling
primarily to florists and specialty grocers.
Overall mean Response mean
(N=Responses)Z
(N=7) % of TotalY MinimumX Maximum
FIXED
Compensation to Owner(s) 10,837 (6) 9,288 19.38 1,830 32,895 Compensation to Employees
Wages and Salaries 14,565 (4) 8,323 17.37 7,031 33,000 Required Payroll Expenses 3,455 (3) 1,481 3.09 1,565 7,000
Benefits 0 (0) 0 0 0 0
Total --- --- 9,804 20.46 --- ---
Energy Costs
Heating Fuel 3,254 (4) 1,859 3.88 318 6,960
Utilities 1,859 (4) 1,062 2.22 496 4,938
Total --- --- 2,921 6.10 --- ---
Facilities
Repairs and Maintenance 2,786 (5) 1,990 4.15 712 5,375
Rent 700 (2) 200 0.42 600 800
Mortgage 0 (0) 0 0 0 0
Property Taxes 957 (4) 547 1.14 184 2,000
Total --- --- 2,737 5.71 --- ---
Vehicles and Equipment
Ownership Costs 2,104 (5) 1,503 3.14 356 4,290 Operating Costs 2,528 (6) 2,167 4.52 610 8,250
Total --- --- 3,670 7.66 --- ---
Other
Other Taxes and Licenses 350 (6) 300 0.63 6 1,662
Insurance 1,322 (6) 1,133 2.36 192 3,119
Professional Services 1,478 (5) 1,056 2.20 50 4,030
Bank Charges 112 (3) 48 0.10 91 132
Interest 5,635 (4) 3,220 6.72 1,000 15,777
Bad Debt 500 (1) 71 0.15 500 500
Advertising and Promotion 162 (4) 92 0.19 60 333
Office Expense 622 (7) 622 1.30 46 1,500
Membership Dues, Subscriptions 450 (7) 450 0.94 125 1,347 Conference and Travel 501 (7) 501 1.05 98 1,034
Donations 750 (3) 321 0.67 400 1,350
Miscellaneous 4,447 (4) 2,540 5.30 131 13,572
Total --- --- 10,354 21.61 --- ---
Total Fixed --- --- 38,774 80.92 --- ---
VARIABLE
Plants and Seeds 5,628 (7) 5,628 11.74 693 15,142 Materials and Supplies 3,522 (7) 3,522 7.35 2,000 9,333
Total Variable --- --- 9,150 19.09 --- ---
TOTAL COSTS --- --- 47,926 100.01W
Z The number of responses for each category is given in parentheses following the response mean. Y % of total expenses based on mean (N=7).
XThe value listed is the minimum of those businesses reporting the respective expense. Minimum for categories with
fewer than 7 responses, as indicated under response mean, is understood to be 0.
33
Table 10. Selected correlations for wholesale cut flower growers selling primarily to florists and specialty grocers based on overall mean.
Sales Business Size Compensation Employee Heating Fuel Advertising Expenses Total
Sales 1.00 (0.0239)0.8200YZ (0.0270) 0.8107
0.9140
(0.0040) NS (<0.0001) 0.9982
Business Size (0.0239) 0.8200 1.00 (0.0016) 0.9399 (0.0272) 0.8100 NS (0.0251) 0.8163
Employee
Compensation (0.0270) 0.8107 (0.0016) 0.9399 1.00
0.8416
(0.0176) NS (0.0282) 0.8071
Heating Fuel (0.0040) 0.9140 (0.0272) 0.8100 (0.0176) 0.8416 1.00 NS 0.8953 0.0064
Advertising NS NS NS NS 1.00 NS
Total Expenses (<0.0001) 0.9982 (0.0251) 0.8163 NS 0.8953 0.0064 NS 1.00
ZR2
YP≤ indicated value.