ABSTRACT
Cesca, Lynsey Anne, Economic Competitiveness in the Global Textile Supply Chain: Examination of Logistics Cost Structures. (Under the direction of Dr. Nancy Cassill and Dr. Michelle Jones).
The purpose of this research was to examine the logistical cost structures along the global textile and apparel supply chain and their relationship to competitive advantage, strategy, performance and overall economic competitiveness. The topics were developed in accordance with the model proposed in Logistics, Strategy and Structure: A Conceptual Framework written by Stock, Greis & Kasarda in 1999. The research focused on the supply chains within the US Bed-bath and Bottom weights markets with companies using purely domestic, global and mixed strategies. A sample group involving US retailers, US/US manufacturers, US/US-Offshore manufacturers and sourcing agents was chosen for each market. As part of a collaborative research study focusing on economic competitiveness, a questionnaire was developed and administered during information interviews to the selected sample. Section II of the survey posed questions directly dealing with logistics costs, competitive advantage, strategy and performance.
from the use of specific logistical chains and cost optimization plans with their relationship to economic competitiveness. The research was also used in order to determine whether there was a relationship between logistical cost structures and economic competitiveness in terms of strategy and performance.
ECONOMIC COMPETITIVENESS IN THE GLOBAL TEXTILE
SUPPLY CHAIN: EXAMINATION OF LOGISTICS COST
STRUCTURES
by
LYNSEY CESCA
A thesis submitted to the Graduate Faculty of North Carolina State University
in partial fulfillment of the requirements for the Degree of
Master of Science
TEXTILE MANAGEMENT AND TECHNOLOGY
Raleigh
2005
APPROVED BY:
________________________________ _________________________________ Dr. George Hodge Dr. Robert Barnhardt
________________________________
Dr. Nancy Cassill, Co-Chair of Advisory Committee
________________________________
BIOGRAPHY
The author, Lynsey A. Cesca, was born in Manchester, Connecticut on
October 29, 1978. She is the daughter of Ken and Susan Cesca. Lynsey grew up in
Cheshire, CT and attended Cheshire High School. After graduation in 1996, Lynsey
moved to Raleigh, NC in order to attend North Carolina State University. After many
years of hard work and dedication, she achieved a Bachelors of Science in Textile
and Apparel Management from the College of Textiles in 2002. Upon graduation,
Lynsey worked for Martin & Jones Law Offices in Raleigh, NC as an Office
Assistant. In the fall of 2003, Lynsey returned to North Carolina State University in
order to pursue a Masters of Science degree through a fellowship from the Institute
of Textile Technology. She is currently completing the requirements for her
graduate degree in Textile Management and Technology. Lynsey has accepted a
job offer with Abercrombie & Fitch in Columbus, OH where she will pursue a career
ACKNOWLEDGEMENTS
I would like to extend my gratitude to Dr. Nancy Cassill and Dr. Michelle
Jones for their continuing guidance and support throughout this research process. I
am truly grateful to have worked with such wonderful mentors on this project from
whom I have learned so much. Their guidance has helped me grow, not only as a
student, but as a person as well. I would like to thank the staff, especially Dr. Gilbert
O’Neal, Christopher Moses and Patrice Hill, as well as the membership and alumni
of the Institute of Textile Technology for the financial and emotional support they
have provided during this thesis project. I would also like to express my appreciation
to Dr. Robert Barnhardt and Dr. George Hodge for participating as committee
members. Dr. Barnhardt provided an industrial point of view in order to make this
research truly relevant to the textile and apparel industry. Dr. Hodge’s insight into
this research has enabled me to create a much stronger logistical study.
I would also like to thank Hope Nowell and Michael Jones, the additional two
researchers in this collaborative economic competitiveness study. Their support,
friendship and laughter have gotten me through many long days and nights. This
research project would not have been possible without their dedication and hard
work over the past two years. I will always hold them close to my heart and look
back upon this time with them with great fondness.
Finally, I would like to thank my parents, Ken and Susan Cesca, for their
unconditional love, honesty and support throughout my entire life. Without their
TABLE OF CONTENTS
LIST OF FIGURES VI
LIST OF TABLES VIII
CHAPTER I 1
INTRODUCTION 1
RESEARCH PROBLEM 1
PURPOSE OF RESEARCH 4
RESEARCH OBJECTIVES 5
SIGNIFICANCE OF RESEARCH 6
LIMITATIONS OF RESEARCH 7
CHAPTER II 9
REVIEWOFLITERATURE 9
CONCEPTUAL MODELS 9
LOGISTICS COSTS 16
ECONOMIC COMPETITIVENESS: STRATEGY,PERFORMANCE AND 20
COMPETITIVE ADVANTAGE 20
SUPPLY CHAIN 22
MARKET ANALYSIS:BED-BATH AND BOTTOM WEIGHTS 30
CHAPTER III 38
METHODOLOGY 38
PURPOSE OF RESEARCH 38
RESEARCH DESIGN 40
SAMPLE SELECTION 48
PROPOSED SAMPLE 54
SAMPLE VALIDATION 55
SAMPLE COMPLETION 55
SURVEY DEVELOPMENT &DATA COLLECTION 56
DATA ANALYSIS 58
OPERATIONAL DEFINITIONS 62
CHAPTER IV 66
RESULTS 66
SAMPLE 66
COMPARISON OF INTERVIEWEES INFORMATION FOR THE BED-BATH AND BOTTOM WEIGHTS
MARKETS REGARDING LOGISTICS 93
ADDITIONAL FINDINGS 137
PRELIMINARY BENCHMARKING SYSTEM 137
MODEL 138
CHAPTER V 140
CONCLUSION,IMPLICATIONS,ANDRECOMMENDATIONS 140
SUMMARY 140
SUMMARY OF RESULTS 141
CONCLUSIONS 153
IMPLICATIONS FOR THE USINDUSTRY 154
RECOMMENDATIONS 155
REFERENCES 158
APPENDICES A – F 163
APPENDIX A. BED-BATH RETAILER POPULATION 164
APPENDIX B. BOTTOM WEIGHTS RETAILER POPULATION 165
APPENDIX C. BED-BATH MANUFACTURERS POPULATION 166
APPENDIX D. BOTTOM WEIGHTS MANUFACTURERS POPULATION 167
APPENDIX E. INITIAL CONTACT LETTER 168
LIST OF FIGURES
Figure 1. Deloitte Benchmarking Report: Competitive Advantages ... 2
Figure 2. Visual Depiction of Research Problem and Investigation Areas ... 3
Figure 3. Logistics, Strategy and Structure: A Conceptual Framework ... 10
Figure 4. Porter’s Generic Strategies. ... 21
Figure 5. Textile and Apparel Supply Chain Model... 24
Figure 6. Components of the Textile and Apparel Supply Chain Model... 25
Figure 7. Buyer Driven Commodity Chain. ... 25
Figure 8. Global Supply Chain Model Incorporating a Sourcing Agent... 27
Figure 9. Supply Chain: Manufacturer of High Street Fashion... 28
Figure 10. Supply Chain: Fiber Producer... 28
Figure 11. Supply Chain: Sportswear Accessory Designer... 29
Figure 12. Supply Chain: Premium Brand Manufacturer/Retailer ... 30
Figure 13. US Bed-Bath Imports and Production... 33
Figure 14. US Bottom Weights Imports and Production. ... 33
Figure 15. US Imports of Home Textiles by Country ... 35
Figure 16. Top Countries Shipping Cotton Bottoms ... 36
Figure 17. Top Countries Shipping Man-Made Fiber Bottoms ... 36
Figure 18. Concurrent Triangulation Strategy... 42
Figure 19. Inductive Logic ... 43
Figure 20. Deductive Logic... 44
Figure 21. Research Questions Answered in Phase I by Deductive Logic ... 45
Figure 22. Research Questions Answered in Phase II by Deductive Logic ... 47
Figure 23. Company Selection Criteria for US Bed-Bath Retailers ... 50
Figure 24. Company Selection Criteria for US Bottom Weight Retailers... 51
Figure 25. Company Selection Criteria for US Bed-bath US Manufacturers... 52
Figure 26. Company Selection Criteria for US Bottom weights Manufacturers ... 54
Figure 27. Share of Total Non-Apparel Imports from US’ Top Ten Trading Partners ... 71
Figure 28. Change in Non-Apparel Imports by Country from December 2003 to December 2004 ... 71
Figure 29. Global Sourcing Trends since 1992 ... 72
Figure 30. Share of Total Apparel Imports From US’ Top Ten Trading Partners... 73
Figure 31. Change in Apparel Imports by Country from December 2003 to December 2004.... 74
Figure 32. US Apparel Production 1980-2002... 75
Figure 33. US Textile Production 1980-2002... 75
Figure 34. Previous US Textile and Apparel Supply Chain ... 76
Figure 35. Global-US Textile and Apparel Supply Chain... 77
Figure 36. US Bed-Bath Imports and Production... 80
Figure 37. US Production: Sheets, Pillowcases & Terry Towels ... 81
Figure 38. Amount of Home Textiles Imported by US Company... 82
Figure 39. US Imports of Home Textiles by Country ... 83
Figure 40. US Bottom Weights Imports and Production ... 85
Figure 41. Top Countries Shipping Cotton Bottoms ... 86
Figure 42. Top Countries Shipping Man-Made Fiber Bottoms ... 87
Figure 43. Logistics Chain 1... 94
Figure 44. Logistics Chain 2... 96
Figure 45. Logistics Chain 3... 97
Figure 46 Comparison of Logistics Costs by Chain Configuration ... 104
Figure 47. Cost Structure for Logistics Chain 1... 105
Figure 48. Cost Structure for Logistics Chain 2... 106
Figure 49. Cost Structure for Logistics Chain 3... 106
Figure 50. Logistics Chain of a Chinese Full Package Supplier... 122
Figure 53. Logistics Costs in Relation to Strategy: Bottom Weights Sample ... 129 Figure 54. Logistics Costs in Relation to Enhanced Performance: Bed-Bath Sample ... 133 Figure 55. Logistics Costs in Relation to Enhanced Performance: Bottom Weights Sample 134 Figure 56. Proposed Framework for Logistics with Strategy and Structure... 138 Figure 57. Adapted Model for Logistics Costs in Relation to Performance and Economic
LIST OF TABLES
Table 1. Logistics Costs: Categories, Causes, and Barriers ... 19
Table 2. Bed-Bath Market: SIC, NAICS & Product Codes... 31
Table 3. Bottom Weight Market: SIC, NAICS & Product Codes ... 32
Table 4. Decision Choices for Determining a Mixed Methods Strategy of Inquiry ... 41
Table 5. Phase I Instrument: Secondary Data Collection... 46
Table 6. Population Pools Used for Sample Selection ... 48
Table 7. Validators’ Credentials ... 55
Table 8. Description and Objectives of Survey Questions ... 57
Table 9. Tips on Coding ... 58
Table 10. Topics and Codes Used for Questions 1 – 4... 59
Table 11. Topics and Codes Specific to Question 4 ... 60
Table 12. Sample Description... 67
Table 13. Logistics Cost Categories Defined ... 69
Table 14. Top 10 Cotton Bed-bath Producing Countries by Square Meter Equivalent (SME)... 84
Table 15. Logistics Chain 1: Companies, Categories and Markets Involved ... 95
Table 16. Logistics Chain 2: Companies, Categories and Markets Involved ... 96
Table 17. Logistics Chain 3: Companies, Categories and Markets Involved ... 97
Table 18. Comparison of Both Markets Logistics Percentages ... 99
Table 19. Comparison of Logistics Costs Allocations Along the Supply Chain ... 100
Table 20. Comparison of Companies’ Inventory Holding Costs as a Percentage of the Total Logistics Cost ... 101
Table 21. Comparison Companies Transportation Costs as a Percentage of the Total Logistics Cost ... 102
Table 22. Comparison Each Logistics Cost, as a Percent of Total Logistics Costs, for Each Logistics Chain ... 104
Table 23. All US/US Manufacturers, US/US-Offshore Manufacturers & Retailers Response to Competitive Advantage Definition and Usage ... 108
Table 24. Most Common Competitive Advantages due to Logistics Operations and Costs... 109
Table 25. Comparison of the Bed-Bath Sample’s Competitive Advantages due to Logistics . 110 Table 26. Comparison of Bed-Bath US/US-Offshore Manufacturers’, Sourcing Agents’ and Retailers’ Competitive Advantages due to Logistics... 111
Table 27. Comparison of the Bottom Weights Sample’s Competitive Advantages due to Logistics ... 112
Table 28. Comparison of Bottom Weights US/US Manufacturers’, US/US-Offshore Manufacturers’, Sourcing Agents’ and Retailers’ Competitive Advantages due to Logistics ... 113
Table 29. Comparison of Competitive Advantages due to Logistics across the Bed-Bath & Bottom Weights Markets...115
Table 30. Comparison of Competitive Advantages Held by Different Logistics Chains... 116
Table 31. Comparison of Sourcing Regions Chosen in terms of Speed and Cost by Logistics Chain ... 120
Table 32. Comparison of First Cost vs. Total Cost Sourcing by Logistics Chain ... 124
Table 33. Relationship of Inventory Holding and Transportation Costs to Strategy and Company Category ... 130
Table 34. Relationship of Inventory Holding and Transportation Costs to Strategy and Logistics Chain ... 131
Table 35. Percent of Bed-Bath Companies that Relate Logistics to Enhanced Performance.. 132
Table 36. Percent of Bottom Weight Companies that Relate Logistics to Enhanced Performance ... 133
CHAPTER I
INTRODUCTION
Research Problem
“The textile supply chain is experiencing deflationary price trends making cost
reduction not just a fad but a key to survival” (Singhal, 2004, pg. 1). Arvind Singhal’s
paper, presented to the Annual Conference of the International Textiles
Manufacturers’ Federation, identified three distinct areas where cost reductions are
critical to the supply chain: manufacturing, business process costs and logistics
costs. Included in the body of the paper was a discussion of each cost and the
resulting benefits of their reduction. The textile value supply chain can optimize their
costs by concentrating on operational excellence, collaborating with partners and
innovation with a focus in the areas of logistics and sourcing (Singhal, 2004).
Prior research on cost reducing strategies failed to include the effect of
logistical costs with their analyses of traditional costs such as manufacturing and
business process costs. Therefore the focus needs to fall not only on minimizing
costs, but relying upon logistical costs specifically within the supply chain. This is an
area that has not received attention in past cost reduction analysis; therefore it has a
larger opportunity for optimization. Figure 1 shows the potential for supply chain
optimization and lowered logistics costs. However, the report reveals that using the
supply chain cost structure to gain competitive advantage is at the bottom of the list
for many companies (Deloitte, 2003). Logistics cost optimization, especially within
the textile and apparel supply chain, should be seen as valuable to both the
of finished goods. Therefore, when there is a logistics cost increase, the companies
involved in the supply chain begin to try to find ways to decrease their final cost by
optimizing manufacturing and business process costs. This ultimately results in
pressure put on each supplier within the supply chain to reduce their selling cost to
the next upstream company. Therefore when logistics costs are not optimized, it
results losses, not just for one supplier, but for the entire chain.
Figure 1. Deloitte Benchmarking Report: Competitive Advantages
Source: Deloitte Benchmarking Report. Global Manufacturing: Powering Profits and Growth through Value Chain Synchronization. 2003.
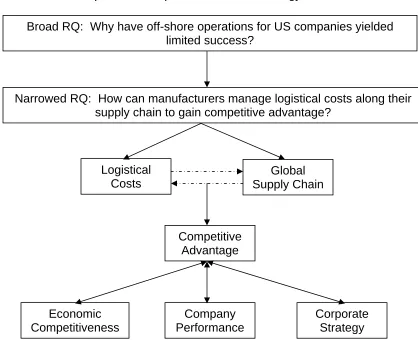
Figure 2 is a pictorial depiction of what this thesis study is investigating and
the relationships it evaluates. The main research question addresses why US
companies have had limited success in their foreign ventures. It can then be
narrowed to address one of the root causes of this partial success; cost issues.
Therefore the more narrow focus of this research becomes costs and the how
manufacturers control them. This relates to Singhal’s postion that there are three
competitive advantage. This study focuses one of the costs mentioned, logistics
costs, and how the relationship of those costs to the global supply chain can be
manipulated in order to produce a competitive advantage. The research assesses
those logistical and supply chain competitive advantages and their relationship to a
firm’s economic competitiveness, performance and strategy.
Figure 2. Visual Depiction of Research Problem and Investigation Areas
Source: Cesca, 2004.
The visual depiction explains that competitiveness, performance and strategy are
the most important factors in determining competitive advantage. This runs in
tandem to the model presented by Stock, Greis and Kasarda (1999) which looks at Broad RQ: Why have off-shore operations for US companies yielded
limited success?
Narrowed RQ: How can manufacturers manage logistical costs along their supply chain to gain competitive advantage?
Competitive Advantage Logistical
Costs
Company Performance
Corporate Strategy Economic
Competitiveness
Purpose of Research
The purpose of this research was to examine the logistical cost structures
along the global textile and apparel supply chain. The study then determined the
differences between the textile and apparel companies’ supply chains as they
pertained to the handling of their logistics. The research focused on the supply
chains within the US Bed-bath and Bottom weights markets with companies using
purely domestic, global and mixed strategies. It defined the associated cost
variables and structures within each chain. Once these cost structures were
understood, the research was used to determine possible competitive advantages
for each model through optimization of logistics costing. This research determined if
a link exists between logistics costs and corporate strategy and corporate
performance, and how these three factors resulted in increased economic
competitiveness within the textile and apparel arena for United States
manufacturers.
The research answered the following questions:
1. What are the logistics costs associated with the textile supply chain for the
Bed-bath and Bottom weights
2. How are these costs managed along the supply chain in order to create
specific structures for particular companies?
3. Are these cost structures different in different markets, such as:
a. Bed-bath Market
b. Bottom weights Market
a. What types of cost leadership can be gained?
b. How do costs fit together to create different types of value added?
5. How does a company use their cost structure to compete economically?
What competitive advantages are they looking for?
6. How does a company control their cost structure to fit their strategy? How
does a company use their strategy to determine their optimal logistical cost
structure? Or do they use their cost structure to formulate their strategy?
7. How does a company’s logistical cost structure relate to their performance?
a. What makes a company classify their performance as good or poor;
what is their definition of performance?
8. Is there a logistical contingency plan in place to account for problems along
the way?
9. Do companies use a quantitative model for investigation into their logistical
costing?
10. Is there a way for industry companies to benchmark, for logistical cost
structures, against their competition?
Research Objectives
The following are the main research objectives that will be used for this study:
RO1: To examine logistics costs in terms of:
RO1A. The percentage represented in the finished product cost. (RQ1)
RO1B. The global textile and apparel supply chains. (RQ1)
RO1C. Cost structure management. (RQ2 & RQ3)
RO2A. Provide and verify a definition. (RQ4)
RO2B. Determine the advantages of specific logistical chains and costs.
(RQ4 & RQ5)
RO2C. Determine the relationship to economic competitiveness. (RQ5)
RO3: To determine if there is a relationship between logistical cost structures and
economic competitiveness in terms of:
RO3A. Strategy (RQ6)
RO3B. Performance (RQ7)
Significance of Research
This study provided in-depth analyses of logistics costs along the global
textile and apparel supply chain. “Total logistics costs often represent a large
portion of total supply chain costs, especially when the supply chain is extended to
the global market” (Zeng, 2003, pg. 786). This is important because previous
studies have shown that logistics costs represent from “4-30% of sales” and
therefore as logistics costs surge, they may reduce profit margins (Zeng, 2003, pg.
786).
This research also provided industry with different ideas to use in order to
gain a competitive advantage. This is essential because the industry needs to
understand the range of competitive advantages available in order to determine
which one will fit best with their business plan. The research also provided a formal
definition of economic competitiveness, which is a vital concept to the industry. By
having a common definition, it established the standard by which companies can
The research found a relationship between logistical cost structures,
corporate strategy and performance. The finding was important because it
illustrates to the US textile and apparel manufacturers that optimized logistical cost
structures will result in improved strategic decisions therefore enhancing corporate
performance.
The study provided the industry with a preliminary means by which to
benchmark themselves against their global competitors, as well as competitors in
the US. It was important because companies will be able to identify where they
stand among industry leaders and then use that knowledge to move forward.
The research is beneficial because “the end of quota will lead to a shake-up
in sourcing bases of the retailers. Entry of more players in the global market will
mean further pressures on prices” (Singhal, 2003, pg. 2). Therefore, logistics cost
optimization is even more important now to textile and apparel manufacturers
because of consolidation of the manufacturing base. It is necessary to optimize
logistics costs in order to enhance speed and keep prices competitive.
Therefore in order to continue to stay competitive, United States
manufacturers must rethink their strategy pertaining to their supply chain and
logistical costs. The research provides vital information as it pertains to logistics
costing, competitive advantage, strategy and performance and the enhancement of
each.
Limitations of Research
There were three main limitations in this thesis study and they are the
Scope of Study
The study only focuses on the Bed-bath and the Bottom weights markets.
While these two product categories represent a significant portion of US companies’
products, results are not able to be generalized across to all other product
categories.
Sample Size
In order to more feasibly interview respondents from the two markets, a
sample selection was made. The narrowing of the sample resulted in the
researcher being unable to sample the entire population of both market segments.
Respondent Behavior
Some companies were unwilling or unable to share their financial data, in
terms of logistics costs and percent allocations, with the interviewee. They were
either unwilling to share corporate information in the form of financials or were bound
CHAPTER II
REVIEW OF LITERATURE
This review of literature showed the relationship of the selected conceptual
models to domestic and global supply chain management while focusing on the area
of logistical operations and cost structures. Methodologies for developing a survey
or questionnaire for this type of mixed methods research were also reviewed. It
evaluated existing literature focusing on economic competitiveness in terms of
logistics, strategy, performance and competitive advantage. Supply chain models
within the literature for the textile and apparel fields were analyzed. Within those
chains, logistical costs were identified. Finally, after a review of prior art, an
overview of the Bed-bath and Bottom weights markets is provided.
Conceptual Models
The main conceptual model provided a framework for reviewing the
relationship between supply chains, economic competitiveness, strategy and
performance. The other models offered a method for reviewing the relationship of
the cost variables to strategy, as well as providing a method for quantification.
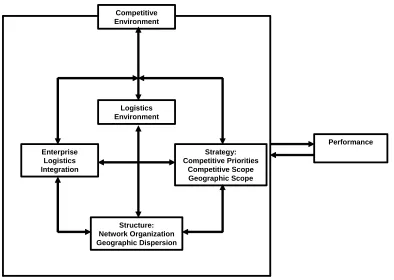
A framework was found in Logistics, Strategy and Structure: A Conceptual
Framework written by Stock, Greis and Kasarda in 1999. This model showed the
relationship of economic competitiveness to strategy and performance while using
logistics as a means of bringing these ideas together through a conceptual model
Figure 3. Logistics, Strategy and Structure: A Conceptual Framework
Source: Stock, Greis & Kasarda. Logistics, Strategy and Structure: A Conceptual Framework.
International Journal of Physical Distribution & Logistics. 1999, pg. 226.
The objective of the paper was to “develop a conceptual model of production
that explicitly recognizes the emerging role of logistics in bridging new manufacturing
strategies and organizational structures that have evolved in response to new
competitive pressures” (Stock, Greis, & Kasarda, 1999, pg. 224). The research was
conducted with [TC]2 in the areas of competitive environment, strategy and structure.
After careful scrutiny of all prior art, it was determined that a new conceptual
framework needed to be devised in order to take into consideration the importance
of the logistics environment. The authors claimed that “the logistics environment
may (then) be conceptualized as a set of choices available to firms within an industry
that relate to areas of logistics activities, such as transportation, warehousing,
purchasing, and management techniques. The advantage (that) a firm may have in
Competitive Environment
Logistics Environment
Enterprise Logistics Integration
Structure: Network Organization Geographic Dispersion
Performance Strategy:
logistics derives from the extent to which it possesses these logistics capabilities
relative to those of the other firms in the industry” (Stock, Greis, & Kasarda, 1999,
pg. 227).
A framework for conducting research, empirically, to show how logistics can
provide a competitive advantage was then proposed by Stock, Greis and Kasarda.
“The framework links a firm’s strategy, structure and logistics capabilities and their
influence on performance with in the constraints of the industry’s competitive and
logistics environment” (Stock, Greis, & Kasarda, 1999, pg 226).
An information interview was conducted with Noel Greis, the Director of the
Center for Logistics and Digital Strategy at Kenan Institute of Private Enterprise at
the Kenan-Flagler Business School in Chapel Hill. Dr. Greis stated that the goal of
this model was to help make US manufacturers more competitive (personal
communication, September 8, 2004).
The focus of the model was logistics, with three main factors considered:
speed, coordination and synchronization. The model proposes that “market forces
(or the competitive environment) shape the formulation of and implementation of a
firm’s strategy (at both the business and manufacturing levels) and its organizational
structure” (Stock, Greis, & Kasarda, 1999, pg 224). Dr. Greis agreed that the focus
of this research used logistics as a midpoint in order to bridge the gap between
performance and strategy; that logistics is an integrator of strategy, performance and
competitive advantage (personal communication, September 8, 2004).
From the Stock, Greis and Kasarda (1999) model, the review of literature led
Process by Zeng and Rossetti in 2003. A five-step evaluation framework and
implementation procedure was presented using a case study at a leading firm in the
US aviation industry. The framework identifies the key logistics cost categories and
also suggests a method for quantification (Zeng & Rossetti, 2003). This paper took
the logistical cost model a step further by providing a framework for quantification.
The companies for the study were selected and their backgrounds and
histories were examined, along with their business relationships and their global
logistics systems. A literature review was then conducted in order to look at all
existing information on logistics cost analysis. Then the resultant logistics costs
categories from the case study were defined and discussed. They were the
following: Transportation, Inventory holding, Administration, Customs charges, Risk
and Damage, and Handling and Packaging, all of which are used in this current
thesis research. The research applies these costs to the supply chain for the
Bed-bath and Bottom weights markets in the textiles and apparel industry, as opposed to
the aviation industry that Zeng and Rosetti used to conduct their study.
A third framework reviewed was the Total Cost Hierarchy model by Joseph
Cavinato (1992). This paper introduced a different approach to traditional costing
systems. It claimed that “all costs and factors that affect costs and create value
should be captured in a total cost/value model” (Cavinato, 1992, pg. 293). It
discussed 20 different cost factors that can be used in order to optimize costs, value
and the overall supply chain. The model gave a “core approach for product costing
that is useful in special studies as well as ongoing operations” (Cavinato, 1992, pg.
relationship between costs and supply chain structure. The difference being that
Cavinato applied his model using ten different cost factors, whereas this research is
only interested in logistical cost factors.
The author summarized the model as an approach for firms to use to
enhance interfirm dealings, as well as the supplier and customer relationship.
Cavinato stated that the competition is against other firms’ complete supply chains,
not among entities within the chain.
“The lack of proper metrics for a supply chain will result in failure to meet
consumer/end user expectations, sub optimization of departmental or company
performance, and missed opportunities to outperform the competition, and conflict
with the supply chain” (Lambert & Pohlen, 2001, pg. 1-2). Listed are seven steps for
creating a framework to analyze the performance of key business processes across
multiple companies.
Upon further review of the literature, Combining Quantitative and Qualitative Methodologies in Logistics Research by Mangan, Lawani and Gardner (2004) was found. This paper described how valuable it was to use a conceptual framework,
which encompassed both quantitative and qualitative methodologies, when
researching logistics.
The final two pieces of literature reviewed were applicable to the development
of a survey or questionnaire for the purposes of conducting information interviews.
Bruce and Daly (2004) conducted exploratory research on lean manufacturing in
supply chains and to gain insight into the management of those chains (Bruce &
Daly, 2004, pg. 157).
Bruce and Daly (2004) laid out a methodology that would be applicable to this
thesis study. It proposed the following steps, which have now been adapted to fit
the proposed research:
1. Conduct semi-structured interviews with key stakeholders in the sector, such
as the top market share holders in the Bed-bath and Bottom weights markets.
2. In order to determine the key stakeholders:
a. Conduct secondary research by looking at company reports and
industry websites.
b. Determine the most important factors as it pertains to market share
and use to determine who the key players are. Some factors might be:
sales, growth rate, product mix and uniqueness.
3. Then select the most relevant employees to interview, for this study it would
be the sourcing managers and the logistics managers.
4. Contact the managers by letter first explaining the purpose of the research
and asking for co-operation.
5. Contact the managers by phone in order to provide more details and arrange
the interviews.
6. Conduct structured interviews using an aide-memoire in order to allow for
comparisons to be made and for flexibility in responses. An aide-memoire is
“a written summary or outline of important items of a proposed agreement or
a. These interviews should be tape-recorded in order to allow for a
transcript to be typed.
b. After the transcript is finished it will be held by the researcher and also
sent back to the interviewee.
7. The interviews will then be scrutinized in order to see common trends and
flows. It will also be reviewed in order to find uncommon or random factors
for comparison or identification of unknown logistics costs.
(Adapted from Bruce & Daly, 2004, pg. 157)
The importance of this paper was that it conducted exploratory research in
the areas of logistics costing and supply chain issues. This thesis study follows prior
research with causal and descriptive research.
The article Cost Efficiency in Supply Chains – A Conceptual Discrepancy? Logistics Cost Management between Desire and Reality by Kotzab and Teller (2002) provided a good methodology for development of a questionnaire, if an
aide-memoire is chosen. The methodology has been adapted to this thesis research.
1. A questionnaire with logistics questions and also company-oriented questions
will be developed.
2. Determine companies to be interviewed by looking at market shares, sales,
percent growth, product mix and uniqueness within bed-bath and Bottom
weight markets.
3. Mail out to targeted respondents, logistics managers or person responsible
for logistics within that company.
5. Review questionnaires and decipher any pertinent information received.
(Kotzab & Teller, 2002)
After careful review of the prior art, it was determined that this thesis study is
feasible and does not encroach upon any previous studies but simply evaluates
preceding ideas.
Logistics Costs
Logistics can be defined as “a process of operation that includes the
purchasing, storing, transporting, and distributing of physical goods” (Gunasekran &
Ngai, 2003, pg. 826). There are two types of logistics: social and corporate. Social
logistics relates more towards group dynamics within the workplace. Corporate
logistics was more relevant to this study and includes supply logistics, production
logistics, sales logistics, reverse logistics, and disposal logistics (Gunasekran &
Ngai, 2003).
Jeannette Sullivan of PriceWaterhouseCoopers spoke of logistics and
sourcing models at the American Textile and Machinery Exhibition. She said that
“Logistics, access to supplies, transit time and labor costs have equal importance in
sourcing models” (Sullivan, 2004).
Mark Neuman, Counselor for Trade and Global Strategies for the Limited
Brand, agreed and stated that “labor costs are not the biggest factor in retailing
decisions. Innovation, product development, execution, delivery time, fashion focus,
and speed are just as important, if not more so” (Neuman, 2004, pg. 8).
In order to understand how delivery time and speed to market can be
concepts of logistics must be understood as well as the types of costs ascertained.
Other items must be taken into consideration such as hidden costs and root causes
of the known and unknown logistics costs. Finally, they must be compared with
other companies in order to determine what is missing in order to make the study
more complete.
Kotzab and Teller provide three concepts of logistics:
1. Operative Understanding: simple transportation/inventory/handling processes.
2. Tactical Managerial Understanding: management of the total flow of goods
and related services within a company and between their customers and
vendors.
3. Strategic Network Perspective: value-added inter-organizational flow
management. (Kotzab & Teller, 2002)
The third concept directly applies to this thesis study as it described an area
of logistics in the supply chain that has the qualities of being more end-user oriented
and more cooperative with an inter-organizational strategic management philosophy
that would have a positive effect on the overall performance of the total supply chain
(Kotzab & Teller, 2002).
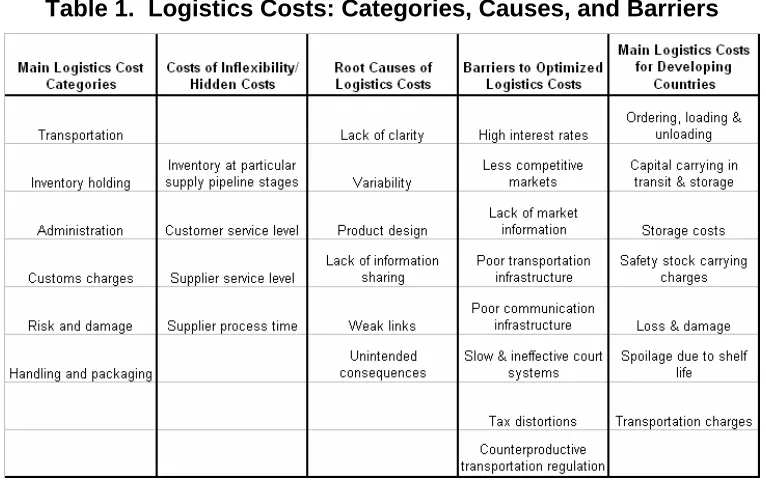
Within the realm of an end-user oriented supply chain, there are six main
traditional logistics costs. These components interrelated and resulted in an
important determining factor; the inflexibility costs.
After all costs were determined, traditional and unexpected, it was important
to look at the possible root causes for each. Ayers provided several possible root
causes for costs along the chain as well as barriers in addressing them: lack of
focus, confusion, ineffective motivators, boundaries, rigidity (Ayers, 2003).
After the costs and root causes were identified, it was important to benchmark
these factors against other companies in order to determine if there were items
missing. Roberts (2003) in his presentation Supply Chain Management: New Directions for Developing Economies included barriers to efficient supply chains in developing countries. Finally, Roberts also listed the logistics costs that developing
countries are trying to minimize.
These aforementioned cost categories, root causes, and barriers can be
Table 1. Logistics Costs: Categories, Causes, and Barriers
Source: Zeng & Rosetti, 2003; Lowson, 2003; Ayers, 2003; Roberts, 2003; Cesca, 2004
Goh and Ling wrote about the failures occurring within the logistics
infrastructure in China: the transportation networks, telecommunications systems,
customs procedures and warehousing facilities (Goh & Ling, 2003, pg. 889-913).
This paper provided good insight as to how and where the US logistics frameworks
can compete against China. With an understanding of both of these papers, this
research was able to consider other areas where developing countries, usually the
low cost leaders, are ill-equipped to compete. These ideas are further investigated
in order to generate possible competitive advantages.
In a comparison by Gunasekran and Ngai, they discussed the merits of using
a 3rd Party Logistics supplier in Hong Kong and what that company will provide. It
was a good overall review of what companies need to look for in their logistics
coordination. Finally, the article provides five corporate logistics areas to study
which served as a good starting point in the survey development of this thesis:
transportation, warehousing, inventory management, order processing/Information
system, and packaging (Gunasekran & Ngai, 2003, pg. 883).
This literature review found many areas of logistics costs to consider and
research. However, these logistics cost categories, causes and barriers were never
further researched by prior art to determine their validity.
Economic Competitiveness: Strategy, Performance and Competitive Advantage
“Everyone is looking for cost-cutting in their supply chains and reductions in
costs in inventory, so managing that inventory investment is critical” (Kay, 2003, pg.
2). A review of the literature shows that logistics is a key component to improving
strategy and performance and therefore gaining competitive advantages. These
factors will then improve the economic competitiveness of the firm as a whole.
In the article Where Should You Invest?, the author Kay (2003) pinpointed that “the potential for reducing costs...is still substantial for many companies, and
can provide them with tremendous competitive advantage…” This article stressed
the importance of inventory management to the supply chain and cost savings as a
competitive advantage. Harrington agreed in his article, Logistics, Agent for Change: Shaping the Integrated Supply Chain by saying that “these companies are encouraging logistics to play a key roll in helping them become more competitive in
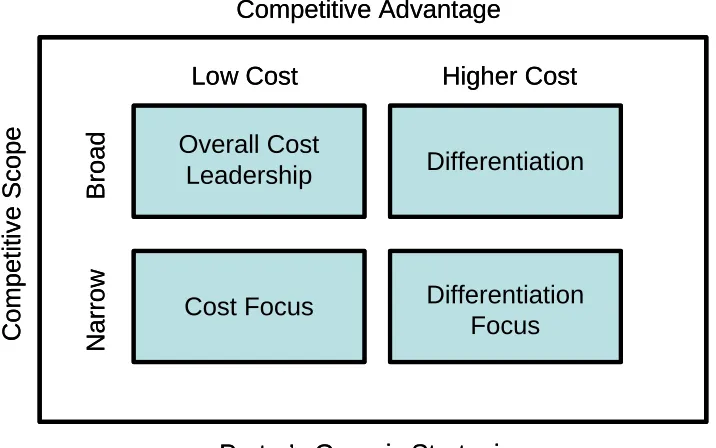
Further review of literature found Michael Porter’s Generic Strategies (1980)
which shows the relationship between differentiation, cost leadership and strategic
advantage. A graphical representation of this relationship is shown in Figure 4.
Figure 4. Porter’s Generic Strategies.
Source: Adapted from Michael E. Porter, The Competitive Advantage of Nations. (New York: The Free Press, 1980), pg. 39.
This model linked logistics to strategy and competitive advantage in order to
create value for companies. Many companies use the cost leadership strategy by
becoming the low cost supplier in their field. However, there can only be one low
cost leader. Other companies need to be able to create a differentiation for
themselves. Logistics costs, in the form of reduced lead-times, flexibility and speed
to market, create a competitive advantage. Chin, Tummala, Leung and Tang
(2004) agreed with Porter (1980) and used the relationship of competitive advantage
to strategy as a basis for their Study on Supply Chain Management Practices: The Competitive Advantage
Low Cost Higher Cost
Compet itiv e Scope N a rro w B road Overall Cost Leadership Differentiation
Cost Focus Differentiation Focus
Porter’s Generic Strategies Competitive Advantage
Low Cost Higher Cost
Compet itiv e Scope N a rro w B road Overall Cost Leadership Differentiation
Cost Focus Differentiation Focus
505-524). This paper provided a case study that examined the success factors in
developing and implementing supply chain management strategies for Hong Kong
manufacturers. It provided some insight as to whether Hong Kong manufacturers
are practicing these factors in their strategies and whether it led to their success.
The factors are: 1) Building customer-supplier relationships; 2) Implementing
information and communication technology; 3) Re-engineering material flows; 4)
Creating corporate culture; and 5) Identifying performance measures (Chin et al,
2004, pg. 506).
From the factors listed above, re-engineering material flows was considered
the same as logistics and found to be a key in reducing inventory levels and network
design. The paper claimed that “effective management of materials flows in the
supply chain is the most imperative strategic success factor” (Chin et al, 2004, pg.
509). Logistics was linked to competitive advantage through differentiation while
encompassing strategy and performance.
Supply Chain
In the article, Logistics: Shipping the Goods, Pang (2004) described the difference between logistics and supply chain for readers. “Supply chain
management is a means of managing a business while logistics is a category that
needs to be optimized for efficient supply chain management” (Pang, 2004, pg. 44).
In order to understand logistics, the overall supply chain must be scrutinized first.
Colman (2003) went on to say how important supply chain management is in
optimizing a business for competitive advantage. His article explained that a
advantage. This study solicited and then received over 600 responses from 22
countries. After an analysis of the responses, it was determined that management
of the global supply chain was a determining factor in a company’s success. The
study revealed that only “7% of companies surveyed are effectively managing their
supply chain (and therefore) profit margins are 73% greater than other
manufacturers” (Colman, 2003, pg. 8). The study also provided the three factors
that help companies differentiate themselves from others as the best. They are the
following: collaboration with customers, product management and introduction, and
implementation of technology within the customer, product, and supply chain
operations (Colman, 2003). The report was recently released from a global
manufacturing benchmarking initiative, Mastering Complexity in Global Manufacturing: Powering Profits and Growth Through Value Chain Synchronization.
In order to use the supply chain to boost profits and add value to a company,
one must truly understand every aspect of the chain, including the overall structure.
The company must be able to identify which chain is representative of their business
model. A review of existing supply chain models was conducted in order to identify
value chains specific to the textile and apparel industry. It looked at global chains
versus domestic chains. It is also reviewed chains specific to logistics, apparel
manufacturers and retailers, and textile manufacturers and retailers.
Supply Chain Models
A generic supply chain model that can be used for the purposes of this
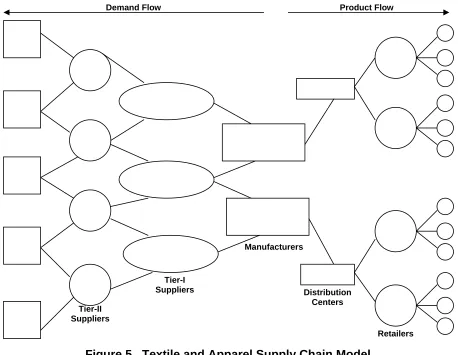
research is presented in Figure 5 (Chandra & Kumar, 2001, pg. 290). It looks at the
Figure 5. Textile and Apparel Supply Chain Model
Source: Chandra, C. & Kumar, S. (2001). Enterprise Architectural Framework forSupply-Chain Integration. Industrial Management & Data Systems, 101(6), 290.
A supply chain is defined as a network of members formed by autonomous
entities bonded together in order to provide goods and services to the consumer.
From Figure 5, it can be seen that for the textile and apparel sector, this supply
chain can be extensive. Through the coordination of information and material flows,
plant operations, and logistics,this network can work more effectively. The result is
a reduction in lead times and costs which ultimately results in an improvement in the
overall performance of each member (Chandra & Kumar, 2001, pg. 290).
Demand Flow Product Flow
Tier-II Suppliers
Tier-I Suppliers
Manufacturers
Distribution Centers
Figure 6. Components of the Textile and Apparel Supply Chain Model
Source: L. Cesca. 2004 adapted from Cokins, 2001.
Gereffi (1994) presented a model that considers buyer driven commodities
defining more clearly the use of overseas producers, along with domestic
manufacturers (Figure 7).
Figure 7. Buyer Driven Commodity Chain.
Source: Gereffi, G. (1994). The Organization of Buyer-Driven Global Commodity Chains: How U.S. Retailers Shape Overseas Production Networks. Commodity Chains and Global Capitalism.
Westport, CT: Praeger, 1994, 95-122.
The model presented in Figure 7 can be used to enhance the supply chain
presented by Chandra and Kumar. This is because it now takes into consideration
Sources
Converters Distributors Retailers Consumers
Suppliers
manufacturers. The coordination of logistics was even more important than in
previous models because it was now a global effort.
Global with Sourcing Agent
Leung (2000) incorporated a sourcing agent in the global supply chain model
and pronounced Figure 8 to be an optimal supply chain model. This model identified
the complexity of global logistics coordination, as shown in the Gereffi model (1994).
However, the logistics management is now considered the responsibility of the
sourcing agent. These enterprises handle all areas of supply and production for the
importers. The process is made easier for the importer but it remained difficult and
costly for the suppliers, manufacturers and sourcing agents. The optimization of this
Figure 8. Global Supply Chain Model Incorporating a Sourcing Agent.
Source: Leung, S.Y.S. (2000). World-Class Apparel-Sourcing Enterprises and the Restructuring of Existing Global Supply Chains. The Journal of the Textile Institute, 91(2), 73-93.
Textile and Apparel: Sourcing and Manufacturing Strategies
With the introduction of a sourcing agent into the supply chain model, it was
important to review different sourcing strategies used by various types of importers.
Bruce and Daly (2004) in, Lean or Agile: A Solution for Supply Chain Management in the Textiles and Clothing Industry presented four very unique supply chains to the textile and apparel industry that involved different sourcing and manufacturing
strategies. In Figure 9, the supply chain of a manufacturer of high fashion is
agents. Also, a majority of garments were manufactured in Morocco and Cyprus with the remainder in the United Kingdom (Bruce & Daly, 2004).
Figure 9. Supply Chain: Manufacturer of High Street Fashion
Source: Bruce and Daly. (2004). Lean or Agile: A Solution for Supply Chain Management in the Textiles and Clothing Industry. International Journal of Operations & Production Management.
pg. 158. 2004.
Figure 10. Supply Chain: Fiber Producer
Source: Bruce and Daly. (2004). Lean or Agile: A Solution for Supply Chain Management in the Textiles and Clothing Industry. International Journal of Operations & Production Management.
pg. 161, 2004.
The model in Figure 10 represented the fiber producer with their sourcing and
manufacturing strategy as twofold. The first part of the chain dealt with a simple,
When there was a more complex component, it was sourced from an advanced
supplier located anywhere (Bruce & Daly, 2004).
The third supply chain presented in this paper focused on the sportswear
accessory designer. Their sourcing and manufacturing strategy was based on sheer
volume of what was to be produced. They used two different
suppliers/manufacturers located in different areas of the world (Figure 11). They
manufactured domestically in the United Kingdom if there was less than 1000 pieces
needed. They would then produce in Asia if there were more than 1000 pieces
needed.
Figure 11. Supply Chain: Sportswear Accessory Designer
Source: Bruce and Daly. (2004). Lean or Agile: A Solution for Supply Chain Management in the Textiles and Clothing Industry. International Journal of Operations & Production Management. pg.
Finally, the premium brand manufacturer/retailer’s supply chain is shown in
Figure 12. Their sourcing and manufacturing strategy utilized other manufacturers
and did not manufacture anything themselves.
Figure 12. Supply Chain: Premium Brand Manufacturer/Retailer
Source: Bruce and Daly. (2004). Lean or Agile: A Solution for Supply Chain Management in the Textiles and Clothing Industry. International Journal of Operations & Production Management. pg.
165. 2004.
Supply chain configurations for the textile and apparel industry were important
to research through the review of literature in order to understand how they function.
However, it should be noted that not one supply chain in the literature took into
consideration logistics operations or costs as a significant component.
Market Analysis: Bed-Bath and Bottom Weights
Current Industry Status
In order to conduct research in the Bed-bath and Bottom weights market, the
classifications of both needed to be determined. First, all Standard Industrial
definition was conducted by identifying the NAICS codes for Bed-bath and Bottom
weights. Finally, the product codes were found for each category. This information
is shown in Tables 2 and 3.
Table 2. Bed-Bath Market: SIC, NAICS & Product Codes
SIC code Description
2211 Cotton, Woven Fabric
2299 Textile goods, NEC
2392
Housefurnishings: Textile
5023 Home Furnishings
NAICS code Description
313210 Broadwoven Fabric Mills
31331
Textile and Fabric Finishing Mills
313312
Textile and Fabric Finishing (except broadwoven) Mills
314129
Other Household Textile Product Mills
Product code Description
49950
Bedding, Bedspreads, Blankets, & Sheets
576995 Towels
Bed-Bath
Table 3. Bottom Weight Market: SIC, NAICS & Product Codes
Source: Table adapted by L. Cesca,(2004) from Harris InfoSource: “Apparel-Clothing Manufacturing Industry Report,” (2004)
Once the product categories were defined, a review of information from the
US Census Bureau, as well as various trade magazines was conducted. This
research found an alarming trend in both the Bed-bath and Bottom weights markets.
Imports of both product categories are on the rise into the United States. The import
penetration for the Bed-bath market in 2003 was at almost 160 million units and
had been declining for the past several years with Bed-bath at approximately 50
million units and Bottom weights at 750 million units (Figures 13 & 14).
U.S. Bed-Bath Imports vs. Production
0 20,000 40,000 60,000 80,000 100,000 120,000 140,000 160,000 180,000
1997 1998 1999 2000 2001 2002 2003
Year Q u a n ti ty i n t hous a nds of uni ts U.S. Imports U.S. Production
Figure 13. US Bed-Bath Imports and Production.
Source: 1997-2003 Current Industrial Reports: Bed and Bath Furnishings. (Online). September 20, 2004. US Census Bureau. http://www.census.gov/cir/www
U.S. Bottom weights Production vs. Imports
0 500,000 1,000,000 1,500,000 2,000,000 2,500,000 3,000,000 3,500,000
1997 1998 1999 2000 2001 2002 2003
Year Q u an ti ti y i n th o u s a n d s o f uni
ts U.S. Imports
U.S. Production
Figure 14. US Bottom Weights Imports and Production.
When seeing this occurrence, it was noted that further examination of both
the Bed-bath and Bottom weights markets must be conducted. This examination is
needed in order to fully understand why the US is losing their hold on these two
markets to import penetration. This information is found in the following sections of
this study.
Bed-Bath Market
During further investigation of the Bed-bath market, two main trends were
found. Trend 1 found that the only retail area experiencing an increase in market
share was the home textiles area (Sloane, 2004). Home furnishings stores sales
grew by 9% in 2003, mainly in the specialty home textiles chains (Wagle & Driscoll,
2004). Within that market, the specialty stores were starting to dominate (Sloane,
2004). It was noted that sales for these types of stores rose by 15% in 2003 and by
28% in 2002 (Wagle & Driscoll, 2004). This is important because while the retail
sector is experiencing growth as a whole, the US production of these goods is
declining, Trend 2. Therefore it can be inferred that these retailers are buying their
home textiles from other countries. In tandem to that finding, it was found that India,
Pakistan, Brazil, Turkey and China were the top five importers of Bed-bath products
into the United States. This is shown in Figure 15, US Imports of Home Textiles by
U.S. Imports of Home Textiles by Country $0.0 $20.0 $40.0 $60.0 $80.0 $100.0 $120.0 $140.0 $160.0 $180.0 $200.0
India Pakistan Brazil Turkey China
Country
Impo
rts (in m
illion $ ) 2003 2004 13% 19% 18% 20% 77%
source: Home Textiles T d
Figure 15. US Imports of Home Textiles by Country
Source: February 17, 2004. Top 15 Vendors – 2003. (Online), August 30, 2004. Home Textiles Today. http://hometextilestoday.com
The importance of both of these trends is that the specialty retailer’s sales are
increasing in the Bed-bath market as production is moving into other areas of the
world. This is significant because it showed that the US is having a hard time
competing.
Bottom Weights Market
Upon further investigation of the Bottom weights market, it was noted from the
graph shown in Figure 14 that the production of Bottom weights in the US was
beginning to decline. At the same time import influx was increasing, putting the US
Office of Textiles an Apparel (OTEXA) showed the countries with the highest
shipments of cotton and synthetic bottoms into the United States (Figures 16 & 17).
Major Shippers Report: World Shipments of Cotton Bottoms
0 5000000 10000000 15000000 20000000 25000000 30000000 35000000 Mexico Domincan Republic
Hong Kong Vietnam Guatemala Honduras
Country S h ip m e n ts o f C o tto n B o tto m s (i n d o z en s) Dozens
Figure 16. Top Countries Shipping Cotton Bottoms
Source: Office of Textile and Apparel: Major Shippers Report, 2004
Major Shippers Report: World Shipments of Man-Made Fiber Bottoms 0 1000000 2000000 3000000 4000000 5000000 6000000 7000000 8000000 9000000 10000000
Mexico Indonesia China Guatemala Dominican
Republic Bangladesh Country S h ip m e nt s of M a n-M a de Fi be r B o tto m s (i n d o z e n s ) Dozens
Figure 17. Top Countries Shipping Man-Made Fiber Bottoms
From these two charts, inferences can be made that Mexico, Central America
and Asia were the top producers in the Bottom weights market. Therefore these
regions, and the companies within, must be studied in order to gain insight as to
CHAPTER III
METHODOLOGY
Purpose of Research
The purpose of this research was to determine the logistics costs with the
global textile and apparel supply chain. It would then examine the differences
between United States manufacturers using a domestic or blended sourcing strategy
and their management of those logistics costs. It would also review US retailers and
sourcing agents in order to compare their approach to the abovementioned
manufacturers. Looking at these four types of companies within the Bed-bath and
Bottom weights markets, competitive advantages as a result of logistics was found.
Finally, once competitive advantages were found, their relationship to strategy,
performance and economic competitiveness was then studied as it related to
logistics cost optimization.
The purpose of this research was to answer the following questions
1. What are the logistics costs associated with the textile supply chain for the
Bed-bath and Bottom weights markets?
2. How are these costs managed along the supply chain in order to create
specific structures for particular companies?
3. Are these cost structures different in different markets, such as:
a. Bed-bath Market
b. Bottom weights Market
4. What types of competitive advantages are specific cost structures providing?
b. How do costs fit together to create different types of value added?
5. How does a company use their cost structure to compete economically?
What competitive edge are they looking for?
6. How does a company control their cost structure to fit their strategy? How
does a company use their strategy to determine their optimal logistical cost
structure? Or do they use their cost structure to formulate their strategy?
7. How does a company’s logistical cost structure relate to their performance?
1. What makes a company classify their performance as good or poor
8. Is there a logistical contingency plan in place to account for problems along
the way?
9. Do companies use a quantitative model for investigation into their logistical
costing?
10. Is there a way for industry companies to benchmark, for logistical cost
structures, against their competition?
Research Objectives
The following are the main research objectives that were used for this study:
RO1: To examine logistics costs in terms of:
RO1A. The percentage represented in the finished product cost. (RQ1)
RO1B. The global textile and apparel supply chains. (RQ1)
RO1C. Cost structure management. (RQ2 & RQ3)
RO2: To examine competitive advantage in order to:
RO2B: Determine the advantages of specific logistical chains and costs.
(RQ4 & RQ5)
RO2C: Determine the relationship to economic competitiveness. (RQ5)
RO3: To determine if there is a relationship between logistical cost structures and
economic competitiveness in terms of:
RO3A: Strategy (RQ6)
RO3B: Performance (RQ7)
Research Design
Mixed Methods
The mixed methods approach was used in this study in order to
accommodate both the quantitative and qualitative data collections and analyses.
This study was conducted in a concurrent matter, as both the quantitative and
qualitative data were collected in tandem and implementation was simultaneous.
These conclusions were made by referring to Table 4 and using it for decisions
Table 4. Decision Choices for Determining a Mixed Methods Strategy of Inquiry
Source: Creswell, J. (2003). Research Design: Qualitative, Quantitative, and Mixed Method Approaches, 2nd ed. Thousand Oaks, CA: Sage Publications, pg. 211.
Once it was determined from Creswell’s matrix that a mixed method approach
was needed, a strategy was chosen. It was determined from the matrix that the
research did not have a sequence of implementation; it ran concurrent. Also, it gave
equal priority to both quantitative and qualitative data collection and the integration
took place during that collection. Finally, the theoretical perspective was explicit.
Therefore, the Concurrent Triangulation Strategy was used in order to conduct this
research and keep with the chosen objectives of using a mixed methods design
(Creswell, 2003, pg. 214).
Implementation Priority Integration
Theoretical Perspective No Sequence
Concurrent Equal
At Data Collection
Sequential--Qualitative first Qualitative
At Data Analysis
Explicit
At Data Interpretation
Sequential--Qualitative first Quantitative With Some Combination
Figure 18. Concurrent Triangulation Strategy
Source: Creswell, J. (2003). Research Design: Qualitative, Quantitative, and Mixed Method Approaches, 2nd ed. Thousand Oaks, CA: Sage Publications
Figure 18 shows the Concurrent Triangulation Strategy that was used for both
phases of the research. The first was data collection in the form of secondary
research that focused on both qualitative and quantitative information. Primary
research was then conducted in order to complete Phase II while using both
qualitative and quantitative approaches.
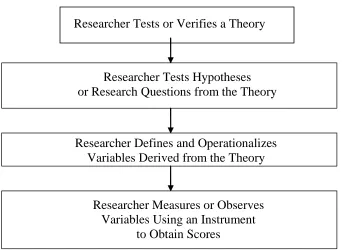
Inductive and Deductive Logic
Due to the use of a conceptual model in this thesis research, inductive and
deductive logic was used when conducting research. By definition, inductive
research is primarily used to gain data on generalizations or theories from both the
literature and informal information interviews (Figure 19). Therefore, it was used
during the secondary data collection, or Phase I. Deductive logic was used in the
latter part of this study, during the primary data collection in Phase II and is shown in
Figure 20.
QUAN
QUAL
QUAN Data Collection
Quan Data Analysis
QUAL Data Collection
Figure 19. Inductive Logic
Source: Creswell, J. (2003). Research Design: Qualitative, Quantitative,
and Mixed Method Approaches, 2nd ed. Thousand Oaks, CA: Sage Publications, pg. 132.
Generalizations or Theories to Past Experiences and Literature
Researcher Looks for Broad Patterns, Generalizations or Theories from
Themes or Categories
Researcher Analyzes Data to Form Themes or Categories
Researcher Asks Open-Ended Questions of Participants or Records Field notes