A Survey on Big Data Process Models for
E-Business, E-Management, E-Learning, and
E-Education
Anish Kumar Varudharajulu 1, Yongsheng Ma 2
MSc. Student, Department of Mechanical Engineering, University of Alberta, Edmonton, Canada1
Professor, Department of Mechanical Engineering, University of Alberta, Edmonton, Canada2
ABSTRACT: The growth of an organization in the market relies on customer’s satisfaction towards its products and services. Due to the dynamic nature of the Internet, and increasing blogs, forums, and customer feedback, it usually remains a key issue in any industry to identify and extract data attributes manually. The time and manpower required to collect the data and analyse it is cumbersome. To overcome these difficulties, organizations need to use big data processes to focus on customers by automating their information processing with good qualification to improve product quality, and customer satisfaction. In this paper, application of techniques and concepts of data mining in various product and process models will be reviewed along with an empirical study on how to extract data from the Internet, and how data mining techniques can be used in the product and service-based industries to implement Industry 4.0. Observations and insights from this paper could provide guidelines for academic, business ventures, and industry practitioners to implement the discussed big data techniques in the fields of E-Business, E-Management, E-Learning, and E-Education.
KEYWORDS: Big data; social media; e-business; classification; clustering I. INTRODUCTION
A study about 35 years of Internet in 2004 [1], concluded that “Any future technological advancement of the Net, the primary contribution of the web remains the people, who utilize and add to make it prominent. We need to stay up with the latest about every single new improvement and advancements of the Internet to truly exploit its abilities and potential outcomes” and today it is proved that a whole lot of data is created by people in various social media platforms.
A. Data Mining:
The applications of machine learning and AI (Artificial Intelligence) in engineering were developed as early as the 1980s [2] [3]. Machine learning can be broadly applied to classes of tasks that may appear unrelated to the non-technical eye [4]. Data mining can be widely applied to any field, [5] analyzes soil data using data mining techniques to verify if the soil in Salem district is good for agriculture. In the field of education, [6] uses data mining to gain valuable insights into students’ learning experience using Facebook, [7] uses data mining in credit card risk assessment and fraud detection.
B. Big Data:
The challenging properties of big data are as follows [11]:
Volume refers to the amount of data generated from various feedback in the form of surveys, emails and
customer contact forms, usability tests, exploratory customer interviews, on-site activity, comment boxes, instant feedback from your website. There is a massive amount of feedback lying unused in the social media and the Internet.
Variety (Scattered) refers to the different types of data like blog, music, video, picture, geographical position,
etc.
Velocity (Dynamic) refers to the high speed of the data process, i.e., the entire information supply chain must be
near real time.
Veracity refers to the low reliability and disordered data.
Value refers to the ability to extract valuable information which can be used for the betterment of services.
Data mining techniques are commonly used to address such challenges. Raju and Sravanthi [12] provides information regarding the application of the concept and techniques of web mining for social networks analysis and reviews the related literature about web mining and social networks analysis. It also provides inputs on how to use web mining and a general process of using web mining for social networks analysis have also been studied.
C. Big Data Repositories:
The trend of big data has been evolved mainly because of the available sources of data. We have several big data repositories [13] which can be used for data acquisition like Facebook Graph [14] although much of the information on users’ Facebook profile is private, a lot isn’t. Facebook provides the Graph API as a way of querying the huge amount of information that its users agree to share with the world, UK Government open data portal, data from the UK Government, including the British national bibliography metadata on all UK books and publications since 1950 [15], The CIA World Facebook [16] provides information on the history, people, government, economy, energy, geography, communications, transportation, military, and transnational issues for 267 countries. Their reference tab includes: maps of the major world regions, as well as flags of the world, a physical map of the world, a political map of the world, a world oceans map, and a Standard Time Zones of the world map, US Government portal [17] with information on everything from climate to crime, Google trends [18] provide statistics on search for any given term, since 2004, epidemiology and population statistics, National Climatic Data Center [19] huge collection of environmental, meteorological and climate data sets from the US National Climatic Data Center. The world’s largest archive of weather data, Likebutton [20] mines Facebook’s public data – globally and from your own network to give an overview of what people ‘Like’ at the moment, etc. All these data are available to conduct research, develop web and mobile applications, design data visualizations, etc.
D. Social Media
Social media is the main source of information. Nowadays people are more expressive on social sites, being it about oneself, organization or society. As an insight, here are few examples of what data about a person is scattered on the social media. Twitter is an unending stream of encounters, suppositions, and assessments of the customer about everything from PCs to films which can be utilized by organizations. LinkedIn’s major part of the revenue comes from providing access to information about its members to recruiters and sales professionals. Pinterest - If a product has a high number of pins and re-pins, this generally tells the producer of the product that it is well liked by many members of the Pinterest community. Now that Pinterest lets marketers access the data, companies can view user comments on the product to learn why people like or dislike.
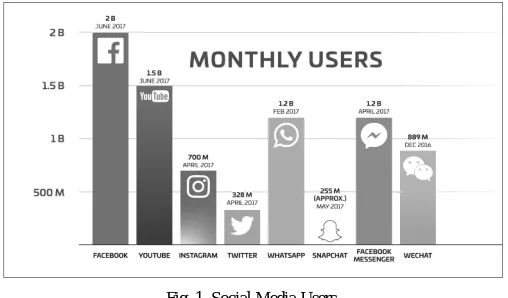
in Google Talk, Gmail, and Android are followed by Google. Google Apps like Docs, Spreadsheets, Calendar, and so forth. All these are profitable information/records of clients. In Facebook, you can put advertisements using parameters like area, sex, age, likes and interests, relationship status, working environment and instruction of your intended interest group. Facebook is even tracking your mouse movements to recognize it is not a robot, another way they recognize it is by monitoring whether your computer is foregrounded or backgrounded. According to the study conducted in 2017 [21], Two billion makes Facebook the largest social app in terms of logged-in users, above YouTube’s 1.5 billion, WeChat’s 889 million, Twitter’s 328 million and Snapchat’s estimated 255 million.
Fig. 1. Social Media Users.
The Facebook platform is a vital part of the big data ecosystem and can be significantly utilized with profound reach to users, consumers, businesses, governments, and non-profit organizations, etc. Businesses can use Facebook as their business execution platform for product design, innovation, decision making, consumer or stakeholder relations management, and marketing [22]. For example, personal info like gender on Facebook can be used to pop up related clothing ads for male and female users.
This paper is organized as follows. In Section II, the attempts to extract big data in various process models and their capabilities are discussed. In Section III, data mining tools and techniques to extract, and process data are discussed along with observations from empirical studies on these tools and techniques. Future research directions are discussed in Section IV.
II. RELATEDWORK
Knowledge-based process models which can convert big data from the Internet into valuable collaborative engineering information will embrace global competitiveness and make an organization to lead their market by interpreting and satisfying the customers’ expectations, by using data and technology to understand the customer needs.
A. E-Business
1) Agriculture
E-business platforms can be used in agriculture for getting latest updates on the national network of cooperative policy and real-time market rates of agricultural products from agricultural offices. It can aid farmers in finding the latest information on agricultural products supply or demand information [24] and to learn the new planting and cultivating production technology from the agricultural research experts.
ICT have enabled rapid innovations in GPS (Global Positioning Systems), remote sensing, agricultural equipment data, agriculture departments’ data, and social data like agriculture forums, crowdsourcing and mobile sourcing for site-specific management. Leonid et al. [25] studied the augmented approach to emerging technologies identification in agriculture and food sector. Cloud-based systems can gather queries from farmers directly through preconfigured devices and provide the required information using big data analytics without taking much time [26]. There is a need to track data about the reservoirs’ monthly water history and global surface water using ICT [27]. On careful analysis, these data can help the government to identify high-risk areas, for taking decisions on water usage, and infrastructure construction, for storing and distribution of water. Big data systems for water management can aid in preventing losses from water shortage, food shortage, livestock and fish breeding. There are losses due to the fact that many governments give importance to the agriculture production process while they fail to do so in the post-production process. We can compensate this by facilitating agricultural e-commerce [28].
Climate change has increased the loss in agricultural production systems. Information about the environmental factors like greenhouse gas emissions, humidity, moisture, wind, water, carbon dioxide collected from sensors deployed in agricultural fields, and computed tomography digital images [29] is a major source of big data. These data can be used in precision agriculture [30] to assist agricultural layout and production based on farmland environmental factors [31]. Sana et al. [32] monitor chili crop and gray mold disease through wireless sensor network. A study [5], analyzes soil data using data mining techniques to verify if the soil in Salem district is good for agriculture using data collected from Farm Science Centre. Regression models can be used to forecast rainfall [33]. Such predictive systems can increase profitability by enhancing the productivity of crops, food security, land, equipment and labor management, climate change awareness, and mitigation. In addition, they can be used to develop customized and prescriptive farm specific decision support systems [34].
Information gap in supply and demand networks can hinder the farmers’ income [35]. There is also a need to integrate the information about deforestation, afforestation, land degradation, water contamination, and economic, social, and cultural trends to develop sustainable farming practices that do not degrade our environment [36][37]. The data from heterogeneous systems mentioned in this section can be integrated into one framework and processed with the help of tools and techniques discussed in Section III.
2) E-Commerce
Internet marketing is the core of product sales in many e-commerce companies. Social media data mining has been widely used for the purpose of e-commerce in sites like Facebook and YouTube by tracking the customer preferences through the pages and channels he visits. Customer clickstream analysis and path analysis can be done to determine the frequently visited products [38]. Using this data, association rules can be created for product placement optimization, product recommendation in the websites and potentially profitable products can be identified. It can also be used to determine the appropriate location for advertisements. By tracking the user’s region, age, and other personal information, three types of data can be extracted.
1. Historical data: Expenditure and purchase of similar products.
2. Market research data: Forums, questionnaires, surveys, and newspapers.
3. Browser data: Browsing history and preferred websites.
The technical gap in these recommender frameworks is clarified through the case of eBay, if a user expresses his preferences for a certain category like books by rating it, this data will be overlooked when the framework processes suggestions for things in another category like movies. In addition, it is natural to expect that a person buying a Harry Potter novel is most likely to buy Harry Potter movies. The idea of relating customer preferences in one class to another using customer ratings and feedback is still at the base of research [40]. Implementing such decision-making systems to forecast demands will enable the procurement teams to maintain just-in-time inventory and thus reduce delays in production and/or distribution.
3) Business Intelligence and Analytics
Business Intelligence and Analytics (BI&A) is the knowledge-based information processing to make business-centric decisions related to e-commerce, e-marketplace, e-banking, healthcare, and information security. Decision tree learning algorithms can be used in BI&A for prediction modeling, It uses a decision tree as a predictive model that maps observations about an item to conclusions about the item's target value [41]. A decision tree can be used in E-Business for customer churn predictions to take proactive actions and retain the valuable customers [42]. Since decision tree can analyze numerical as well as categorical data, they can be used in E-Learning for predicting student performance [43] to know the risk of a student failing or dropping out off from the course.
Substantial healthcare data should be changed over into knowledge and information, which can control cost and keeps up the high caliber of patient care. Without data mining, it is hard to understand the significance of information gathered inside medical databases like Healthdata.gov [44] which has 125 years of US healthcare data including claim-level Medicare data. For example, we can use age as the dependent attribute to predict blood groups which have high risks of sickle cell disease [45].
Trained machine learning algorithms can be used to facilitate in predicting fake Facebook profiles using attributes like age, gender, and number of Facebook friends [46]. Similar algorithms can be used in credit card risk assessment and fraud detection [7] by training them with vulnerability datasets of customers holding credit cards. Mined social data from Facebook profiles can be used to extract intellectual knowledge for human behavior prediction. Human behavioral pattern recognition can be used by organizations to distribute the work to get high performance delivered. The same can be used for the purpose of focused marketing [47].
Key functions of BI&A involve processing of unstructured content by information retrieval, opinion mining, social media analysis or social network analysis. Pippal et al. [48] studied how to use data mining to generate effective business strategies. Web applications have the ability to gather a significant amount of feedback from a diverse customer population for different businesses. There is a need for developing appropriate information processing frameworks to find the key node of E-Business big data from this feedback, relate it to the organization nodes and tasks and aid in the process of decision making [49].
B. E-Management
1) Product Lifecycle Management
The concept of PLM (Product Lifecycle Management) was developed in the early 21st century as an extension of PDM (Product Data Management). PLM is supposed to support the information flow of a product from its cradle, i.e., conception, design, manufacturing, marketing, and sales to the grave, i.e., use, service, maintenance, and destroy or recycle [50].
Product lifecycles have declined, the organization bringing the product to the market first will be the most profitable provided the product meets the customer expectations. Although there is a lot of groundwork before manufacturing a product, the most essential steps are marketing analysis and product design [51]. The most important expectation of these steps is to meet customer demands in various forms like comments on social media, the pages customers’ like on Facebook, the websites they bookmark, etc.
Organizations have shifted from pushing standardized mass-produced products to a pull system able to respond to customer expectations, i.e., from a product-oriented market to a customer-oriented market. A comprehensive framework is required to analyze customer demands which are scattered over the Internet. As different kinds of data flow along the lifecycle in form of customer feedback, it may be stored and then transferred to any form, like number, picture, chart, and so on. Figuring out customers’ needs accurately and quickly is an effective means for manufacturers to increase customers’ approval with the loyalty.
2) Supply Chain Management
SCM (Supply Chain Management) is an enterprise-wide view of unifying the core business processes of marketing, sales, product development, operations and other capabilities of an allied group of businesses to respond to marketplace opportunities as a single business entity. Previously businesses leverage their internal competencies, performance measurements and had distinctive business strategies but SCM shifts attention towards customers and suppliers as new sources of competitive advantage by looking beyond the frontiers of their own organization. A research in business-to-business e-commerce [53] investigates interdependence and coordination between multiple firms and finds that supply channel mutuality, process redesign, and coordination are all closely associated with firm performance.
The goal of supply chain management [54] is to synchronize the requirements of the customer with the stream of materials from suppliers to effect an equilibrium between the conflicting objectives of high customer service, low inventory, and reduced cost. In a study [55] to determine how firms rely on processes to capture insights on what customer values, it was discovered that firms are not involved to the extent they could to reap the benefits of emergent supply chain opportunities with enough lead time to develop sustainable products.
ICT (Information and Communication Technologies) have created the linkage between once separate companies into a single competitive supply chain system. Big data sharing between Walmart and P&G [56] have enabled more effective category management, continuous replenishment, and process coordination, which can collectively aid to make the supply chain more efficient. ICT can enable networking of geographically dispersed teams, connectivity between companies, vendors and customers for integrating the inventory system to the supply chain. For effective management of a company’s supply channels the velocity of feedback that comes from various functions like sales, marketing, customer service, maintenance and insurance services should be captured, stored and retrieved whenever necessary. In addition, the continuous improvements and innovations in ICT can cause scope creep of any operation/services irrespective of its function.
Several studies have been made to mitigate the bullwhip effect in SCM which causes excess or shortage of inventories, unstable production activities and unplanned variations in capacity planning. In [57], the author analyses the big data properties discussed in Section I and infers that velocity has the greatest impact on the bullwhip effect. Supply chain applications are still using traditional data from their ERP (Enterprise Resource Planning) system only. Such systems will soon be obsolete if they don’t have the capability to integrate the increasing volume, variety, and velocity of customer-generated data. In [58], the author discusses how big data analytics can be used to extract useful information and aid in supply chain decision making.
Next wave will be an era of AI and machine learning where most of the supply chain decisions will be taken by algorithms which can evolve themselves to learn from data and different use cases.
3) Collaborative Engineering
Elisha Ondieki Makori [60] studied the application of the Internet of Things and the factors fostering the extraction of information. It was found that 91% of respondents extract data for the purpose of communication and effective collaboration between teams. There is a need to exchange product information and requirements near real time. For example, if reducing production time is the target then all departments like the body shop, paint shop, foundry, engine manufacturing, transmission manufacturing, assembly lines, quality control, etc. should work collaboratively to achieve the target. Sometimes one or more parts may be manufactured in vendor location and there is again a need to collaborate. The compatibility of software developed by different companies and the technology alliances formed between different automotive companies are key examples of collaborative engineering.
Manufacturers are facing many challenges like better product quality, lower costs, a variety of parts from different vendors are needed to be procured due to complex designs, diverse teams scattered over many locations and product design changes must be communicated effectively. To respond to new business requirements and to overcome the aforementioned challenges, implementation of collaborative process planning and manufacturing technologies like [61] should be done. Frutos and Borenstein [62] propose a collaborative information model using the Internet to quickly and effectively provide an interface between customers and companies. To improve the performance of such collaborative engineering models, integration of the social media feedback into the inter-enterprise data near real-time and enabling the design team to be aware of the customers’ expectations is crucial.
4) Product Design and Development
Twenty years ago, Alan Mullaly - CEO of Boeing 777 mentioned about AI in product design and development, ‘‘Computers don’t design airplanes. We have not put the knowledge that is in the airplane designer’s head into AI that balances all these objectives. But someday we will continue to probably move to that. Right now, the knowledge to design airplanes is in the designer’s head’’.
There were several reasons for his comment:
Lack of Standards: They did not have proper standards which focused on customers like ISO 10002 [63] -
Customer satisfaction guidelines for complaints handling in organizations, ISO 10004 [64] - Guidelines for monitoring and measuring Customer satisfaction. Also, there were no proper standards for big data
programming [65] and databases [66]. For instance, Quality management systems fundamentals and vocabulary
- ISO 9000 [67] was first published in 1987 only.
Data Repositories: They did not have data sharing systems that support the process through which explicit or
tacit knowledge is communicated to other individuals. But now after the introduction of different DBMS (Database Management Systems), we are in the generation of big data. A report in 2010 [68] states that the data storage units of measurement in the world have reached to PB (Petabyte) and ZB (Zettabyte).
The knowledge-acquisition bottleneck: This is due to inadequate tools for knowledge-acquisition in an intuitive
manner. There is a need for the development of machine learning process models for automated knowledge acquisition from social media and other big data repositories.
Traditionally managers use sales data and sales call reports to take decisions on what customers will like. Focusing on what the customer currently needs is entirely different from focusing on what he will need in the future. A study [69] suggests that creating an environment to get insights about customers and looking for small clues to judge what customers may value in future and take decisions to modify existing processes and product design was considered innovations by the customers.
In few companies, users in online communities are even permitted to join in the design phase. An effective software support tool that can aid the designer to make better decisions based on customer feedback needs efficient data representation schemes. Senthil et al. [70] studied future of knowledge representation in product design systems and supporting tools providing such information. In a study [62], the authors present the design and implementation of an information system framework for agile interactions between companies and customers in a mass customization environment.
big data, marketing can be more precise and specific than ever, which presents great opportunities for customization. Furthermore, the comments from online forums can be quickly involved in product design with the help of big data analysis capability.
C. E-Learning
E-Learning today is continuously evolving from standalone computers to multimedia hosted on the Internet. High educational tuition rates and an absence of customization in traditional education are driving numerous students to look for other options to getting a college or school instruction from conventional universities and colleges. E-learning refers to the use of various kinds of electronic media and ICT in education. E-learning encompasses all learning undertaken through electronic delivery in the form of audio, video, schematics, text, animations, 3-D models, etc. Learning is accomplished over the Internet, a computer network, via CD-ROM, interactive television, or satellite broadcast. For example, The University of Alberta Libraries [71] has its own collection of databases where students can download all types of bibliographies for their research.
Big data techniques can be used in e-assessment which is an important component of E-Learning to provide PLP (Personalized Learning Path). Adaptive PLP can be developed to increase learners’ satisfaction by setting proper education objectives to provide adequate learning content to reduce additional learning time and decrease learner cognitive overload [72]. Text mining can be used to reduce the load of a learner by giving only minimum data which will be enough to acquire the necessary knowledge [73].
Big data can also be used to track pages visited [74], total time, learning styles, the average final score for a chapter, knowledge level, difficulty level of the chapter, chat messages sent, forum messages read, score and time of day when learning operates at its best for different users [75]. This information can be used for course management in LMS (Learning Management Systems) and custom content development in CMS (Content Management Systems). In addition, video or content viewing time [76] in E-Learning portals is a direct measure of the amount of cognitive engagement of the learner.
Machine learning techniques can be used to collect student searches which returns zero records and then the respective articles can be bought by the University and made available for the students online to download. In addition, if there is a capability for students to write reviews in these types of e-libraries, we can know what the students want through automated systems which can convert the reviews and gives you valuable insights on the journals/books needed to be purchased.
Students enrolled in E-Learning platforms will not be able to meet their professor and they don’t have a set office hour to ask doubts. In this case, students use the existing feedback systems and online forums which work only one way, i.e., if a student writes a feedback or review, there is a delayed response, or he doesn’t get a reply in most of the cases. As a result, the student loses interest and hence the drop-out rates are more in E-Education. Such educational systems should be made interactive and students should get a reply for their queries in online forums in real time using AI rule-based systems.
D. E-Education
Advancements in ICT enables storage, scalability, extraction, filtering, and facility of educating online irrespective of location barriers. The Internet is widely used for educational purposes through blogs, journals and websites like https://www.w3schools.com, https://www.khanacademy.org, etc. SCROM (Sharable Content-Object Reference Models) are also widely used for embedding authoring capabilities, customizing the GUI (Graphical User Interface), content auditing, and collaborative learning. There is a need for the teachers to change from being task givers and scorers to coaches and pioneers of E-Education.
can be used to assist E-Education by developing systems to recommend elective courses to students based on their past grades [78].
Students are studying online rather than traditional classroom education. The drawback is that there is no face to face interaction. It will be difficult for the instructors to predict the students understanding level. To overcome this student data like how he is performing on exercises in web text and how many days he is accessing the web text can be tracked, which can aid in improving the quality of E-Education [79]. We can extract data like which students visit the site more frequently, who visits the site at the early period of the term to have reasonable predictions of success and failure in the course. This can help in preventing failures and prediction of academic achievements [80].
Augmented learning based on the learner's skills, projects, assignments, and flipped learning is at the base of the research [81]. Big data integration can enable interactive learning, content analysis, predictive analysis, performance monitoring, performance evaluation, knowledge discovery, pattern generation, and more set of capabilities to assist decision making in E-Education [82]. There is a need for a comprehensive framework to integrate the complex data from various tools used in E-Learning platforms for the purpose of E-Education. Classification and clustering algorithms, which can systematically extract the data from SCROM, LMS, CMS, online forums, feedback systems, etc. and re-orient them into useful data to provide valuable insights for decision making are discussed in Section III.
III.PROPOSEDALGORITHM
Data mining as the name implies is the process of extracting meaningful information from a huge set of data. This section describes how data mining can be used for identifying unknown/unexpected patterns in product and service-based companies. Application of classification and clustering algorithms in complaint category identification, CNC (Computer Numerical Control) machining safety prediction, mechanical fitting failure detection, car price prediction, healthcare infrastructure planning, emission control and management, distribution channel optimization are discussed in this section.
A. Data Scraping:
The Internet is the main sources of data. To make the model close to reality, data should be dynamically extracted from Facebook / Twitter or other websites, normalized, and used further for classification and clustering. The available APIs (Application Programming Interfaces) can be integrated with the source code of the web application to extract data from various websites like Facebook / Twitter periodically. This can reduce the manual effort to a great extent. The next topic in this section describes one of the widely used API of Facebook.
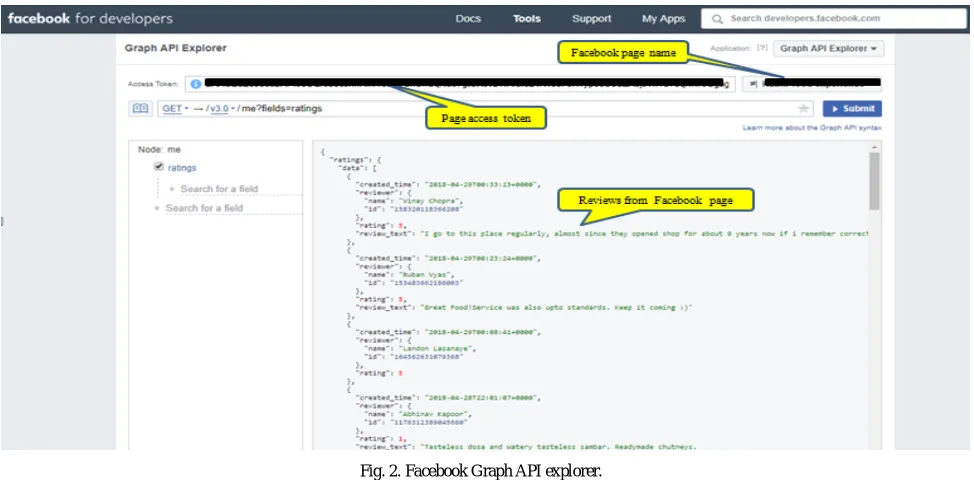
B. Facebook API:
The Facebook Graph API is the primary way for apps to read and write to the Facebook social graph. SDK (Software Development Kits) [83] and products can interact with the graph API in some way, so understanding how the Graph API works is crucial. SDK is typically a set of software development tools that aid in creating applications for a certain software package, software framework, hardware platform, computer system, video game console, operating system, or similar development platform.
Fig. 2. Facebook Graph API explorer.
The main aim of data mining is to discover the properties of datasets. Data mining uses machine learning to do prediction analysis. There are two main types of machine learning algorithms.
Supervised learning.
Unsupervised learning.
C. Supervised Learning
In supervised learning, the prediction is made on the target attribute on analysing the given set of other attributes. The predicted attribute is the dependent attribute and others is independent attributes. The predictions are made on labelled data.
Example: Diabetes prediction
Here, the independent attributes are
Number of times pregnant
Plasma glucose concentration 2 hours in an oral glucose tolerance test
Diastolic blood pressure (mm Hg)
Triceps skin fold thickness (mm)
2-Hour serum insulin (mu U/ml)
Body mass index (weight in kg/(height in m)^2)
Diabetes pedigree function
Age (years)
In this case, the outcome is discrete, i.e., either positive or negative. In the case of stock prediction, the outcome will be of a continuous value. Now there comes another division in supervised learning where the algorithms that predict discrete values are called classification algorithms and those that predict continuous values are regression algorithms. But still in both the cases, the prediction is made on labelled data. An empirical study on some of the classification algorithms is explained in later sections.
D. Unsupervised Learning
This type of learning deals with unlabelled data. Unlike supervised learning, it doesn’t assign a class value for the test data instead it groups the data based on its features. There are many ways in which the data to form data can be grouped into clusters. An empirical study on some of the clustering algorithms is explained in later sections.
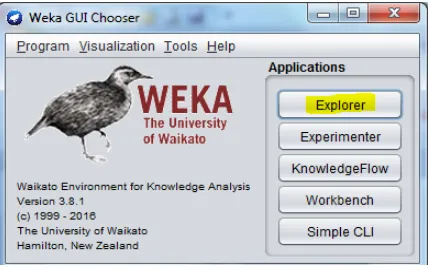
E. WEKA Tool
WEKA (Waikato Environment for Knowledge Analysis) is an open source data mining tool, developed by the University of Waikato in New Zealand that has all data mining algorithms implemented using Java. WEKA would not only provide a tool for learning algorithms, but also a framework inside which researchers could implement new algorithms without having to be concerned with supporting infrastructure for data manipulation and scheme evaluation. Nowadays, WEKA is recognized as a landmark system in data mining and machine learning.
WEKA is a collection of machine learning algorithms for data mining tasks. It contains tools for data pre-processing, classification, regression, clustering, association rules, and visualization. WEKA supports various algorithms for generating mining models required by researchers like clustering, classification etc. In classification, training examples can be used to train a model that can classify the data samples into known classes. WEKA has four different modes:
Simple CLI: It is an environment to provide a simple command-line interface that allows direct execution of
WEKA commands.
Explorer: It is an environment for exploring data.
Experimenter: It is an environment for performing experiments and conduction of statistical tests between
learning schemes
Knowledge Flow: Presents a “data-flow” inspired interface to WEKA
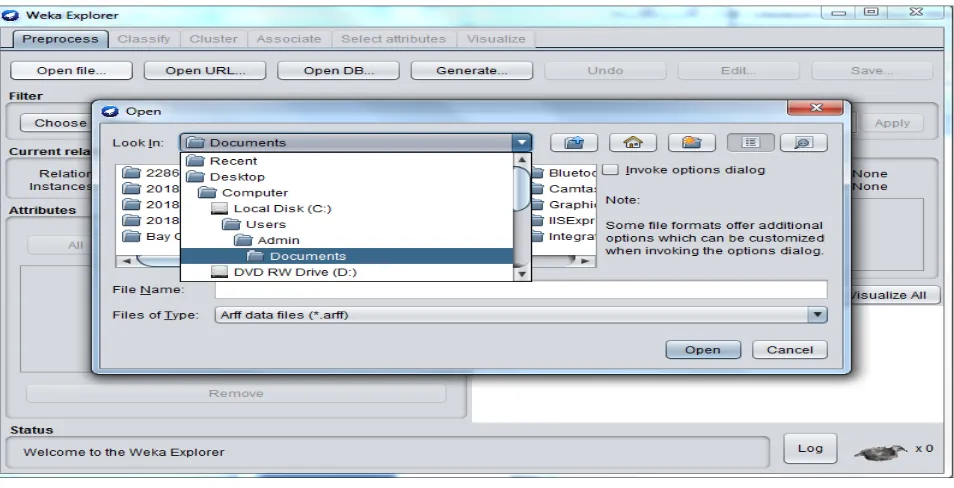
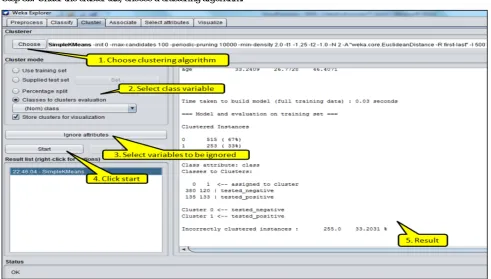
The main interface in WEKA is the explorer which has a set of panels, each of which can be used to perform a different task. Data can be loaded in WEKA from various sources, including files, URLs, and databases. Supported file formats include ARFF (Attribute-Relation File Format) format, CSV, and C4.5 format. Once a dataset has been loaded, one of the other panels in the explorer can be used. Steps to use WEKA for classification and clustering is shown below,
Step1: Launch WEKA explorer.
Step 2: Under the preprocess tab click the open file choose the dataset.
Fig. 4. Load dataset in WEKA.
Step 3a: Under classify tab, choose a classification algorithm.
Fig. 6. Knowledge flow of classifier in WEKA.
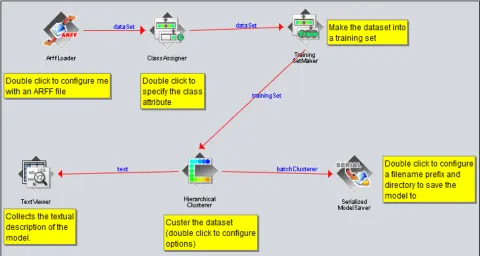
Step 3b: Under the cluster tab, choose a clustering algorithm.
Fig. 8. Knowledge flow of clustering in WEKA.
F. Performance Factors to Measure the Accuracy of a Machine Learning Algorithm
1) Confusion Matrix
Predicted YES Predicted NO
Actual YES TP FN
Actual NO FP TN
Note that,
True Positive (TP): When the prediction is YES, and the actual value is also YES.
True Negative (TN): When the prediction is NO, and the actual value is also NO.
False Positive (FP): When the prediction is YES, but the actual value is NO.
False Negative (FN): When the prediction is NO, but the actual value is YES.
2) Correctly Classified Instances: Out of the total instances, the number of instances whose predicted and actual class
values are equal, i.e., the sum of TN and TP.
3) Incorrectly Classified Instances: Out of the total instances, the number of instances whose predicted and actual
class values are different, i.e., the sum of FN and FP.
4) TP Rate: The rate of true positives.
5) FP Rate: The rate of false positives.
7) Recall: Gives what fraction of actually positive values is predicted positive.
8) F-Measure: Weighted average of precision and recall.
2 *
9) MCC (Matthews’s Correlation Coefficient): It is a factor to measure the quality of prediction, and its value ranges
from -1 to 1.
Note that,
-1 denotes total deviation from prediction and actual
1 denotes correct prediction.
10)ROC Area
ROC (Receiver Operating Characteristic) curve is a graph plot of true positive rate against false positive rate for each class label. Accuracy is measured by the area under the curve. Note that the area range and its implication are given below:
.90 to 1 = excellent (A)
.80 to .90 = good (B)
.70 to .80 = fair (C)
.60 to .70 = poor (D)
.50 to .60 = fail (F)
11)PRC Area
PRC (Precision-Recall Curve) is a graph plot of precision against recall for a class label. Accuracy is measured by the area under the curve. Note that the area range and its implication are given below:
.90 to 1 = excellent (A)
.80 to .90 = good (B)
.70 to .80 = fair (C)
.60 to .70 = poor (D)
.50 to .60 = fail (F)
12)Correlation Coefficient
Note that,
1 denotes a positive correlation. For a positive increase in one attribute, there is a positive increase in another attribute.
-1 denotes a negative correlation. For a positive increase in one attribute, there is a decrease in another attribute.
0 denotes no correlation.
G. Classification and Regression Algorithms
In this paper, we will mainly concentrate on the performance of machine learning algorithms in natural
language processing.
A brief research is made on the below-listed algorithms and each algorithm is explored through a case study.
Naive Bayes.
Decision trees.
Support vector machine.
K-nearest neighbors.
1) Naive Bayes Classifier
The Naive Bayes algorithm is a simple probabilistic classifier that uses Bayes theorem to calculate the probability for each instance by counting the frequency of values in a given dataset. It assumes all attributes i.e., features to be independent given the value of the class label and this makes it called as Naïve.
Bayes theorem
P (C|X) = P (X|C) * P(C) / P(X)
P (C|X) is the posterior probability of class given attribute.
P(C) is the prior probability of class.
P (X|C) is the likelihood which is the probability of attribute given class.
P(X) is the prior probability of attribute.
The Naive Bayes algorithm is mainly used in areas where the input is text or image. In the software industry, it can be used for spam detection, image recognition, text mining, and sentimental analysis [84][85][86].
Case Study: Complaint Category Identification
In any sector, incident management is essential. To process and resolve the complaints effectively, they have to be segregated and assigned to the concerned departments. From the complaints lodged by consumers, the product or service that is referred can be identified and assigned to the respective department for further analysis.
Training dataset: [87]
Number of instances: 88
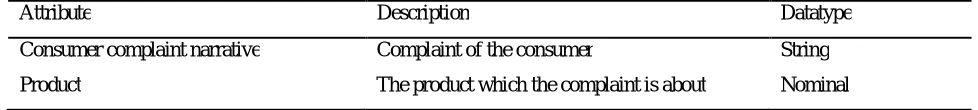
Table 1: List of attributes and its type.
Attribute Description Datatype
Consumer complaint narrative Complaint of the consumer String
Product The product which the complaint is about Nominal
Class Attribute: Product
Observations:
Let’s take a single instance of the attribute consumer complaint narrative and see how Naïve Bayes classifies and predicts which product the consumer is complaining about based on which it is assigned to the concerned department.
@data
‘The loan amount is incorrect it includes $260000 of fraudulent charges’,?
Text: “The loan amount is incorrect it includes $260000 of fraudulent charges”.
1. Calculate P(Consumer Loan | The loan amount is incorrect it includes $260000 of fraudulent charges)
P (Consumer Loan | Text) = P (Text | Consumer Loan) * P (Consumer Loan) / P (Text)
2. Calculate probability of all other class attributes.
Since P (Text) is the same for the case, it is discarded. In comparison, whichever probability is higher, that class value is assigned to the text for which the probability is higher. If P (Consumer Loan) is higher, that instance is classified as ‘Consumer Loan’ else as other class value will be assigned.
To calculate the P (Text), multiply the probability of each word. For example,
P(The loan amount is incorrect it includes $260000 of fraudulent charges) = P(The) * P(loan) * P(amount) * P(is) * P(incorrect) * P(it) * P(includes) * P($260000) * P(of) * P(fraudulent) * P(charges).
Note that the probability of each word is calculated by the number of occurrences of that word in the whole training data divided by the total number of words.
Fig.9. Naive Bayes classifier output.
3. From the occurrence of each word in the training data, the probability of each word is calculated and applied to Bayes
formula. Based on the probability of each class value, the class value with the highest probability is assigned to the test data.
4. Here, the probability of ‘Consumer loan’ is the highest, so the test data is assigned class value ‘Consumer loan’.
Fig. 10. Accuracy of the Naive Bayes classifier.
2) Decision Tree Classifier
Decision Tree algorithm builds a decision tree after analyzing the training instances. In the decision tree, the topmost node is the root node and the leaf nodes are the class values. In general, the nodes are attributes and the branches are decisions. While classifying the test instances using the constructed decision tree, it starts from the root node and traverses to leaf node based on the condition at each node and assigns a class value.
Decision tree algorithm gives better results in areas of research where data is more conditional. Some of its applications include intrusion detection [88], breast cancer detection [89], etc.
Case Study: CNC Machining Safety Detection
In this case study, a decision tree classifier is used to predict whether the CNC machining operation can be completed safely. Five attributes namely the workpiece material, feed rate, clamp pressure, tool condition and machining finalized are used in the decision tree classifier, which was taken from previous experiments conducted in the same CNC machine.
Training dataset: [90]
Number of instances: 18
Number of attributes: 5
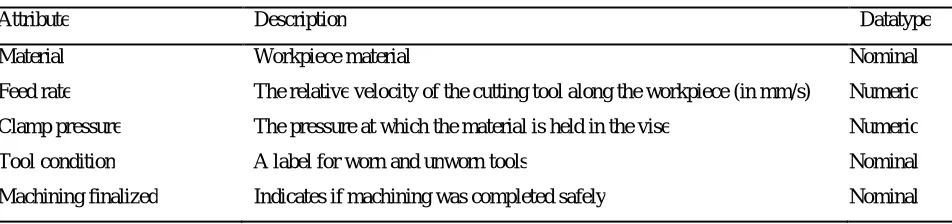
Table 2: List of attributes and its type.
Attribute Description Datatype
Material Workpiece material Nominal
Feed rate The relative velocity of the cutting tool along the workpiece (in mm/s) Numeric
Clamp pressure The pressure at which the material is held in the vise Numeric
Tool condition A label for worn and unworn tools Nominal
Machining finalized Indicates if machining was completed safely Nominal
Class Attribute: Machining finalized
Observations:
in conditionally classifying the test data. It checks all the attribute values of the test data and based on the values, it flows through the branches in the tree and finally end up in a class attribute value and assigns that class for the test data.
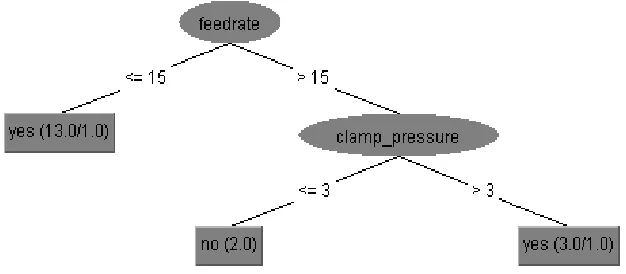
Fig. 11. Tree generated by decision tree classifier.
Let’s take a sample test data with the following values,
@data
wax,20,4,unworn,?
The decision tree algorithm starts classifying the test data from the root of the tree generated in Fig. 11. Since the value of feed rate is greater than 15 it goes to the right branch. Next, the value of clamp pressure is greater than 3, so it goes to the right branch. Now it reached the class attribute value ‘yes’. So, from the test data, it can be predicted that the machining can be completed safely.
Fig. 12. Decision tree classifier output.
3) Support Vector Machine Classifier
This algorithm plots each attribute’s value in n-dimensional space (n being the number of independent attributes). After plotting, a hyperplane is defined which divides the plotted data into required no of groups (no of classes). Depending on which part of the hyperplane the test data is, it is classified into that group. Support vector machine algorithms work well for cases with 2 class values. It divides the two class values with a hyperplane. The right hyperplane is chosen considering the key points such as,
1. The hyperplane should divide the two classes equally.
2. The hyperplane should be with the highest margin, where the margin is the distance between the hyperplane and the
nearest point.
Case Study: Mechanical Fitting Failure Detection
In this case study, a support vector machine classifier is used to analyze the historical data of fitting failures. The analyzed data can be used in risk assessment while planning new pipeline construction, and to identify the cause of fitting failures in existing pipelines.
Training dataset: [91]
Number of instances: 120
Number of attributes: 9
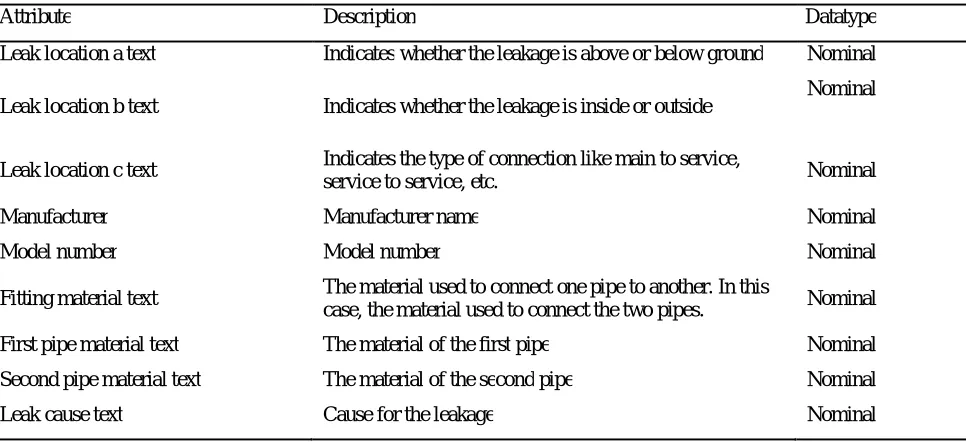
Table 3: List of attributes and its type.
Attribute Description Datatype
Leak location a text Indicates whether the leakage is above or below ground Nominal
Leak location b text Indicates whether the leakage is inside or outside Nominal
Leak location c text Indicates the type of connection like main to service,
service to service, etc. Nominal
Manufacturer Manufacturer name Nominal
Model number Model number Nominal
Fitting material text The material used to connect one pipe to another. In this
case, the material used to connect the two pipes. Nominal
First pipe material text The material of the first pipe Nominal
Second pipe material text The material of the second pipe Nominal
Leak cause text Cause for the leakage Nominal
Class Attribute: Leak cause text
Observations:
Let’s take a sample test data with the following values,
@data
Fig. 14. Support vector machine classifier output
1. From the classifier output, the cause of the leak is identified as ‘Natural Forces’.
Fig. 15. Accuracy of Support vector machine algorithm
4) K-Nearest Neighbors Classifier
This algorithm puts the k nearest neighbors to a data point in a class. The value of k is given by the user. The choice of k value is crucial for this algorithm. It calculates the Euclidean distance of a test data point to all other points and takes the top k least values and assigns them a class that appears frequent.
Case Study: Car Price Prediction
We can use a k-nearest neighbor algorithm to predict the cost of a car using its features as listed in the table below. Note that the term attributes can refer to the features of a product in the manufacturing industry.
Training dataset: [92]
Number of instances: 199
Number of features: 16
Table 4: List of attributes and its type.
Attributes Description Datatype
Make Car manufacturer Nominal
Fuel type Gas or diesel Nominal
Aspiration Turbo or standard Nominal
Number of doors Number of doors Nominal
Body style Generic shape of the car Nominal
Drive wheels Indicates the axles to which the engine power is transmitted through the
driveshaft Nominal
Wheel base The distance between the center of the front and rear wheels Numeric
Length The total length of the vehicle Numeric
Width The total width of the vehicle Numeric
Height The total height of the car Numeric
Curb weight The weight of the vehicle without occupant or baggage Numeric
Engine type Indicates whether the engine has single camshaft mechanism or dual
camshaft mechanism to operate the intake and exhaust valves Nominal
Number of cylinders Number of cylinders in the engine Nominal
Engine size Displacement in cubic inch Numeric
Price The market cost of the vehicle Numeric
Class Attribute: Price
Observations:
Let’s take a sample test data with the following values,
@data
audi,gas,turbo,two,convertible,rwd,front,88.6,168.8,64.1,48.8,2548,dohc,four,130,? honda,gas,turbo,four,sedan,fwd,front,99.8,176.6,66.2,54.3,2337,ohc,four,109,?
Fig. 16. K-nearest neighbor classifier output.
1. From the classifier output, the price of the Audi car is predicted to be $14997.5 and price of the Honda car is
predicted to be $8845.
2. So, this model can be used to compare the market values of n number of brands using n number of features and fix
Fig. 17. Accuracy of K-nearest neighbor classifier.
H. Clustering Algorithms
1) K-Means Clustering
This algorithm assigns k random centroids initially. Each data point is taken and associated with the nearest centroid. In each iteration, a new set of k centroids are assigned calculated from the barycentre of the previous set. The barycenter is calculated by the Euclidean distance of each data point to every other point. When it reaches a stage that no more change is required in centroids, the iteration is stopped, and the points are allocated to the nearest centroid. This type of algorithm is used when the number of clusters is known in the first place. In case if a Network company who wants to install k towers across the country each tower to be placed as far from each other and also consider the density of users in each area, this algorithm is the best choice.
Case Study: Healthcare Infrastructure Planning
Suppose the US government wants to establish cardiovascular facilities, Simple k-means can be used for identifying the optimal locations. When the heart disease mortality data with the location data is given to simple k-means, it assigns four centroids initially and iterates till four optimum locations are found.
Input dataset: Cardiovascular mortality rate from 2013-2016, Healthcare.gov – US government [93].
Number of clusters: 4
Number of attributes: 6
Table 5: List of attributes and its type.
Attribute Description Datatype
LocationAbbr US state Nominal
Data_Value Mortality rate Numeric
Data_Value_Type Age group Nominal
Stratification1 Gender Nominal
Stratification2 Race Nominal
Fig. 18. K-means clustering output.
Observations:
1. Based on the centroids, i.e., four identified locations, it assigns each data point (given location) to a cluster. So this
data can also be used to send the patients to the respective facilities in case of emergency.
2. On analyzing the cardiovascular mortality data from 2013 to 2016 using the k-means algorithm, we infer that
preference should be given for establishing cardiovascular facilities in Alabama, Arkansas, Colorado, and Georgia.
2) Hierarchical Clustering
On a set of N data items to be clustered, this algorithm assigns each data item to a cluster and finds the distance between each cluster. Then it merges the two closest clusters. Repeats till a single cluster is formed. This type of algorithm can be used in healthcare domain where it can be used to find the dissimilarities between the similarities. One such application is to find the sub-types of breast tumor in independent genes.
There are different ways to calculate the distance between each cluster, and they are listed below.
Single linkage: Distance between two clusters is the shortest distance between the points in the cluster.
Complete linkage: Distance between two clusters is the farthest distance between the points in the cluster.
Average linkage: Distance between two clusters is the average distance between the points in one cluster and
points in the other cluster [94].
Case Study: Emission Control and Management
In this case study, we have used the particulate emission data to cluster all the provinces and territories in Canada using a hierarchical clustering algorithm. The same approach can be used to cluster similar air zones and air sheds [95]. To efficiently manage the local air quality, Canadian Ambient Air Quality Standards (CAAQS) can be made specific to these air zones and airsheds.
Input dataset: Fine particulate matter emissions in tons per square kilometer [96].
Number of clusters: 2
Number of attributes: 5
Table 6: List of attributes and its type.
Attribute Description Datatype
Province or territory Canadian provinces Nominal
1990 (emissions in tones per sq. km) Emissions in tones per sq. km in 1990 Numeric
2015 (emissions in tones per sq. km) Emissions in tones per sq. km in 2015 Numeric
1990 excluding open sources (emissions in tonnes per sq. km)
Emissions in tones excluding open sources
per sq. km in 1990 Numeric
2015 excluding open sources (emissions in tonnes per sq. km)
Emissions in tones excluding open sources
per sq. km in 2015 excluding open sources Numeric
Observations:
1. The provinces of Newfoundland and Labrador, Nova Scotia, New Brunswick, Manitoba, Saskatchewan, Alberta,
British Columbia, Yukon, Northwest Territories and Nunavut have very less pollution per square kilometer and falls under cluster 0.
2. The provinces of Prince Edward Island, Quebec, and Ontario have the highest air pollution rate per square kilometer
and falls under cluster 1.
3) Farthest First Clustering
Farthest first clustering algorithm places each cluster center in at the point farthest from the existing cluster center in next iteration by calculating the Euclidean distance. When all the clusters points are far from each other, the algorithm stops and returns the center. In this algorithm also, the number of clusters can be configured.
Case Study: Distribution Channel Optimization
Suppose if a Canadian e-commerce company wants to build three warehouses for storing their imported goods from China, farthest first clustering algorithm can be used to identify the locations for the warehouses and optimize their distribution channels.
Input dataset: Major importers by country 2016, Canadian government open data portal [97].
Number of clusters: 3
Number of attributes: 5
Table 7: List of attributes and its type.
Attribute Description Datatype
Country China Nominal
Company-Enterprise Company address Nominal
City-Ville City Nominal
Province_Eng Province Nominal
Postal_Code-Code_Postal ZIP code Nominal
Observations:
1. Building the 3 warehouses at British Columbia, Quebec and Ontario would be optimal.
2. Note that the above analysis is for the understanding of readers, the locations may be changed based on the historical
data used. So accurate data for at least past ten years is recommended.
Fig. 22. Farthest First cluster assignments visualization.
IV.CONCLUSIONANDFUTUREWORK
In Summary, an attempt was made to classify and cluster all the surveys, proposed frameworks, comparisons of the efficiency of various classification algorithms in [41], [98], [107], [108], [99]–[106], and comparison of efficiency of various clustering algorithms in [12], [100], [109]–[111]. The design of better algorithms and knowledge representation schemes will be an important complement to the tremendous potential offered by emerging data mining technologies which can be used to develop a fully functional big data processing software.
In the end, a few promising and challenging research directions are summarized for future development of big data process models.
(1)There is a need for focusing on challenges like how to reduce the time, memory, i.e., size, and dimensionality of the
data without affecting the characters of the social networks, i.e., only data that is required to represent the context must be extracted [30].
(2)Integration of conventional engineering tools and techniques with the aforementioned knowledge-based applications.
(3)Internet of Things which can aid in achieving the objectives of Industry 4.0 [112], where all data should be
(4)We can collect large customer-generated data including videos and images for analyzing the customer’s experience and graphs can be used to visualize both positive and negative experience results on a timely basis. To some degree, the final results from data visualization may be the things that decision makers care most rather than the original data. Thus, proposing appropriate data visualization tools can add great value.
(5)We can develop a predictive model that can analyze multilingual texts, i.e., reviews that are given by customers in
their native language other than English.
V. ACKNOWLEDGEMENT
The authors would like to acknowledge the financial support: MITACS Accelerate grant (IT09867, PI: Yongsheng Ma) and NSERC Discovery grant (NSERC RGPIN 5641 Ma, PI: Yongsheng Ma). All the research works were carried out at the University of Alberta.
REFERENCES
1. F. Remondino and T. Chen, “35 Years of Internet, 10 Years of ISPRS Online”, International Society for Photogrammetry and Remote Sensing, Vol. 9, Issue No. 4, pp. 23–38, 2004.
2. D. B. Malkoff, “A framework for real-time fault detection and diagnosis using temporal data”, Artificial Intelligence Eng., Vol. 2, Issue No. 2, pp. 97–111, Apr. 1987.
3. C. V. Ramamoorthy and B. W. Wah, “Knowledge and data engineering”, IEEE Transactions on Knowledge and Data Engineering, Vol. 1, Issue No. March, pp. 9–16, Mar. 1989.
4. J. Kaplan, “Artificial intelligence”, ACM, Vol. 60, Issue No. 1, pp. 36–38, 2016.
5. N. Hemageetha and G. M. Nasira, “Classification of Soil type in Salem district using J48 algorithm”, International Journal of Control Theory and Applications, Vol. 9, Issue No. 40, pp. 33–41, 2016.
6. A. Ajinkya, A. Londhe, R.S. Jamgekar, and R. Solunke, “Analyzing Student’ S Learning Experiences Through”, International Journal of Advances in Electronics and Computer Science, Vol. 3, Issue No. 12, 2016.
7. F. Alam and S. Pachauri, “Comparative Study of J48, Naive Bayes and One-R Classification Technique for Credit Card Fraud Detection using WEKA”, Adv. Comput. Sci. Technol., Vol. 10, Issue No. 6, pp. 1731–1743, 2017.
8. L. Dey and S. M. Haque, “Opinion mining from noisy text data”, International Journal on Document Analysis and Recognition, Vol. 12, Issue No. 3, pp. 205–226, 2009.
9. S. Lohr, “Economics in the age of big data”, The New York Times, 2014.
10. D. Kajaree and R. Behera, “A Survey on Web Crawler Approaches”, International Journal of Innovative Research in Computer and Communication Engineering, Vol. 5, Issue No. 2, pp. 1302–1309, 2017.
11. D. Laney, “What makes lecturers in higher education use emerging technologies in their teaching?” Application Delivery Strategies, 2001. 12. E. Raju and K. Sravanthi, “Analysis of Social Networks Using the Techniques of Web Mining”, Computers in Industry, Vol. 3, Issue No.
2, pp. 64–78, 2017.
13. B. Marr, “Big Data Sources - https://www.smartdatacollective.com/big-data-20-free-big-data-sources-everyone-should-know/”, 2014. 14. Facebook Graph API, https://developers.facebook.com/docs/graph-api, 2018.
15. UK Government, https://data.gov.uk/, 2018.
16. CIA, https://www.cia.gov/library/publications/the-world-factbook/, 2018. 17. US Government Portal, http://data.gov/, 2018.
18. Google Trends, http://www.google.com/trends/explore, 2018.
19. National Climatic Data Center, Http://Www.Ncdc.Noaa.Gov/Data-Access/Quick-Links#Loc-Clim, 2018.
20. Likebutton, https://domainnamesales.com/domain/likebutton.com?landerid=likebutton5b1ae07b27daa2.01205237, 2018. 21. J. Constine, “Facebook now has 2 billion monthly users...and responsibility”, TechCrunch, 2017.
22. D. Zeng, H. Chen, R. Lusch, and S. H. Li, “Social media analytics and intelligence”, IEEE Intelligent Systems, Vol. 25, Issue No. 6, pp. 13–16, 2010.
23. J. Kim, S. Cho, D. Park, K. Lee, C. Choi, and W. Cho, “Local Festival Marketing and Application Plan for Agricultural Products by Utilizing Big Data from Online Shopping Mall”, Proceedings of the 2015 International Conference on Big Data Applications and Services - BigDAS '15, pp. 233–236, 2015.
24. M. Yang and S. Hu, “Research on the E-business platform of agricultural products and rice marketing channel based on network big data”, Revista Tecnica de la Facultad de Ingenieria Universidad del Zulia, Vol. 39, Issue No. 12, pp. 258–265, 2016.
25. I. Kuzminov, P. Bakhtin, and A. Lavrynenko, “Big-data-augmented approach to emerging technologies identification: Case of agriculture and food sector”, CEUR Workshop Proceedings, Vol. 1886, pp. 130–134, 2016.
26. S. S. Gill, I. Chana, and R. Buyya, “IoT Based Agriculture as a Cloud and Big Data Service”, Journal of Organizational and End User Computing, Vol. 29, Issue No. 4, pp. 1–23, 2017.
28. Y. Liu, “Innovation of E-commerce Fresh Agricultural Products Marketing Based on Big Internet Data Platform”, Agro Food Industry Hi-Tech, Vol. 28, Issue No. 3, pp. 1739–1743, 2017.
29. G. M. Alves and P. E. Cruvinel, “Big Data Environment for Agricultural Soil Analysis from CT Digital Images”, Proceedings - 2016 IEEE 10th International Conference on Semantic Computing, ICSC 2016, Issue No. 9, pp. 429–431, 2016.
30. K. Sabarina and N. Priya, “Lowering data dimensionality in big data for the benefit of precision agriculture”, Procedia Computer Science, Vol. 48, Issue No. C, pp. 548–554, 2015.
31. F. Hao, X. Luo, and C. Mu, “Research on Key Technologies of Intelligent Agriculture Based on Agricultural Big Data”, Proceedings - 2016 International Conference on Smart City and Systems Engineering, ICSCSE 2016, pp. 598–601, 2016.
32. A. Abraham, K. Franke, and M. Köppen, “Intelligent systems design and applications”, 17th International Conference on Intelligent Systems Design and Applications (ISDA 2017) Held in Delhi, India, December 14–16, Vol. 736, Issue No. 1, 2017.
33. M. R. Bendre, R. C. Thool, and V. R. Thool, “Big data in precision agriculture: Weather forecasting for future farming”, Proceedings on 2015 1st International Conference on Next Generation Computing Technologies, NGCT 2015, Vol. 4, Issue No. 9, pp. 744–750, 2016. 34. N. Rao, “Big Data and Climate Smart Agriculture - Review of Current Status and Implications for Agricultural Research and Innovation
in India”, Proceedings of the Indian National Science Academy, Vol. 3, Issue No. 9, pp. 744–750, 2018.
35. Y. Fei, “Innovative Strategies of Agricultural Product Network Marketing under the Background of E-commerce”, 2017.
36. A. Kamilaris, A. Kartakoullis, and F. X. Prenafeta-Boldú, “A review on the practice of big data analysis in agriculture”, Computers and Electronics in Agriculture, Vol. 143, Issue No. January, pp. 23–37, 2017.
37. N. Xie, W. Wang, B. Ma, X. Zhang, W. Sun, and F. Guo, “Research on an Agricultural Knowledge Fusion Method for Big Data”, Data Science Journal, Vol. 14, Issue No. 7, pp. 1–9, 2015.
38. P. Liu, G. Dai, and T. Fu, “A web services-based email extension for remote monitoring of embedded systems”, Proceedings - SNPD 2007: Eighth ACIS International Conference on Software Engineering, Artificial Intelligence, Networking, and Parallel/Distributed Computing, Vol. 2, pp. 412–416, 2007.
39. J. Zhan, C. L. Hsieh, I. C. Wang, T. S. Hsu, C. J. Liau, and D. W. Wang, “Privacy-preserving collaborative recommender systems”, IEEE Transactions on Systems, Man and Cybernetics Part C: Applications and Reviews, Vol. 40, Issue No. 4, pp. 472–476, 2010.
40. T. Bogers and A. Van Den Bosch, “Collaborative and content-based filtering for item recommendation on social bookmarking websites”, CEUR Workshop Proceedings, Vol. 532, Issue No. 2, pp. 9–16, 2009.
41. T. Bhuvaneswari, S. Prabaharan, and V. Subramaniyaswamy, “An effective prediction analysis using J48”, ARPN J. Eng. Appl. Sci., Vol. 10, Issue No. 8, pp. 3474–3480, 2015.
42. W. Hengliang and Z. Weiwei, “A customer churn analysis model in e-business environment”, International J. Digit. Content Technol. its Appl., Vol. 6, Issue No. 9, pp. 296–302, 2012.
43. M. S. Vyas and R. Gulwani, “Predictive analytics for E learning system”, 2017 International Conf. Inven. Syst. Control, pp. 1–4, 2017. 44. US Healthcare data, “https://www.healthdata.gov/,” 2018.
45. A. V. Solanki, “Data Mining Techniques Using WEKA classification for Sickle Cell Disease”, International J. Comput. Sci. Inf. Technol., Vol. 5, Issue No. 4, pp. 5857–5860, 2014.
46. S. Y. Wani, M. M. Kirmani, and S. I. Ansarulla, “Prediction of Fake Profiles on Facebook using Supervised Machine Learning Techniques-A Theoretical Model”, Int. J. Comput. Sci. Inf. Technol., Vol. 7 (4), Issue No. August 2016.
47. M. M. Rahman, “Mining Social Data to Extract Intellectual Knowledge”, Int. J. Intell. Syst. Appl., Vol. 4, pp. 15–24, 2012.
48. S. Pippal, L. Batra, A. Krishna, H. Gupta, and K. Arora, “Data mining in social networking sites: A social media mining approach to generate effective business strategies”, Int. J. Innov. Adv. Comput. Sci., Vol. 3, Issue No. 2, pp. 22–27, 2014.
49. W. J. Xu, “Strategy study on China E-business service in big data era”, 2013 Int. Forum Mater. Sci. Ind. Technol. IFMSIT 2013, Vol. 798, pp. 983–986, 2013.
50. Y. Ma and J. Y. H. Fuh, “Product lifecycle modelling, analysis and management”, Computers in Industry, Vol. 59, Issue No. 2–3, pp. 107–109, Mar. 2008.
51. J. Li, F. Tao, Y. Cheng, and L. Zhao, “Big Data in product lifecycle management”, International Journal of Advanced Manufacturing Technology, Vol. 81, Issue No. 1–4, pp. 667–684, 2015.
52. F. Gu, B. Ma, J. Guo, P. A. Summers, and P. Hall, “Internet of things and Big Data as potential solutions to the problems in waste electrical and electronic equipment management: An exploratory study”, Waste Management, Vol. 68, pp. 434–448, 2017.
53. T. H. Clark and H. G. Lee, “Performance, interdependence and coordination in business-to-business electronic commerce and supply chain management”, Information Technology and Management, Vol. 1, pp. 85–105, 2000.
54. J. T. Mentzer et al., “Defining Supply Chain Management”, Journal of Business. Logistics, Vol. 22, Issue No. 2, pp. 1–25, 2001. 55. D. J. Flint, E. Larsson, and B. Gammelgaard, “Exploring Processes for Customer Value Insights, Supply Chain Learning and Innovation:
An International Study”, Journal of Business. Logistics, Vol. 29, Issue No. 1, pp. 257–281, 2008.
56. M. Grean and M. J. Shaw, “Supply-Chain Partnership between P& G and Wal-Mart,” E-business Management, pp. 155–171, 2000. 57. E. Hofmann, “Big data and supply chain decisions: the impact of volume, variety and velocity properties on the bullwhip effect”, Int. J.
Prod. Res., Vol. 55, Issue No. 17, pp. 5108–5126, 2017.
58. S. Tiwari, H. M. Wee, and Y. Daryanto, “Big data analytics in supply chain management between 2010 and 2016: Insights to industries,” Comput. Ind. Eng., Vol. 115, Issue No. 10, pp. 319–330, 2018.
59. D. Frederick Ross, “Competing Through Supply Chain Management”, Springer, pp. 193–246, 1988.
60. E. O. Makori, “Promoting innovation and application of internet of things in academic and research information organizations”, Library Review, Vol. 66, Issue No. 8–9, pp. 655–678, 2017.