Effect of Dispersion of Seismic Load on Integrity of Nuclear Power Plant Piping
Hideo MACHIDA1) 1) Toden Software, Inc. ABSTRACT
Studies on probabilistic fracture mechanics, PFM, have been performed for a quantitative integrity assessment of pipes, which are used in nuclear power plants. In the case without the seismic load, the break probability is mainly dominated by an initial crack size. The earthquake has much effect on the break probability for the large diameter pipe, not for the small diameter pipe. In the large diameter pipe, the break probability increases gradually with the passage of time. In this case, the effect of dispersion of the seismic stress is larger than that of the ground acceleration. The probabilistic density function of the seismic stress, therefore, is an important factor in this evaluation. The crack growth rate has much effect on the leak probability, not on the break probability. The membrane-bending stress ratio of the crack growth load is much effective on the break probability. If the upper limit of the seismic load is not considered in the PFM analysis, the failure probability is almost equal to the probability that the seismic stress is over than flow stress of the pipe, and the effect of the crack on the break probability is negligible. Applying the upper limit of the seismic stress, therefore, is necessary for the PFM analysis. 1. INTRODUCTION
Design and structural integrity evaluation of the components of a nuclear power plant are usually performed using a deterministic evaluation method. In this evaluation, the result usually includes excessive margin, because safety factor is taken into account for every evaluation process, and it causes increase of plant construction cost. A probabilistic evaluation method is one of the candidates to reduce the excessive margin. In the probabilistic structural integrity evaluation, the failure probability is calculated using mathematical models, which include dominant factors concerning with the failure behavior. The structural integrity is assessed by this failure probability for its limitation. As the safety margin is considered only in this limitation, the probabilistic evaluation gives rational result compared with the deterministic way. The fracture mechanics, in which the probabilistic technique is applied, is called Probabilistic Fracture Mechanics, PFM. The study on the PFM started from the middle of the 1970’s for applying to the assessment of structural reliability of an aircraft or a pressurized vessel of a nuclear power plant [1,2,3,4]. Nowadays, the PFM takes an important part in safety design of the nuclear power plant, reliability assessment of the aircraft and so on. In the PFM analysis, the crack size, material strength, crack growth rate, etc. are expressed using probabilistic models, and leak and break probabilities are calculated. Generally, the loads, which cause break of pipe, are mainly internal pressure, dead weight, thermal expansion and seismic load. The seismic load is one of the dominant loads in the failure assessment, because its dispersion is very large.
2. ANALYTICAL CONDITION
Inelastic PFM analysis code, PEPPER, is applied to this study. PEPPER is developed by Toden Software, Inc. (TSI). It employs Stratified Monte Carlo Simulation for sampling of the initial crack size and Monte Carlo Simulation with Importance Sampling for the seismic load to reduce calculation time. It can evaluate fatigue and creep-fatigue crack growth behavior using inelastic fracture mechanics parameters—fatigue J-integral and creep J-integral—calculated using reference stress method [5].
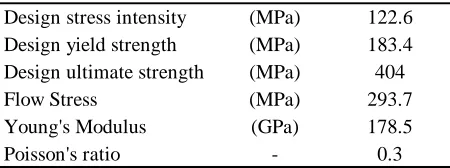
Main steam pipes of Japanese BWR have been chosen in this study. These are carbon steel pipes, STS410 in JIS Standard. Dimensions of the pipes are shown in Table 1. Material properties of the pipe at 573K are shown in Table 2. An
Table 1 Analyzed pipe dimension Table 2 Material constant of pipe at 573K
Pipe 4B 16B 26B
Diameter (mm) 114.3 406.4 660.4
Thickness (mm) 11.1 26.2 33.3
Radius/Thickness 5.1 7.8 9.9
Design stress intensity (MPa) 122.6 Design yield strength (MPa) 183.4 Design ultimate strength (MPa) 404
Flow Stress (MPa) 293.7
Young's Modulus (GPa) 178.5
Poisson's ratio - 0.3
SMiRT 16, Washington DC, August 2001 Paper # 1116
Initial crack is postulated as a circumferential semi-elliptical crack at the inside of the pipe. A depth of the initial crack is expressed by the exponential distribution [2]:
(
)
exp 6.25 ( ) 6.25 a f a −= [a:mm] (1)
where a is the depth of the crack. An initial aspect ratio is the expressed by the lognormal distribution [6]:
( )
21.336 ln
1.419 1
( ) exp
2 0.5382 0.5382 2 f β β β π é ì ü ù ï ï ê í ý ú ê ú = ê− ï ï ú î þ ë û (2) 1 c a β = >
where β is the aspect ratio and c is length of the initial crack.
Crack growth loads are summarized in Table 3. These loads have been estimated referring the design loads of the BWR plants [7], and the large seismic load is not considered in them. These loads are applied to the crack growth analysis, not for the crack stability assessment. The fracture mechanics parameter used in the crack growth analysis is stress intensity factor range (∆K), which was proposed by Raju and Newman [8]. Crack growth rate is calculated based on the following Paris’s low [9]:
13 5.95
9 1.95
( / ) 1.738 10 ( 13.2 )
( / ) 5.325 10 ( 13.2 )
da m cycle K K MPa m
dn
da m cycle K K MPa m
dn
−
−
ü
= × ∆ ∆ < ï
ý ï
= × ∆ ∆ ≥ þ (3)
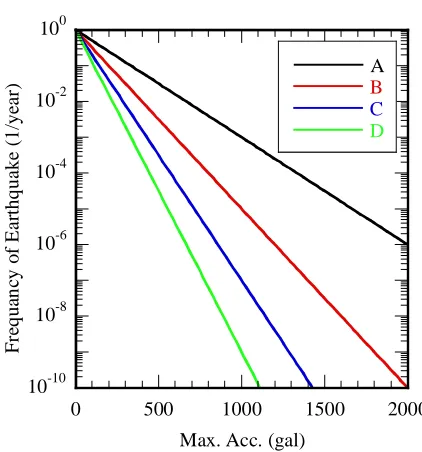
When the crack depth is over 80% of the pipe thickness, the crack is judged as a penetrated crack. For the penetrated crack, the crack growth analysis is not performed. If the penetrated crack is stable, its failure mode is judged as ‘LEAK’, and if it is unstable, its failure mode is judged as ‘BREAK’. Loads for crack stability assessment except the seismic load are shown in Table 4. Membrane stress caused by internal pressure and bending stress caused by thermal expansion are applied to the crack stability assessment. The seismic load is only applied to the crack stability assessment. The dispersion of the seismic load can be classified roughly to two parts. One is the dispersion of amplitude and frequency characteristics of ground acceleration acting to the nuclear power plant building. These dispersions are estimated using seismic hazard curves shown in Fig. 1. The ground acceleration of S2 earthquake is postulated as 400gal in this study. Accordingly, the seismic stress for arbitrary ground acceleration is given by:
400
M D
S = α S (4)
Table 3 Loading Conditions for Crack Growth Analysis
Min. Max. Min. Max.
1 7 0 122.6 0 0
2 18 49 183.9 0 0
3 320 92 122.6 0 0
4 8 0 0 -122.6 122.6
5 16 0 0 -61.3 61.3
6 330 0 0 -12.3 12.3
Frequency (cycles/year) Load
No.
σm (MPa) σb (MPa)
σm: Membrane Stress σb: Bending Stress
Table 4 Crack stability assessment loads w/o seismic load
4B 16B 26B
Membrane Stress 61.3 61.3 61.3 Bending Stress (M/Z) 150.8 109.4 91.1
Stress (MPa) 10-10 10-8 10-6 10-4 10-2 100
0 500 1000 1500 2000
A B C D F re q u anc y o f E ar th q u ak e ( 1 /y ea r)
where SM is the seismic stress at the arbitrary ground acceleration (α gal), SD is the seismic stress calculated by deterministic
way at 400 gal of the ground acceleration.
The net-section criterion adopting G-factor [7], which is a modification factor considering an effect of tearing instability, is applied to the crack stability assessment. The crack stability assessment is performed before crack penetration assessment. The critical moment, Mcr, is given by:
0
cr M
M
G
= (5)
where M0 is the critical moment calculated using the net-section criterion [10].
Pre-service inspection, PSI, is considered in the analyses. Non-detection probability of the PSI, PND, is given by [6]:
* 2
ln( / )
0 1(1 ) 1 2 2
V A A t
ND
P ε e dt ε
π −
ì ü
= − í − ý+
î
ò
þ (6)(2 )
2
(2 )
4
B
B B
ac c D
A
aD c D
π
π
ì ≤
ï =í
ï >
î
* *
4 B
A =π a D
*
0.005, DB 25.4mm, V 1.33, a 6.35mm
ε= = = =
3. MODELING OF SEISMIC LOADING 3.1 Break Probability Due To Earthquake
Except for faulted condition, the nuclear power plant will be operated continuously. The break probability in the PFM analysis, therefore, is calculated as a cumulative value. On the other hand, if the large earthquake such as S2 earthquake (categorized in the faulted condition) occurs, the plant will be stopped its operation. Consequently, the cumulative break probability for the case of earthquake is inappropriate. In this study, the break probability caused by the seismic load is calculated under the condition that the earthquake never occurs until the evaluation time. The break probability at n year (Pb(n)) is given by:
0
( ) ( ) ( )
n
b b n b e
i
P n P− i P− n
=
=
å
+ (7)where Pb-n(i) is the break probability caused by the load except the seismic load at i year and Pb-e(n) is that caused by the
earthquake at n year. Calculation for a broken sample by the seismic load is not stopped until it is broken by the load except the seismic load or it penetrates the pipe wall.
3.2 Sampling of Seismic Load
In the PFM analysis without the seismic load, a dominant parameter for break or leak probability is crack size— depth and aspect ratio. Therefore, the Stratified Monte Carlo Simulation, which is the one of the techniques to reduce the calculation time and to obtain the reliable results, is employed for sampling of the initial crack size. On the other hand, for the case with seismic load, the failure probability is dominated by dispersion of the seismic stress, too. If the seismic stress closes to the flow stress, the pipe will be broken even if the crack is small. However, a frequency of such a large earthquake is quite low. Therefore, the break probability calculated using the conventional PFM analysis method, in which Stratified Monte Carlo Simulation is employed for sampling of the initial crack size, gives deference probabilities according as existing probability of the crack is high or low. Increasing the number of sample is one of the ways to solve this problem, but it derives increase of the calculation time. To deal with this problem, PEPPER employs Monte Carlo Simulation with Importance Sampling for the seismic load. The earthquake occurs every year irrespective of the frequency of it, and the break probability of the sample (Pf) is calculated using an existing probability of the sample (Ps) and frequency of the earthquake (fe).
Pf =Ps× fe (8)
3.3 Dispersion of Seismic Stress
Dispersion of seismic stress of the pipe is caused by uncertainty of a seismic analysis model, material properties, etc. of the building and piping. Referring past study on a seismic response of components in the nuclear power building [11], the dispersion of the seismic stress of the pipe is expressed using lognormal distribution:
ln( )
1 1
( ) exp
2 0.95 0.95 2
EQ EQ
EQ
S f S
S
µ π
é ì üù
= ê− í ýú
ê î þú
ë û (9)
3.92
M M
S S
RF
µ= =
where SEQ is the seismic stress of the pipe, SM is the seismic stress calculated by the deterministic method (Eq. (4)), RF is
response factor for the pipe proposed by Ebisawa et al. [11] and µ is median of the seismic stress shown in Table 5. 3.4 Upper Limit of Seismic Load
The seismic stress given by Eq. (9) has high probability of the large seismic stress. If the pipe is subjected to the stress which exceeds the collapse stress, it will be broken irrespective of the crack size. In this case, the break probability is given by:
ln( )
1 1
( ) exp
2 0.95
0.95 2
C
EQ
EQ EQ
EQ S
S
F S dS
S
µ π
∞
é ì üù
= ê− í ýú
ê î þú
ë û
ó ô ô
õ (10)
where SC is collapse stress of the pipe without the crack. This probability is larger than that caused by the loads except the
earthquake. Consequently, the break probability calculated using such a high stress condition is not conditional probability (1/crack) aimed by PFM analysis, and it should be considered in the seismic PSA. In this PFM study, the following two
Table 5 Median of seismic stress
Pipe Size 4B 16B 26B
Deterministic Stress (MPa) 125.7 91.2 75.9
Median of SEQ (MPa) 32.1 23.3 19.4
10-8 10-7 10-6 10-5 10-4 10-3
0 10 20 30 40 50 60 70 80
Conventional Method
Proposed Method
C
o
n
d
itio
n
al B
re
ak
Pr
o
b
a
b
ility
(
1
/cr
ac
k
)
Operation Year
conditions for the seismic stress are applied.
1) The seismic stress is not exceeding the collapse stress of the pipe.
2) Upper limit of the dispersion of the seismic stress is 99% Lowest Confidence Limit, 99%LCL 4. RESULT OF ANALYSIS
Based on the aforementioned analytical conditions, parametric analyses have been performed. The analytical cases are summarized in Table 6.
4.1 Effect of Seismic Load
Figure 3 shows the break probabilities for the cases with and without the seismic load (Case 1-6). Once of earthquake in the evaluation plant life (80 years), which is defined by Eq. (9), is considered in the case with the seismic load. In 26B pipe, the break probability caused by the loads except the seismic load is very low, and the effect of the earthquake is large on it. In 4B pipe, the effect of seismic load on the break probability is negligible. The break probability caused only by the earthquake is shown in Fig. 4. The break probability increases with decrease of the pipe diameter, but the break probability of 4B pipe is two orders smaller than that caused by the loads except the earthquake.
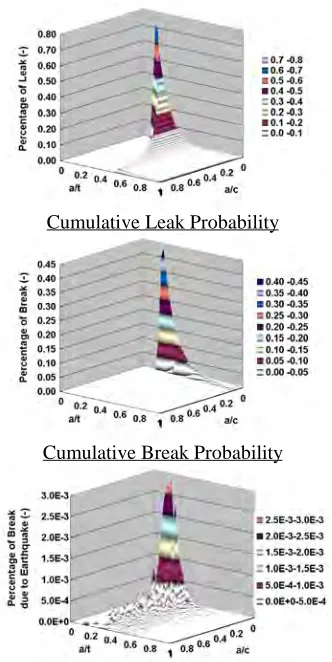
The failure maps based on the initial crack size are shown in Fig. 5 and Fig. 6. The vertical axis shows the percentage of the break samples in the cell, and existing probability of the cells are not considered in it. The break probability caused by the seismic load is the value at 80 year. Many samples are broken in the cells of small a/c, namely, the cells of long cracks. Comparing between 26B and 4B pipe, the break and leak areas of 4B pipe are larger than that of 26B pipe, because of small r/t and thin wall. Since the existing probability of the crack decreases due to PSI, the percentage of break and leakage decrease in the deep crack cells. This tendency is strong in 26B pipe, because the crack detection probability is dominated by the crack size as shown in Eq. (6) and the absolute crack size of 26B pipe is larger than 4B pipe. The deep initial crack penetrates in the early operation time. Thus, the number of sample broken by seismic load is not much in the deep crack area. In the 4B pipe, the samples broken by the earthquake concentrates around the boundary between leak and sound cells. This tendency shows that the resistance of the crack decreases due to growth and the crack is broken by the seismic load. In the 26B pipe, the broken samples appear in shallow area compared with 4B pipe. The broken cells are at intervals; it shows that the break is resulted from not only crack size but also rarely large seismic stress.
Table 6 Analytical conditions
Case Pipe Size
Frequency of Earthquake
Scope of Frequency of Earthquake
a/t Jagged as
Penetration Crack Growth Rate Crack Growth Load
1 4B None - 0.8 Eq.(3) Table 3
2 16B None - 0.8 Eq.(3) Table 3
3 26B None - 0.8 Eq.(3) Table 3
4 4B 400gal, 1/80 year - 0.8 Eq.(3) Table 3
5 16B 400gal, 1/80 year - 0.8 Eq.(3) Table 3
6 26B 400gal, 1/80 year - 0.8 Eq.(3) Table 3
7 26B Hazard-A ≥10-10/year 0.8 Eq.(3) Table 3
8 26B Hazard-B ≥10-10/year 0.8 Eq.(3) Table 3
9 26B Hazard-C ≥10-10/year 0.8 Eq.(3) Table 3
10 26B Hazard-D ≥10-10/year 0.8 Eq.(3) Table 3
11 26B Hazard-B ≥≥≥≥10-1/year 0.8 Eq.(3) Table 3
12 26B Hazard-B ≥≥≥≥10-3/year 0.8 Eq.(3) Table 3
13 26B Hazard-B ≥≥≥≥10-5/year 0.8 Eq.(3) Table 3
14 26B Hazard-B ≥≥≥≥10-7/year 0.8 Eq.(3) Table 3
15 4B Hazard-B ≥10-10/year 1.0 Eq.(3) Table 3
16 26B Hazard-B ≥10-10/year 1.0 Eq.(3) Table 3
17 4B Hazard-B ≥10-10/year 0.8 10 times of Eq.(3) Table 3
18 26B Hazard-B ≥10-10/year 0.8 10 times of Eq.(3) Table 3
19 4B Hazard-B ≥10-10/year 0.8 Eq.(3) σσσσb=±50MPa/hour
.
10-8 10-7 10-6 10-5 10-4 10-3 10-2
0 10 20 30 40 50 60 70 80
4B w. EQ.
16B w. EQ.
26B w. EQ.
4B w/o EQ.
16B w/o EQ.
26B w/o EQ.
Condi
tio
nal Br
e
ak
Pr
ob
a
b
ility
(
1
/c
ra
c
k
)
Operation Year
Frequency of Earthquake(EQ.) =1/80year
Fig. 3 Effect of earthquake on break probability
10-8 10-7 10-6 10-5 10-4
0 10 20 30 40 50 60 70 80
4B 16B
26B
C
o
n
d
itio
n
al B
re
ak
Pr
o
b
a
b
ility
(
1
/cr
ac
k
)
Operation Year
Fig. 4 Break probability due to seismic load
Cumulative Leak Probability Cumulative Leak Probability
Cumulative Break Probability Cumulative Break Probability
Break Probability Due to Seismic Load Break Probability Due to Seismic Load
4.2 Effect of Principal Parameters
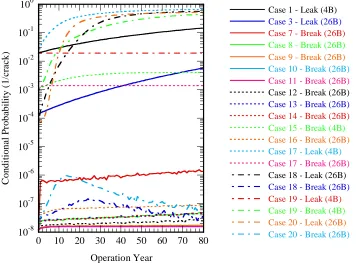
To evaluate the effects of principal parameters (shown in Table 6) on the failure characteristics, parametric analyses have been performed. The parameters assessed in this study are magnitude and an effective region of seismic hazard curves, crack penetration depth, crack growth rate, and membrane-bending stress ratio in the crack growth analysis. The results are summarized in Fig. 7.
The seismic hazard curve is dominated by geographical condition and is particular to each power plant. The parametric analyses (Case 7-10) using four curves shown in Fig. 1 are performed to clarify the effect of them on the break probability. The break probability is not affected by the small seismic hazard curves such as Hazard-C or Hazard-D. In these cases, the failure characteristic is dominated by the crack size and the loads except the earthquake. On the other hand, in the case of large hazard curve such as Hazard-A, the seismic load is much effective on the break probability. For the PFM analysis subjected to the actual power plants, the evaluation of the seismic hazard curve is an important matter.
The seismic hazard curve applied to the seismic PSA has wide range of ground acceleration. However, it is not necessary to take the low frequency of earthquake into account in the PFM analysis, because the break probability caused by the loads except the seismic load are relatively high and the effect of the rare large earthquake is negligible in the break probability. The parametric analyses (Case 11-14) subjected to the effective region of the seismic hazard curve have been performed aiming at the efficient calculation. If the frequency is lower than 10-5/year, the earthquake is not effective on the break probability. For the PFM analysis, the effective range of the seismic hazard curve is from up 10-5/year in the frequency of earthquake.
For the case considering seismic load, the break probability increases with the passage of time, because of decrease of a ligament due to crack growth. When the crack depth is over 80% of the pipe thickness, the crack is judged as the penetrated crack (a/tpene=0.8) in the aforementioned analyses. To clarify the effect of the penetrated crack depth, the analyses (Case 15 and 16)—the penetrated crack depth is assumed as equal to the pipe thickness (a/tpene=1.0)—have been performed. In the case of a/tpene=1.0, the break probability is around 4 times higher than the case of a/tpene=0.8. For the pessimistic assessment, the penetrated crack depth has to be defined as a/tpene=1.0.
The loads for crack growth assessment are quoted from the loading conditions applied to the plant design [7]. The parametric analyses (Case 17 and 18) have been performed to clarify the effect of crack growth rate on the failure probability. The leak probability increases with higher crack growth rate, but the break probability is not affected by it. The leak probability is dominated by the crack depth. Thus, it increases with higher crack growth rate. On the other hand, the break probability is dominated by the aspect ratio (a/c), not the crack depth (a/t). Consequently, the crack growth rate is not much effective on the break probability.
10-8 10-7 10-6 10-5 10-4 10-3 10-2 10-1 100
0 10 20 30 40 50 60 70 80
Case 1 - Leak (4B)
Case 3 - Leak (26B)
Case 7 - Break (26B)
Case 8 - Break (26B)
Case 9 - Break (26B)
Case 10 - Break (26B) Case 11 - Break (26B)
Case 12 - Break (26B)
Case 13 - Break (26B)
Case 14 - Break (26B)
Case 15 - Break (4B)
Case 16 - Break (26B)
Case 17 - Leak (4B) Case 17 - Break (26B)
Case 18 - Leak (26B)
Case 18 - Break (26B)
Case 19 - Leak (4B)
Case 19 - Break (4B)
Case 20 - Leak (26B)
Case 20 - Break (26B)
C
o
n
d
itio
n
al P
ro
b
ab
il
ity
(
1
/cr
a
ck
)
Operation Year
The crack grows longer with lower membrane-bending stress ratio. The PFM analyses, given ±50MPa of the pure bending stress every hour for crack growth condition, have been performed (Case 19 and 20). For 4B pipe, owing to decreasing of the ligament, the pipe is easy to broken before leakage. In this case, the effect of the seismic load is negligible as it as the aforementioned design loading cases. For 26B pipe, the break probability with the seismic load is about two orders higher than that without the seismic load.
5. CONCLUSION
The probabilistic fracture mechanics code, which can consider the dispersion of seismic load and its frequency, is established. Using this analysis code, the effects of earthquake on failure probability of the flawed pipe are assessed.
1. In the PFM analysis considering the earthquake, the importance sampling applied to the seismic stress is effective for the efficient calculation.
2. If the pipe is loaded the large stress, which exceeds collapse stress, it is broken irrespective of the crack size. Such a large load, therefore, is out of the scope of PFM analysis and is the scope of the seismic PSA. The seismic stress applied to the PFM analysis is limited below the collapse stress of the pipe.
3. The failure characteristics of large and small diameter pipe are different in the case of earthquake. For the small diameter pipe, the break probability caused by the load except the earthquake is very high, and the effect of seismic load is negligible. For the large diameter pipe, the break probability caused by the load except the earthquake is very low, and it is much affected by the seismic load.
4. PFM analysis considering the seismic load, the effect of dispersion of seismic stress is larger than that of grand acceleration.
5. If the frequency is lower than 10-5/year, the earthquake is not effective on the break probability. 6. The crack growth rate has not much effect on the break probability, but on the leak probability.
7. The membrane-bending stress ratio is much effective on the break probability. For the small diameter pipe, the break probability increases exceedingly in the pure bending condition. For the large diameter pipe in the same loading condition, the increase of the break probability caused by the seismic load is larger than that of the design loads.
ACKNOWLEDGEMENT
This study was performed as the part of the research in PFM Subcommittee in Japan Welding Engineering Society, which is under the sponsorship from Japan Atomic Energy Research Institute. The author wishes to thank Pro. S. Yoshimura, University of Tokyo, who is an advisor of this study.
REFERENCE
[1] Becher, P.E., and Pedersen, A., “Application of Statistical Linear Elastic Fracture Mechanics to Pressure Vessel Reliability Analysis,” Nuclear Engineering and Design, Vol. 27, 1974, pp. 413-425.
[2] Marshall, W., An Assessment of the Integrity of PWR Pressure Vessel, UK. AEA, 1976.
[3] Sinozuka, M., Development of Reliability-based Aircraft Safety Criteria, AFFDL-TR-76-31, 1976
[4] Harris, D. O. et al., Probability of Pipe Fracture in the Primary Coolant Loop of a PWR Plant, NUREG/CR-2189, 1981. [5] Fujioka, T., Shimakawa, T., Miura, N., Kashima, K., “Development and Verification of Evaluation Method for
Creep-fatigue Crack Propagation in FBR Components,” PVP, ASME, Vol. 305, pp. 395-402, Honolulu, July 1995.
[6] Lo, T. Y., Mensing, R. W., Woo, H. H., Holman, G. S., Probability of pipe failure in the reactor coolant loops of combustion engineering PWR plants, Vol. 2 : Pipe failure induced by crack growth, NUREG/CR-3663, 1984.
[7] Asada, Y., Takumi, K., Hata, H., Yamamoto, Y., “Development of Criteria for Protection Against Pipe Breaks in LWR Plants,” International Journal of Pressure Vessels and Piping, Vol. 43, 1990, pp. 95-111.
[8] Raju, I. S., Newman, J. C. Jr., “An Empirical Stress-intensity Factor Equation for the Surface Crack,” Engineering of Fracture Mechanics, Vol. 15, 1981, pp. 185-192.
[9] ASME Boiler & Pressure Vessel Code, Section III, 1973.
[10] Kanninen, M. F., Broek, D., Marschal, C. W., Rybicki, E. F., Sampath, C. G., Simonen, F. A., Wilkowski,G. M.,
Mechanical Fracture Predictions for Sensitized Stainless Steel Piping with Circumferential Crack, EPRI NP-192, 1976. [11] Ebisawa, K., Abe, K., Muramatsu, K., Itoh, M., Kohno, K., Tanaka, T., “Evaluation of response factors for seismic