Power Consumption Analysis in Smart Home
Using Data Acquisition
Prachi Kulkarni, D.K.Chitre
Terna Engineering College, Maharashtra, India
ABSTRACT: One of the major attribute of the Smart home automation and energy management systems integrate IOT
and renewable energy resources at the consumption premises. With advancement of Automation technology, today’s world prefers Automatic systems over manual systems. This paper presents the design, implementation and testing of an embedded system using arduino that integrates solar energy resources and energy management to a smart home incorporated with IOT. The proposed system provides and manages a smart home energy requirement by installing renewable energy and scheduling the power flow during peak and off-peak period. IOT (Internet of things) is the latest and emerging internet technology. Increasing cost and demand of energy has led many organizations to find smart ways for monitoring, controlling and saving energy. A smart Energy Management System (EMS) can contribute towards cutting the costs while still meeting energy demand. The emerging technologies of Internet of Things (IoT) and Big Data can be utilized to better manage energy consumption in residential, commercial, and industrial sectors. This paper presents an Energy Management System (EMS) for smart homes. In this system, each home device is interfaced with a data acquisition module that is an IoT object with a unique IP address resulting in a large mesh wireless network of devices. The data acquisition System on Chip (SoC) module collects energy consumption data from each device of each smart home and transmits the data to a centralized server for further processing and analysis. This information from all residential areas accumulates in the utility’s server as Big Data. The proposed EMS utilizes off-the-shelf Business Intelligence (BI) and Big Data analytics software packages to better manage energy consumption and to meet consumer demand. Since air conditioning contributes to 60% of electricity consumption in Arab Gulf countries, HVAC (Heating, Ventilation and Air Conditioning) Units have been taken as a case study to validate the proposed system. A prototype was built and tested in the lab to mimic small residential area HVAC systems.
KEYWORDS: Business Intelligence, Big Data Analytics, Energy Management System, HVAC, Internet of Things,
MQTT, System on Chip.
I. INTRODUCTION
The Internet of Things (IOT) is the recent advancement in tele-communication that is the future, in which the devices of everyday life will be equipped with microcontrollers, transceivers for digital communication, and suitable protocol that will make them able to communicate with one another and with the users, becoming an integral part of the Internet. The IOT concept, aims in making the Internet more reliable and pervasive. Thus by enabling easy access and interaction with a wide variety of devices such as, for instance, home appliances, surveillance cameras, monitoring sensors, actuators, displays, vehicles, and so on, the IOT will help in the development of various applications that make use of the potentially enormous amount and variety of data generated by such objects to provide new services to citizens, companies, and public administrations.
technical difficulties, the adoption of the IOT paradigm is also hindered by the lack of a clear and widely accepted business model that can attract investments to promote the deployment of these technologies.
1.1 Background
Data analytics on this data using business intelligence (BI) platform [2] plays an essential role in energy management decisions for homeowners and the utility alike. The data can be monitored, collected and analyzed using predictive analysis and advanced methods to actionable information in the form of reports, graphs and charts. Thus, this analyzed data in real-time can aid home owners, utilities and utility eco-systems providers to gain significant insights on energy consumption of smart homes. The energy service providers can use the power consumption data available with analytics engine to provide flexible and on-demand supply with appropriate energy marketing strategies. The consumers, being aware of their consumption behavior and having a close interaction with the electricity utilities, can adjust and optimize their power consumption and reduce their electricity bills. In order to have an effective cost saving system, it is important to monitor and control the operation of residential loads depending on the aggregate power consumption over desired period, the peak power consumption, the effect of weather/atmospheric conditions and consumption slab rates.
This is where the combination of IoT technology, Big Data analytics and BI comes into play for implementing energy management solutions on a local and national scale. Finally, as an additional advantage, the use of IoT also enables seamless remote access control of home devices where the customers get online access to the ON/OFF usage pattern of in home appliances via a personal computer or a mobile phone. Rest of the paper is organized as follows. Previous work in using Home Energy management System (HEMS) is presented next. This is followed by the proposed system requirements. The system architecture is presented next followed by a description of implementation details. Evaluation and testing is described and succeeded by the conclusion. Energy management in the context of smart homes spans the three areas namely; Smart devices, Wireless Sensor Networks (WSN), and Home Energy Management System (HEMS). A HEMS requires a reliable communication network using WSN that can transport the consumption details and consumer load behavior periodically. In [3, 4, 5], an implementation of a HEMS Unit in a Wireless Sensor Network using a ZigBee Module to communicate with sensor nodes, is presented. The system monitors the device consumption data and sends control signals to end nodes during peak load hours. However, the lifetime of a WSN network deteriorates with time due to the deployment of new sensors in the network. Additionally, Han et al. in [6] introduced a system for monitoring power consumption using ZigBee as the communication protocol in a WSN. However, in this system the data was collected and aggregated solely by the home server which could lead to data loss in case of a system failure. Moreover, a bridge between ZigBee and TCP/IP stack would be required to connect this system to a community of homes.
The above mentioned WSN networks have been extended to wider ranges in the IoT paradigm utilizing the GSM/GPRS networks to remotely control the end-devices in [7, 8]. Various studies have been steered in the application of IoT environment for HVAC control and scheduling methods to optimize HVAC energy consumption [9, 10, 11]. A hierarchical, smart-home service architecture employed with multiple in-home displays for user interfaces is described in [12]. In this research [12], a home controller system interfaced with device sensors is responsible for aggregated energy reporting of all devices to home owners. For community representatives, a community broker server is integrated with different home network devices such as security cameras within a community. Furthermore, a comparative analysis between Message Queuing Telemetry Transport Protocol (MQTT) and Hypertext Transfer Protocol (HTTP) is also performed to determine which protocol was more efficient in providing home control services [12]. The design of the proposed architecture, however, lacks the incorporation of Big Data which is instrumental in processing and analyzing huge volume of data collected from several home sensor networks.
Challenges could be overcome with IoT that will provide an integrated platform for DC powered technologies in efficient energy distribution.
Multiple in-home display systems (IHDs) and automatic meter reading systems (AMR) were discussed in the context of providing energy management information in [14]. Depending on the ambient conditions, the smart home systems could choose the display devices such as TV, smartphone or tablet computers and accordingly select the appropriate user interface. The architecture, however, lacked a standardized user interface for all the home devices that could accomplish the requirement for multiple displays. A proposed architecture of HEMS utilizing power line communication was addressed in [5]. Using smart meter data, this HEMS can monitor and provide real-time information on home energy consumption along with online access to devices status, thus allowing remote control of devices by customers. The proposed design is based on standard HTTP protocol and does not provide support for lighter-weight communication protocol like MQTT which is essential to scale up the system in order to accommodate multiple residential areas. In [6], a residential gateway controller was developed with a central management system that generated an operation plan for all the connected nodes in a home network depending on weather conditions. The devices status and power consumption details were transported to the web server through an extensible markup language (XML) interface. Since XML files tend to be heavy
weight for data delivery between browser and servers, the architecture will face significant bandwidth challenges in sending these large files across the network [16].
The sheer quantity of data collected throughout different cities of a country presents multiple challenges in data storage, organization, and analysis. Internet of Things (IoT) technology and Big Data are natural candidates to address these challenges. IoT technologies can provide a ubiquitous computing platform to sense, monitor and control the household appliances energy consumption on a large scale. This data is collected using many different wireless sensors installed in residential units. Similarly, Big Data technology can be utilized to collect and analyze large amounts of data [1]. Data analytics on this data using business intelligence (BI) platform [2] plays an essential role in energy management decisions for homeowners and the utility alike. The data can be monitored, collected and analyzed using predictive analysis and advanced methods to actionable information in the form of reports, graphs and charts. Thus, this analyzed data in real-time can aid home owners, utilities and utility eco-systems providers to gain significant insights on energy consumption of smart homes. The energy service providers can use the power consumption data available with analytics engine to provide flexible and on-demand supply with appropriate energy marketing strategies. The consumers, being aware of their consumption behavior and having a close interaction with the electricity utilities, can adjust and optimize their power consumption and reduce their electricity bills. In order to have an effective cost saving system, it is important to monitor and control the operation of residential loads depending on the aggregate power consumption over desired period, the peak power consumption, the effect of weather/atmospheric conditions and consumption slab rates. This is where the combination of IoT technology, Big Data analytics and BI comes into play for implementing energy management solutions on a local and national scale. Finally, as an additional advantage, the use of IoT also enables seamless remote access control of home devices where the customers get online access to the ON/OFF usage pattern of in home appliances via a personal computer or a mobile phone.
1.2 Motivation
technologies such as Bluetooth and ZigBee are used to carry the information from perception devices to a nearby gateway. Other technologies such as Wi-Fi, 2G, 3G and 4G carry the information for long distances based on the application. These systems and appliances include sensors and actuators that monitor the environment and send surveillance data to a control unit at home. The control unit enables the householders to continuously monitor and fully control the electrical appliances. It also uses the surveillance data to predict future activities to be prepared in advance for a more convenient, comfortable, secure, and efficient living environment. Other applications of the smart community concept are in health care, managing shared resources, and enabling support social networking. The concept of a smart community is extended to develop a smart city. This difficulty has led to the proliferation of different and, sometimes, incompatible proposals for the practical realization of IoT systems. Therefore, from a systems view, the visualization of an IoT network, together with the required backend network services and devices, still lacks an established best practice because of its novelty and complexity. In addition to the technical difficulties, the adoption of the IoT paradigm is also hindered by the lack of a clear and widely accepted business model that can attract investments to promote the deployment of these technologies. In this complex situation, the application of the IoT to an urban context is of particular interest, as it responds to the data of many national governments to adopt ICT solutions in the management of public affairs, thus realizing the so-called Smart City concept. Although there is not yet a formal and widely accepted definition of “Smart City,” the final aim is to make a better use of the public resources, increasing the quality of the services offered to the citizens, while reducing the operational costs of the public administrations. This purpose can be done by the implementation of an IoT that will give a simple, and easy access to multiple platforms of public services. A multi-level IoT, may bring a number of benefits to the management and optimize the traditional public services, such as transport and parking, lighting, surveillance and maintenance of public areas, preservation of cultural heritage, garbage collection, hospitals, and school. Furthermore, the availability of different types of data, collected by Arduino with IoT, may also be exploited to increase the transparency and promote the actions of the home owners enhance the awareness of people about the status of their home, stimulate the active participation in the management of energy consumption, and also stimulate the creation of new services upon those provided by the IoT.
II. LITERATURE REVIEW
The design and implementation of a home monitoring system based on hybrid sensor networks. The system follows a three-layer architecture which combines hybrid-node networking with web access. An enhanced sensor node has been designed and fabricated to add controlled mobility to wireless sensor networks. The mobile node is capable of simple planar motions and is easy to be controlled through different user interfaces. A test bed including the static nodes as well as the mobile node has also been created for validating the basic functions of the proposed hybrid sensor network system. Network repair and event tracking capabilities of the mobile sensor node were tested. Stability of the proposed system in longtime home monitoring tasks was also verified.[3]
Then a WSN-based intelligent light control system for indoor environments. Wireless sensors are responsible for measuring current illuminations. Two kinds of lighting devices, namely, whole lighting and local lighting devices, are used to provide background and concentrated illuminations, respectively. Users may have various illumination requirements according to their activities and profiles. An illumination requirement is as the combination of background and concentrated illumination demands and users locations. We consider two requirement models, namely, binary satisfaction and continuous satisfaction models, and propose two decision algorithms to determine the proper illuminations of devices and to achieve the desired optimization goals. Then, a closed-loop device control algorithm is applied to adjust the illumination levels of lighting devices. [5]
home automation architecture. A ZigBee based home automation system and Wi-Fi network are integrated through a common home gateway. The home gateway provides network interoperability, a simple and flexible user interface, and remote access to the system. A dedicated virtual home is implemented to cater for the system’s security and safety needs. To demonstrate the feasibility and effectiveness of the proposed system, four devices, a light switch, radiator valve, safety sensor and ZigBee remote control have been developed and evaluated with the home automation system.[6]
The home energy control system design that provides intelligent services for users and demonstrate its implementation using a real testbed. This paper designs smart home device descriptions and standard practices for demand response and load management “Smart Energy” applications needed in a smart energy based residential or light commercial environment. The control application domains included in this initial version are sensing device control, pricing and demand response and load control applications. This paper introduces smart home interfaces and device definitions to allow interoperability among ZigBee devices produced by various manufacturers of electrical equipment, meters, and smart energy enabling products. [8]
A ZigBee-based wireless sensor network node for the ultraviolet (UV) detection of flame. The sensor node is composed of a ZnSSe UV photodetector, a current-sensitive front end including a high-gain current-to-voltage amplifier with 120 dB and a logarithm converter, and a transceiver operated at a 2.4-GHz industrial, scientific, and medical band. A passive photodetector is designed to have a cutoff at 360 nm and convert the UV emission of flame into picoamperes. Including mixed signal processing and ZigBee transmission, the speed of flame detection is as fast as 70 ms. The sensor node consumes only an average of 2.3 mW from a 3.3-V supply. The performance of a prototype sensor node was verified when the luminous flame was imaged onto the sensor node with different angles ranging from −30◦to
30◦and distances of 0.1, 0.2, and 0.3 m enabling effectivefire safety applications. [17]
III. PROBLEM STATEMENT
In existing system each home device is not interfaced with a data acquisition module that is an IoT object with a unique IP address resulting in a large mesh wireless network of devices so its create a less privacy and security Also in existing approach the data acquisition System on Chip (SoC) module is not able to collects energy consumption data from each device of each smart home and transmits the data to a centralized server for further processing and analysis that’s why this information from all residential Areas is not accumulates in the utility’s server as Big Data so it was gives a less optimal solution.
IV. REPORT OF THE PRESENT INVESTIGATION
Explanation-
In addition, a solid state relay is controlled by the microcontroller to switch ON/OFF the devices accordingly. A current sensor is used to measure the AC current to calculate the power consumption.
2) High-end Microcontroller
A SoC high end microcontroller is used as edge device data acquisition module that manages the HVAC unit . The compact sized, high speed and lightweight SoC is suitable for residential areas. Table I displays the specifications of the micro-controller used in this study.
3) Servers
In the proposed architecture, the servers are high-end PCs which can also be deployed on Cloud for wide-scale accessibility. The installed servers are: MQTT Broker, highly scalable Storage Server, Analytics Engine server, and a Web server. The functionality of each server developed and utilized will be explained in the software architecture section.
B. Software Architecture
Software architecture consists of three primary building modules; data acquisition module on the edge device, middleware module, and client application module:
1) Data Acquisition Module
The data acquisition module has two functions namely, monitoring function and controlling function. The monitoring function continuously reads the ambient temperature, humidity and the AC power consumption transmits the readings to the middleware module through MQTT protocol. These parameters are framed and reported to the middleware periodically in standard MQTT format. For example, the data frame has the user ID, house ID, device ID and the sensor values. The control function is used to receive the commands from the middleware module to turn ON/OFF the AC-Units accordingly.
2) Middleware Module
Middleware module consists of several software tools and servers that provide different services as explained below: i. MQTT Server
MQTT server (Broker) [11], provides a medium for the communication between the edge device (home appliances such as AC-Unit) and the middleware. On the broker side access control was enforced to prevent unauthorized access to certain topics. Some topics such as consumption reporting topic and device state change reporting topic is configured as write only. Only those with required privilege can read what is being published. Topics like control command is configured as read only, so that unauthorized controlling of device is prevented.
ii. Storage Server
A highly scalable storage server is used as data warehouse for storing the edge devices’ sensor data and user information [1]. It can handle the generated Big Data from residential units as well as scale up to more residential areas that can be added in future. A high performance and scalable database is required to store information related to users, user-house relations and house-device relations. Operational database that runs on top of existing scalable storage server was chosen .
iii. Analytics Engine server
An off-the-shelf business intelligence software tool was utilized to make smart decisions from the received big data [2]. For example: the measured data is sorted and classified based on temperature, humidity and power consumption per house. This classification is used to generate reports, graphs, and charts that identify the consumption pattern of the houses in a residential area. This enables every house owner to see his/her own power consumption pattern based on the ambient conditions. Moreover, benchmarking feature allows users to compare their consumption details with those with similar setups Accordingly, home owner can turn ON/OFF the device based on such information if needed. In addition to that, the tool can empower local utility and regional utility to see the energy consumption pattern according to their respective privileges. For example: a local residential utility center can view each individual houses’ aggregate consumption within its geographical area. A state utility center can view the aggregated consumption of each residential area in the state. The centralized Utility center can view each state’s consumption pattern. These reports and graphs will be rendered to the client application through the web server.
The client application accesses the operational database through different web services implemented using JavaScript [4]. These services are used to transmit data to and from the database and send it back to the requester. Web services are used by the client application to authenticate monitor and control devices, view registered properties, and view registered devices, monthly bill viewing/paying and viewing graphs appropriate to the level of the user. HTTPS protocol is used to design web services to encrypt the traffic flow.
3) Client Application Module
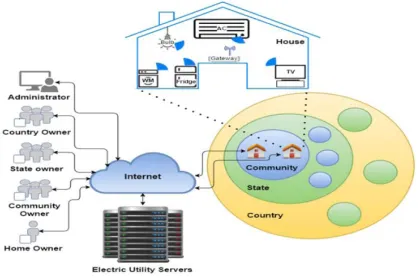
A cross-platform IDE was used to develop the front end mobile user interface [5]. The advantage of using such an environment is that it utilizes standard web development languages. It also ensures the cross-platform feature for application which means that only one application is developed for different mobile phone platforms without the need for reimplementation. The application uses two types of authentication; the regular username-password combination is used to initiate connection. Once the user is authenticated a random generated string called API key is used to authenticate operations. This key can be changed anytime, API key changes per session. Once the user logs out, the API key is changed. Moreover, to make granting privilege like making a user a state-owner requires an additional parameter called secret key is used. This key changes daily, weekly or monthly and is only to be known by the top-level employees. Fig. displays the overall sequence diagram showing the two-way data flow from home devices to end user application; one way is for monitoring device consumption details and other is for remote access control by the end user. Based on the above system requirements, the proposed system’s hardware and software architecture are as follows:
A. Hardware Architecture
As shown in Fig. 1, the hardware architecture of the system comprises of the following building blocks: 1) Sensors and Actuators
As the proposed system is to monitor and control the AC units, an integrated temperature and humidity sensor is interfaced with the microcontroller to measure the ambient conditions
V. RESULTS & DISCUSSIONS
To validate the architecture of the proposed system, a prototype was designed, built and tested in the lab. The prototype architecture consists of various hardware and software modules. In this section the hardware and software components used in the system prototype are described in details as follows:
A. Hardware
Fig. 2. Hardware Components
B. Software
The software implementation involves benchmarking and data analysis techniques using Business Intelligence tool to generate graphs, charts and reports in real time. This was followed with the development of a mobile application to render the generated graphs, charts, and reports to end users. A description of these software modules is given as follows:
Benchmarking and data analysis using BI platform One of the primary analysis techniques in data mining is benchmarking. Benchmarking the data sets can help identify setting optimal energy management goals and policies. The business intelligence software tool serves as an optimum platform for benchmarking real time data and generating user interactive charts and reports [2]. Different benchmarking scenarios are deemed for the four stakeholder levels as mentioned in the previous section. For example, a stakeholder like home owner in a residential area is entitled to view the graphs and charts for the total power consumption of his/her house on a daily, monthly, and annual basis. The user is prompted to enter his/her house ID and select the year for which he/she desires to view the power consumption of each device in the house as shown in Fig. The home owners can use benchmarking service to compare their power consumption with other housing units that have a similar setup. For community stakeholders, they are entitled to monitor power consumption of all houses in their respective community. There are two types of settings involved; first, benchmarking annual power consumption of each house against per square feet power consumption. Second, categorizing each house depending on its annual power consumption with respect to the house-age. The community owner is prompted to enter his/her respective community ID in order to obtain the desired graph or chart. A screenshot of annual power consumption chart for several housing units with their respective house IDs in a community is shown in Fig. It’s worth mentioning that the same chart can be obtained on a daily or monthly basis.
The state stakeholders at a state utility center can view data set distribution across regional communities within the state. Also, they can view the average power consumption spread across different communities on a monthly and yearly basis. The graphical data will be used to create benchmarks based on past records for conducting root cause analysis which is one of the business processes as mentioned previously. The trend line graphs can help predict the nature of power consumption of the state with respect to weather conditions (temperature) in future as shown in Fig. The Country stakeholders at a Centralized Utility Center are the highest level authority in the stakeholder hierarchy. These owners can view annual power consumption of each state in a country. The aggregated energy consumption
can be compared to the overall energy generation from the central power generation station. This can assist the state to plan and implement data driven energy strategies and decisions. Additionally, the country owners can check online the temperature, humidity and power consumption variation across different states using the Geo-Map service. They can inspect power consumption of states based on consumption slab rates using an Energy map as shown in Fig.
2) Client Application
control services (ON/OFF) for house devices as shown in Fig. For the bill tracking service, the user can view the monthly bill and pay the due amount online as shown in Fig.
Fig. 3. Throughput (kbps) Vs. Number of clients’ graph
Fig. 4. Latency (ms) Vs. Number of clients’ graph
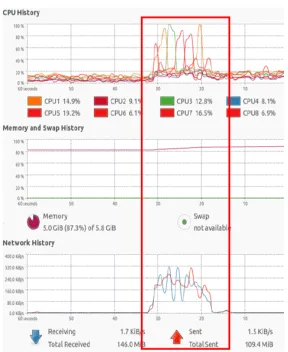
Fig. 5. Server performance during request phase
VI. CONCLUSION
REFERENCES
[1] “Welcome to Apache™ Hadoop®!” Hadoop.apache.org, 2016. [Online]. Available: http://hadoop.apache.org/. [2] “Pentaho Community,” Community.pentaho.com, 2016. [Online]. Available: http://community.pentaho.com/.
[3] M. Abo-Zahhad, S. M. Ahmed, M. Farrag, M. F. A. Ahmed and A. Ali, “Design and implementation of building energy monitoring and management system based on wireless sensor networks,” 2015 Tenth International Conference on Computer Engineering & Systems (ICCES), Cairo, 2015, pp. 230-233.
[4] N. H. Nguyen, Q. T. Tran, J. M. Leger and T. P. Vuong, “A real-time control using wireless sensor network for intelligent energy management system in buildings,” 2010 IEEE Workshop on Environmental Energy and Structural Monitoring Systems, Taranto, 2010, pp. 87-92.
[5] J. Byun, I. Hong, B. Kang and S. Park, “Implementation of an Adaptive Intelligent Home Energy Management System Using a Wireless Ad-Hoc and Sensor Network in Pervasive Environments,” 2011 Proceedings of 20th International Conference on Computer Communications and Networks (ICCCN), Maui, HI, 2011, pp. 1-6.
[6] J. Han, C. s. Choi, W. k. Park, I. Lee and S. h. Kim, “Smart home energy management system including renewable energy based on ZigBee and PLC,” IEEE Trans. Consumer Electron, vol. 60, no. 2, pp. 198-202, May 2014.
[7] J. Wang, J. Huang, W. Chen, J. Liu and D. Xu, “Design of IoT-based energy efficiency management system for building ceramics production line,” 2016 IEEE 11th Conference on Industrial Electronics and Applications (ICIEA), Hefei, 2016, pp. 912-917.
[8] G. Mingming, S. Liangshan, H. Xiaowei and S. Qingwei, “The System of Wireless Smart House Based on GSM and ZigBee,” 2010 International Conference on Intelligent Computation Technology and Automation, Changsha, 2010, pp. 1017-1020.
[9] Serra, J., Pubill, D., Antonopoulos, A., & Verikoukis, C. “Smart HVAC control in IoT: Energy consumption minimization with user comfort constraints”, The Scientific World Journal, 2014, pp 1-11.
[10] Fong, K. F., Hanby, V. I., & Chow, T. T. “HVAC system optimization for energy management by evolutionary programming,” Energy and Buildings, 38(3), 2006, 220-231.
[11] Tacklim Lee, Seonki Jeon, Dongjun Kang, Lee Won Park and Sehyun Park, “Design and implementation of intelligent HVAC system based on IoT and Bigdata platform,” 2017 IEEE International Conference on
Consumer Electronics (ICCE), Las Vegas, NV, 2017, pp. 398-399.
[12] Y. T. Lee, W. H. Hsiao, C. M. Huang and S. C. T. Chou, “An integrated cloud-based smart home management system with community hierarchy,” IEEE Trans. Consumer Electron, vol. 62, no. 1, pp. 1-9, Feb. 2016.
[13] K.R.Kundhavai,S.Sridevi, “IoT and Big data:-The current and future technologies : A review ,” IJCSMC,Internation journal of Computer science and mobile computing.IJCSMC, vol. 5, issue 1, Jan. 2016.
[14] Abida Sharif,JIAN PING LI, MUSSADIR KHALIL ,RAJESH KUMAR,,MUHAMMAD IRFAN SHARIF,ATIQUA SHARIF, “Internet Of Things-Smart traffic system for smart cities using big data analytics” IEEE Trans. University of electronic science and technology of china,978-1-5386-1010-7/17/$
[15] Raja A. Alshawish ,Salma,A.M.Alfiga,and mohammad S.Musbah Faculty of information Technoligy , “Big data Applications in smart cities.,” IEEE Trans. Faculty of information technology, 2016.
[16] Ashraf Ismail,Senior Lecturer in computing department ,” Utilizing Big data Analytics as solution for smart cities.”IEEE,2016.