ABSTRACT
SCALES, ALICE YOUNG. The Effect of Learning Style, Major, and Gender on Learning Computer-aided Drawing in an Introductory Engineering/Technical Graphics Course. (Under the direction of Dewey A. Adams and Barbara M. Kirby)
This correlational descriptive study examined factors that might affect studentsÕ
achievement in learning computer-aided drawing and engineering/technical graphics
concepts in introductory classes at North Carolina State University. The study involved 38
subjects enrolled in introductory classes that combined the teaching of computer-aided
drawing and technical graphics. The three dependent variables used in the study were CAD
project grade, CAD posttest score, and final course grade. The seven independent variables
examined were gender, learning style, major, student classification, final exam grade, final
exam with the posttest score removed, and pretest score. Subjects' learning styles were
established by the Group Embedded Figures Test, which measures field-dependence and
field-independence. KendallÕs Tau B correlations and multiple linear regression models
were used in the analysis of the data. The a used for statistical significance was .05.
Analysis of the data revealed that the research subjects were primarily field
dependent, and exactly half of them had prior drafting experience. Subjects in the study
represented 19 different majors. Eighteen students were from engineering programs and 20
from non-engineering programs. Females in the sample reported a lower level of computer
experience and less prior drafting experience than males.
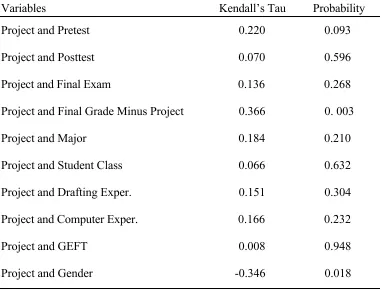
For the total sample, statistically significant correlations were found between the
exam grade and gender. Correlations were found between gender and the final exam grade
with the posttest score removed and between learning style and the final exam with the
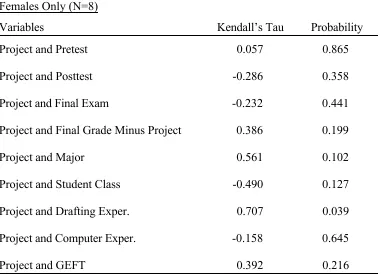
posttest score included. For females, a statistically significant relationship was found
between prior drafting experience and the project grade; this was the strongest correlation
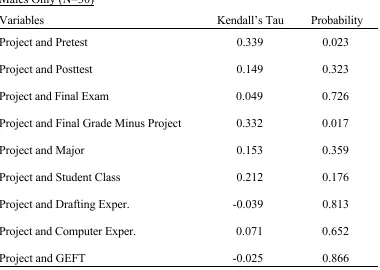
found in the study. For males, statistically significant relationships were found between
learning style and final exam grade, learning style and the final exam grade with the posttest
removed, the project grade and the final grade with the project score removed, the project
grade and the pretest score, and the pretest and posttest score.
Three multiple linear regression models were created as part of the study, two as
predictors of computer-aided drawing achievement and one as a predictor of achievement in
learning the course content. Model 1 used the final project grade as its dependent variable to
measure CAD achievement. The independent variables used in this model were gender, the
pretest score, and major. The modelÕs R2 was 0.31 (p = 0.005). Model 2, which used the posttest score as its dependent variable, was the second measure of CAD achievement. The
independent variables used in this model were the pretest score, the Group Embedded
Figures Test score, and the final exam grade with the posttest score removed. Its R2 was 0.19 (p = 0.056). Model 3 used the final course grade as its dependent variable to measure
achievement in learning the course content. The independent variables included in this
model were gender, the Group Embedded Figures Test scores, and student classification.
DEDICATION
I would like to dedicate this dissertation to the people who inspired me. My parents,
Kathryn and Talmage Young, believed in me and gave me the courage to pursue this
degree. My father taught me to reach for excellence. Dad, I wish you were here. My mother
taught me persistence and to see beauty in the things and people around me.
I also dedicate this dissertation to my husband, Glenn, and my children, Emily and
David. They allowed me time to accomplish this, believed that I would get it done, and
provided the love and understanding I needed to keep going.
Finally, I dedicate this dissertation to my sister, Gloria. I have always looked up to
BIOGRAPHY
Alice Kathryn Young Scales was born in Fitzgerald, Georgia on December 2,
1947. Moving to Raleigh, North Carolina in 1957, she graduated from Needham B.
Broughton High School in 1965. After graduating from high school, she attended
Campbell College and North Carolina State University. She received her Bachelor of
Science in Science Education with a Concentration in Biology from North Carolina State
University in 1969. She taught Science in Johnston County, North Carolina before taking a
position at Wake Memorial Hospital as an In-service and Continuing Education Instructor
for non-nursing personnel.
After marrying, she returned to public school teaching in the Wake County Public
Schools in 1977. There she taught Industrial Arts and Occupational Exploration at the
Middle Grades level. While still teaching for Wake County, she completed her Master of
Education Degree in Industrial Arts Education in 1983. She was presented the Young
Educator Of the Year Award by the North Carolina Association of Educators in 1982.
Employed by North Carolina State University in 1988 as a Lecturer in the Graphic
Communications Program, she was appointed the Coordinator of the program in 1994.
While at NCSU, she has conducted research in the areas of visualization and AutoCAD
instruction through web-based tutorials.
She is a member of the Phi Kappa Phi, Epsilon Pi Tau, Phi Kappa Delta, and
Omicron Tau Theta honor societies as well as the American Society for Engineering
ACKNOWLEDGMENTS
It would be impossible to acknowledge all the people who encouraged and helped
me in the pursuit of this degree, but I would like to express my gratitude to a number of
people who have contributed to its completion. A special thanks goes to the members of my
Graduate Committee, Dr. Dewey Adams, Dr. Barbara Kirby, Dr. Jacquelin Dietz, and Dr.
Terrance OÕBrian who pushed and worked with me during the long process. I would also
like Mr. Brian Matthews to know how grateful I am to him for allowing me to use his
classes in my research, and for his assistance in the collecting the data. I would like to thank
Mr. John Freeman who helped me with some of the edits, and Dr. Aaron Clark, Dr.
Theodore Branoff, Dr. Eric Wiebe, Dr. John Crow, Dr. James Haynie, and Dr. William
Waters who listened to me when I needed it and gave me valuable advice and
TABLE OF CONTENTS
LIST OF FIGURES...vii
LIST OF TABLES...viii
1. INTRODUCTION...1
Research on the Effect of Instructional Media ...5
Purpose of the Study ...6
Research Questions ...7
Assumptions and Limitations ...8
Definition of Terms ...9
Summary ...11
2. LITERATURE REVIEW...12
Introduction ...12
Theoretical Model...12
Learning Styles...13
Learning Style Classifications...14
WitkinsÕ Field-Independent and Field-Dependent Cognitive Styles ...16
Field-Neutral Characteristics...18
Learning Styles and Achievement...20
Teaching Style, Learning Style, and Achievement...28
Gender Differences in Computer Training...32
Learning Style and Drafting...39
Summary ...41
3. METHODOLOGY...43
Introduction ...43
Significance of the Study...43
Purpose of the Study ...43
Design of Study...44
Population and Sample ...44
Instrumentation ...45
The Group Embedded Figures Test...45
Tutorials...46
Questionnaire...46
Pretest and Posttest...47
Research Procedure ...48
Analysis Methods...50
Dependent Variables...50
Independent Variables ...51
Multiple Linear Regression Models...52
4. FINDINGS ...54
Introduction ...54
Description of the Study Sample ...54
Analyses of the Correlations Between Variables...56
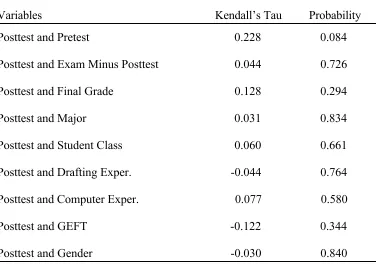
Final Project Grades ...57
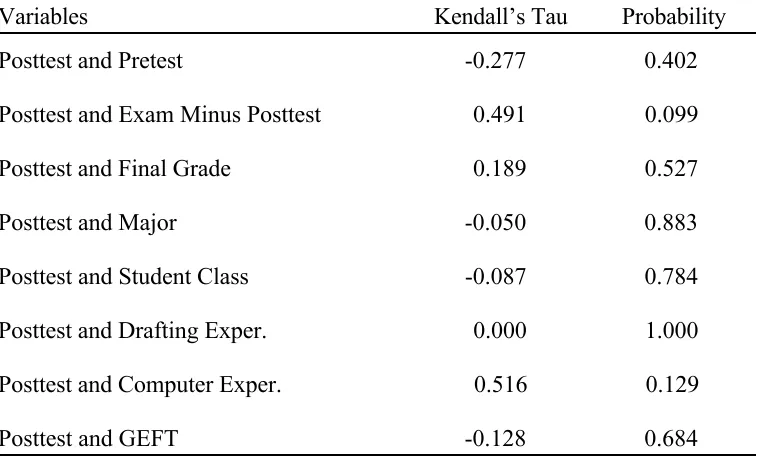
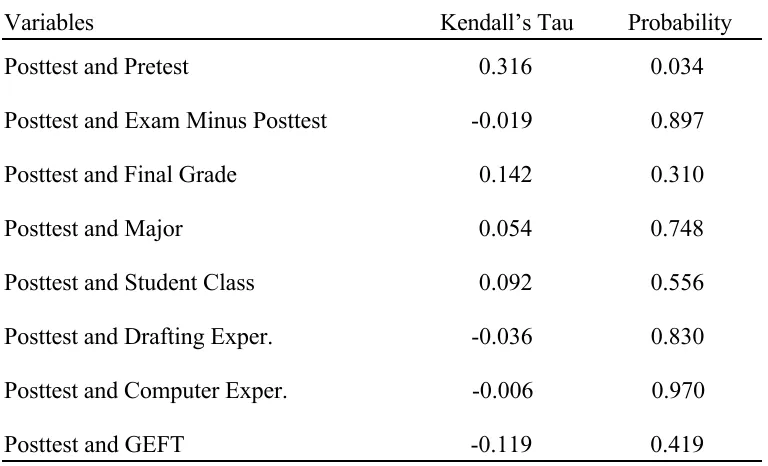
Posttest Score ...60
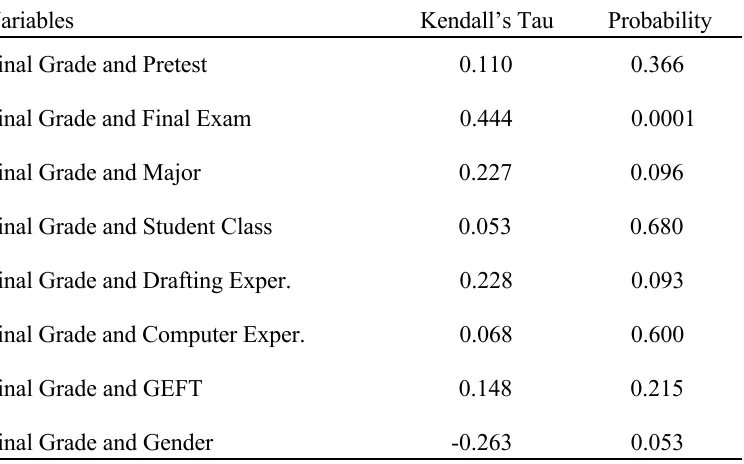
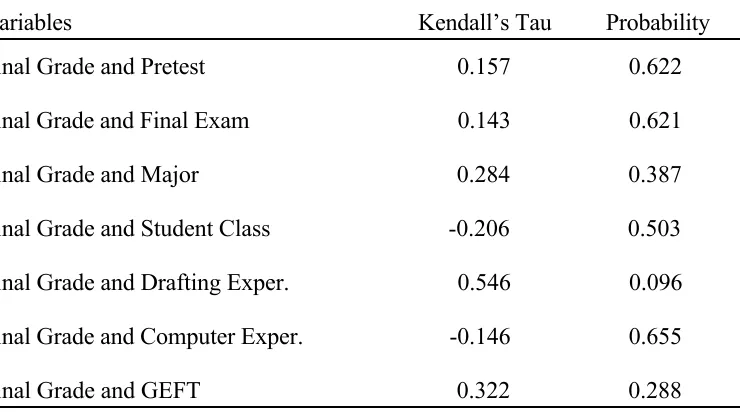
Final Grade...63
Prior Computer Experience...66
Prior Drafting Experience...70
Group Embedded Figures Test Scores (GEFT)...73
Pretest Scores ...77
Gender...77
Student Classifications...78
Final Exam Grades with the Posttest Score Removed ...79
Multiple Linear Regression Models...80
Project Model ...81
Posttest Model...84
Final Course Grade Model ...88
Summary ...91
5. SUMMARY, CONCLUSIONS AND RECOMMENDATIONS ...92
Introduction ...92
The Study Research Questions...92
The Multiple Linear Regression Models...97
Discussion...99
Recommendations...106
Recommendations for Further Study...106
Recommendation for Practice ...108
Summary ...109
6. REFERENCES...110
7. APPENDICES ...117
Consent Form...118
Pretest...120
Questionnaire...123
LIST OF FIGURES
CHAPTER 2
1. Theoretical Learning Model...13
CHAPTER 4
2. Stem and leaf diagram of the distribution for the Group
Embedded Figures Test scores ...73 3. Scatter plot of the relationship between GEFT scores and
LIST OF TABLES
1. Majors of Students in the Study Sample...55
2. Engineering and Non-Engineering Majors by Gender...56
3. Correlation of Project Grade and Other Variables: Total Sample...58
4. Correlation of Project Grade and Other Variables: Females Only ...59
5. Correlation of Project Grade and Other Variables: Males Only...60
6. Correlation of Posttest Scores and Other Variables: Total Sample ...61
7. Correlation of Posttest Scores and Other Variables: Females Only...62
8. Correlation of Posttest Scores and Other Variables: Males Only ...63
9. Correlation of Final Grade and Other Variables: Total Sample...64
10. Correlation of Final Grade and Other Variables: Females Only ...65
11. Correlation of Final Grade and Other Variables: Males Only...66
12. Frequency of Computer Experience...67
13. Correlation of Computer Experience and Other Variables: Total Sample ...68
14. Correlation of Computer Experience and Other Variables: Females Only...69
15. Correlation of Computer Experience and Other Variables: Males Only...70
16. Correlation of Drafting Experience and Other Variables: Total Sample ...71
17. Correlation of Drafting Experience and Other Variables: Females Only...72
18. Correlation of Drafting Experience and Other Variables: Males Only...72
19. Correlation of GEFT Score and Other Variables: Total Sample ...74
20. Correlation of GEFT Score and Other Variables: Females Only...76
21. Correlation of GEFT Score and Other Variables: Males Only ...76
Total Sample ...78
24. Correlations Between the Exam Grade Minus the Posttest Score and Other Variables: Total Sample ...79
25. Correlations Between the Exam Grade Minus the Posttest Score and Other Variables: Females Only...79
26. Correlations Between the Exam Grade Minus the Posttest Score and Other Variables: Males Only...80
27. Model 1 (Project Grade) - Effect Tests for Variables Considered for Use in the Model...81
28. Model 1 (Project Grade) - Summary of Fit With Variables Before Stepwise Regression Procedure Performed ...82
29. Model 1 (Project Grade) - Stepwise History ...82
30. Model 1 (Project Grade) - Summary of Fit for Final Model...83
31. Model 1 (Project Grade) - Parameter Estimates for Final Model...83
32. Model 1 (Project Grade) - Analysis of Variance Test for Whole Model ...83
33. Model 2 (Posttest Score) - Effect Tests for Variables Considered for Use in the Model...85
34. Model 2 (Posttest Score) - Summary of Fit With Variables Before Stepwise Regression Procedure Performed ...85
35. Model 2 (Posttest Score) - Stepwise History...86
36. Model 2 (Posttest Score) - Summary of Fit for Final Model...86
37. Model 2 (Posttest Score) - Parameter Estimates for Final Model ...87
38. Model 2 (Posttest Score) - Analysis of Variance Test for Whole Model...87
39. Model 3 (Final Course Grade) - Effect Tests for Variables Considered for Use in the Model...88
40. Model 3 (Final Course Grade) - Summary of Fit With Variables Before Stepwise Regression Procedure Performed ...89
41. Model 3 (Final Course Grade) - Stepwise History...89
42. Model 3 (Final Course Grade) - Summary of Fit for Final Model ...90
43. Model 3 (Final Course Grade) - Parameter Estimates for Final Model...90
Chapter 1
INTRODUCTION
Eighty percent of the manufacturing gross national product passes through
computer-aided drawing, computer-aided manufacturing, or computer-aided engineering
systems (Connolly, 1998). In industry, computer-based drawing has become the standard
because it has advantages over traditional hand-drawing. Computer-based drawings are
quicker to produce, are more precise, can be retrieved and edited, and can be drawn in ways
not possible by hand techniques. They can also be linked to other software and machines to
perform computer-aided manufacturing (CAM), finite element analysis, and computer
numerically controlled (CNC) manufacturing (Bertoline, 1993; Bidanda, Shuman, &
Puerzer, 1992; Connolly, 1998; Teske, 1992). As computers moved into manufacturing
and engineering design, they also moved into the field of technical graphics. The
introduction of computers into technical graphics in industry is changing the standards that
define how technical graphics are represented (Gorska, 1998); therefore, the domain of
engineering/technical graphics education must include computer-based graphics if students
are provided with the tools they need in their careers. According to Baxter (1998),
companies now expect entry-level engineers to be able to create and document computer
models of engineering designs.
A few institutions of higher education began including computer instruction in
engineering/technical graphics courses as early as the 1980s, and its inclusion has gained
engineering/technical graphics programs to abandon teaching students manual instrument
drawing. Many institutions instruct students to use a range of computer drawing programs
that include computer-aided drawing (CAD) and 3-dimensional constraint and non
constraint-based modeling software (Baxter, 1998; Connolly, 1998; Gorska, 1998; Nee;
1998; Wiebe, 1998). According to a survey conducted in the Fall of 1998 that investigated
teaching practices in the field of engineering/technical drawing, 92.8 percent of the
respondents indicated that some form of computer-aided drawing is being taught at their
institutions. Also, two of their top concerns were staying abreast of software and hardware
changes and the quality of graphics instruction in technical graphics programs (Clark &
Scales, 1999).
Since computers in engineering/technical graphics are here to stay, there is a need to
find ways to fully integrate computer instruction into classes in an efficient and effective
manner (Chipman, 1993). In order to create effective computer learning activities and
design courses that deliver computer instruction along with engineering/technical graphics
concepts to student with different characteristics, research must be conducted (Lee, 1993).
The need to develop effective instructional techniques to teach computer software in
graphics classes will continue to grow as other computer graphics software becomes part of
the curricula of most institutions of higher education (Bertoline, 1993). Some institutions
already include instruction in computer-aided manufacturing, computer rendering, computer
simulation, finite element analysis, and desktop publishing. To develop instruction that
effectively teaches this type of software, instructors need information based on research.
affect studentsÕ achievement in learning to use technical graphics software and technical
graphical concepts together.
Teaching technical computer graphics classes not only requires teaching students
the function and use of computer commands, but also how to apply geometric concepts, to
develop strategies for modeling objects, and to function in 3-dimensional space. Computer
graphics instruction integrated into graphics classes must allow students to quickly master
the software and utilize it to produce graphical drawings and simulations (Mohler, 1997).
At North Carolina State University (N. C. State), engineering and technology
students take introductory engineering/technical drawing classes that include
computer-aided drawing instruction. Teachers at N. C. State use a variety of methods to incorporate
this instruction into their classes. Presently they include a combination of tutorials delivered
through the World Wide Web, class demonstrations, CAD homework assignments, and a
final CAD project. The web tutorials are the core of the CAD instruction. This method of
delivering CAD instruction has several advantages. Unlike earlier versions of computer
assisted instruction (CAI), on-line tutorials are available to students at any time and
eliminate instructional material duplication costs. The use of web-based instruction permits
instructional designers to develop flexible instruction that integrates text and graphics as
well as sound and animation (Benyon, Stone and Woodroffe, 1997; McManus, 1996;
Shneiderman, 1997). The web tutorials and other teaching strategies used at N. C. State for
CAD instruction are consistent with recommendations by Lee (1993).
Research demonstrates that matching learning styles with teaching styles has an
Grimes, 1995; Matthews, 1996; OÕNeil, 1987; Smith & Renzulli, 1984). Wooldridge
(1995) stated that the learning style concept is the most important concept to influence
education in years because it goes to the core of what it means to be a person. He also
stated that matching learning styles with teaching styles is logical and offers a framework
for organizing instruction for the diversity among students. Because instructors tend to use
teaching styles that match their learning style, students with learning styles that do not
match the instructorÕs are at a disadvantage (Charkins, OÕToole & Wetzel, 1985; Dunn,
Beaudry & Klavas, 1990; Dunn & Dunn, 1985; Wooldridge, 1995). Identifying the
predominant mode of learning in classes and being aware of differences in learning modes
are important to serving students in a class. Davidson (1990) suggested that studentsÕ
knowledge of their learning style could even have an effect on their achievement.
The importance of research on learning styles has been voiced by a number of
individuals. Sims & Sims (1995) stated:
It should be evident to those responsible for teaching and training that an increased
understanding and use of learning style data can provide them with important
information. Most importantly, each teaching or training endeavor will have learners
with disparate learning style preferences and a variety of learning strengths and
weaknesses that have been developed through earlier learning experiences,
analytical abilities, and a host of other preferences they bring with them (p. 193).
StudentsÕ interest and confidence in using computers may be related to their ability
to learn computer-aided drawing in technical graphics courses. Gattiker (1990) and
confidence to master computer skills. In studies that have examined computer skill
development, experience, and attitudes, females were shown to have less experience, less
confidence, and a greater fear of computers than males.
The only study that investigated CAD instruction was completed by Lee in 1993.
LeeÕs study looked specifically at predictors of student achievement after using self-paced
AutoCAD tutorials, but the tutorials used for the study were designed to teach the software
commands without reference to graphical concepts. Lee concluded that the levels of prior
computer experience, prior exposure to AutoCAD in high school, and attitudes toward the
tutorial were significant predictors of achievement in learning AutoCAD. He did not find
learning style to be a predictor of the subjectsÕ achievement. Guster (1986), on the other
hand, found that learning style did relate to achievement in high school drafting classes. A
search of the literature failed to locate research that examines the effect of learning style,
major, and gender on mastering CAD along with course content in engineering/technical
graphics classes at the higher education level.
Research on the Effect of Instructional Media
One widely used method for instructing students in computer graphics and CAD is
software instructional tutorials (Parson, 1997). Software tutorials are not new and are
frequently included with software documentation in either printed or as multimedia form.
Tutorials allow students to move at their own pace and to repeat lessons. They do not
to work with students who need additional assistance. Well-designed tutorials can be a very
efficient form of instruction (Lee, 1987).
A method of delivering software tutorials is through the World Wide Web. This
form of tutorial delivery is becoming common and is predicted to grow (Ibrahim &
Franklin, 1995; Jacobson & Levin, 1998; Parson, 1997; Smith, Newman & Parks, 1997).
Although research on instructional technology has been carried out for approximately 90
years, there is little evidence that the type of media used to deliver instruction has any effect
on learning. It has been demonstrated that the design of instructional material, regardless of
the media through which it is presented, has a greater effect on learning (Parson, 1997;
Russell, 1997; Thompson, Simonson & Hargrave, 1996). Research that has examined the
effect of media and learning styles on achievement has largely found that no real
interactions exist (Ayerman, 1993; Cordell, 1990). In this study, the media used to deliver
tutorials to students should not have had an effect on learning AutoCAD and was not
examined.
Purpose of the Study
Students in introductory Graphic Communications courses at N. C. State come
from different backgrounds and have different prior experiences. It has been observed in
these classes that some students are less successful than others in developing the skills they
need to use AutoCAD to produce acceptable models and drawings and in understanding
the graphic concepts taught in the course. Although strategies used at N. C. State are fairly
factors that might affect the achievement of students in learning computer-aided drawing
and the engineering/technical course concepts in these classes. This descriptive,
correlational study explored the relationship between learning styles, major, prior computer
experience, prior drafting experience, student classification, and gender on achievement in
learning to use the computer-aided drawing package known as AutoCAD and the concepts
of technical graphics in introductory classes of engineering/technical graphics at N. C.
State.
Research Questions
The research questions used in this study included the following:
1. What pattern of learning styles exists for students who enroll in introductory
engineering graphics classes?
2. Is there any relationship between a studentÕs learning style and his or her achievement
in learning computer-aided drawing programs in classes of introductory engineering
graphics?
3. Is there a relationship between a studentÕs prior computer experience and his or her
achievement in learning computer-aided drawing in classes of introductory engineering
graphics?
4. Is there any relationship between a studentÕs major and his or her achievement in
learning computer-aided drawing programs in classes of introductory engineering
5. Is there a relationship between a studentÕs gender and his or her achievement in learning
computer-aided drawing programs in classes of introductory engineering graphics?
6. Is there a difference in the prior computer experience based on a studentsÕ major in
classes of introductory engineering graphics?
7. Is there a difference in the prior computer experience of individuals based on their
gender in classes of introductory engineering graphics?
8. Is there a difference in the learning styles of students in different majors among
students enrolled in introductory engineering/technical graphics courses?
9. What percentage of students entering introductory engineering graphics classes at N. C.
State have prior drafting experience?
10. Does previous drafting experience have any relationship to a studentÕs achievement in
learning CAD in classes of introductory engineering graphics?
11. Does previous drafting experience have any relationship to a studentÕs achievement in
learning course content in classes of introductory engineering graphics?
12. Is there a relationship between a studentÕs gender and his or her achievement in learning
course content in classes of introductory engineering graphics?
13. Is there a relationship between a studentÕs learning style and his or her achievement in
Assumptions and Limitations Assumptions
1. The classes selected for participation in the study were introductory classes, and the
students enrolled in the classes were assumed to have limited experience with
computer-aided drawing programs and the course content.
Limitations
1. The sample was limited to whole classes in order to eliminate teacher effects, which did
not allow the selection of a random sample of research participants.
2. After the information on students in the sample was collected, it was noted that a large
portion of the students was from the Civil Engineering Program. This was due to the
specialized engineering/graphics courses are that taught at N. C. State for specific
engineering programs. For this reason, Mechanical, Aerospace, and Industrial
Engineering students are underrepresented in the classes that were sampled.
Definition of Terms
Some definitions and/or background information for terms used in this study are
provided in the following:
1. Boolean Operation Ñ A computer-aided drawing term for operations that either
combine (union) two or more three-dimensional solid shapes or remove (subtract) one
2. Computer-Aided Drawing (CAD) Ñ Engineering drawings created on a computer so
they appear as one-dimensional drawings or as three-dimensional solid objects.
3. Engineering/technical graphics Ñ Drawings created for ideation, problem solving, or
documentation of engineered and manufactured objects.
4. Learning Style Ñ An individualÕs typical mode for processing information and
perceiving, thinking, problem solving, and remembering (Keefe, 1979).
ÑField-Dependent Learner - A cognitive style identified by the Embedded Figures
Tests. Individuals with this cognitive style process information globally and
relate elements to the context in which they are contained (Witkins, Oltman,
Raskin & Karp, 1971; Witkins, Moore, Goodenough & Cox, 1977).
ÑField-Independent Learner - A cognitive style identified by the Embedded Figures
Tests. Individuals with this cognitive style process information analytically and
have the ability to isolate individual elements from the context in which they are
contained (Witkins et al., 1971).
5. Primitive Ñ A computer representation of a simple three-dimensional solid object (box,
cone, cylinder, or wedge) that can be combined or removed from other
three-dimensional shapes to create a complex three-three-dimensional computer representation of an
object.
6. Two-dimensional drawing Ñ Drawing confined to the dimensions of height and width.
7. Solid model Ñ A computer drawing that represents an object as a three-dimensional
Summary
Dissertation information will be provided for the remainder of the study in
following order: Chapter 2 will examine the previous research and literature related to this
study, Chapter 3 will provide a description of the studyÕs design and methodology, Chapter
4 will provide a description of the research results, and Chapter 5 will provide a discussion
of the results and recommendations.
The focus of this study was on the effects of studentsÕ major, gender, student
classification, prior computer experience, prior drafting experience, and learning style on
achievement in learning computer-aided drawing and the concepts of technical graphics in
an introductory engineering/technical graphics class at N. C. State. The nature of the study
required the use of intact classes taught by the same instructor, which limited the number of
students in the sample. Key research questions centered on factors that might affect student
achievement in introductory engineering/technical graphics classes that include instruction
in computer-aided drawing. These factors need to be identified before future research in this
Chapter 2
LITERATURE REVIEW Introduction
Experiments in the literature that address the subject of learning styles, prior
computer experience, prior drafting experience, and gender and their relationship to
achievement in learning computer-aided drawing and graphics content are extremely limited
or absent. No study was found that addresses all of these concepts together. In this chapter,
several studies that relate to issues involved in this study will be discussed. The research
and papers described are those that relate to learning styles, achievement, gender and
computer skill development, computer instruction, and drafting instruction.
Theoretical Model
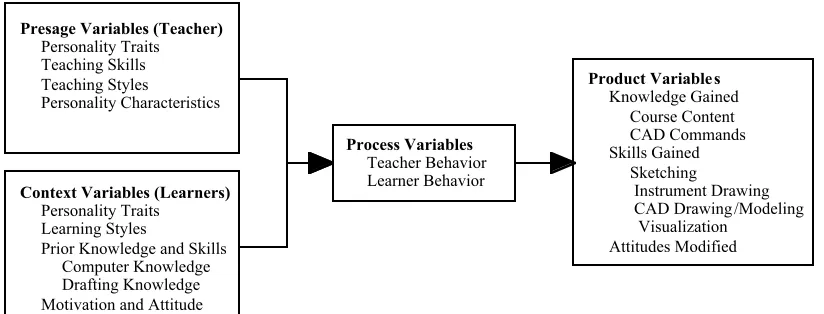
Garton, Spain, Lamberson, and Spiers (1999) presented a model, used by Dunkin
and Biddle, as a guide to the study of teaching and learning. A modified version of this
theoretical model is shown in Figure 1. This model illustrates how learner and teacher
characteristics and behaviors interplay during instruction and affect studentsÕ ability to gain
knowledge, skills, and attitudes from participation in an introductory engineering/technical
graphics course that includes computer-aided drawing instruction. The model serves as a
theoretical framework for this study. However, only the Context Variables (Learner) are
Presage Variables (Teacher)
Personality Traits Teaching Skills Teaching Styles
Personality Characteristics
Context Variables (Learners)
Personality Traits Learning Styles
Prior Knowledge and Skills Computer Knowledge Drafting Knowledge Motivation and Attitude
Process Variables
Teacher Behavior Learner Behavior
Product Variable s
Knowledge Gained Course Content CAD Commands Skills Gained Sketching Instrument Drawing CAD Drawing /Modeling Visualization
Attitudes Modified
Figure 1. Theoretical Learning Model
Learning Styles
Learning style research began in the 1940s, and since then some 19 to 21 cognitive
constructs have been created (Curry, 1983; Thompson & Melancon, 1987). The term
learning style became widely used in the 1970s when research in this field gained
popularity (Dyer, 1995; Morgan, 1997). Learning style instruments are numerous and
include the WitkinsÕ Group Embedded Tests, Dunn and DunnÕs Learning Style Inventory,
GregorcÕs Style Delineator, KolbÕs Learning Style Inventory, and Myers-Briggs
Personality Inventory (Ayersman, 1993; Curry, 1983; Henson & Borthwick, 1984). Lee
(1993) quoted Schmeck as defining learning styles as Òa predisposition on the part of a
studentÕs approach to learning regardless of the specific demands of the learning taskÓ (p.
29).
According to Morgan (1997), the study of learning styles began with research into
introduced by Warner in 1957 and preceded the term cognitive style. Warner theorized that
the biological development of all humans followed a path from a global pattern to one that
was differential, articulated, and hierarchically integrated. He stressed that developmental
changes in humans advance systematically, taking advantage of early stages of growth. In
WarrenÕs view, children proceed through systematic qualitative changes that begin with an
undifferentiated global relationship between the individual and the environment. As the
biological structures grow, the child becomes more independent or differentiated, and more
efficient at creating cooperative interactions between the underlying subsystems.
Although learning styles have been demonstrated to change during the development
of an individual, by young adulthood learning styles have become stable and are persistent
(Haaken, 1988; Hashway & Duke, 1992; Miller, Alway & McKinley, 1987; Sims & Sims,
1995; Witkins et al., 1971) According to Kolb (1981), learning style development is due to
hereditary factors, previous experience, and the needs of the present learning environment.
Researchers believe that learning outcomes are related to a number of interacting variables
including age, intelligence, personality, social experience, and motivation (Lee, 1993).
Learning Style Classifications
The vast number of learning style constructs creates confusion when examining
previous research in this field. Many constructs have been criticized for lack of adequate
research support before being published for use. Another difficulty involves the inability to
relate one learning style model to another when comparing study results. This difficulty
conflicting messages when applying research results to instruction (Curry, 1990; OÕNeil,
1990).
Because of the difficulty involved in grasping the relationship between models,
Curry (1983) examined the underlying concept of several learning style constructs and
developed a classification system for 10 models. The constructs she included in her system
were limited to those for which meaningful data had been collected and reported and
validity and reliability had been established. Her system divided learning styles into three
classifications: instructional preference, information processing, and cognitive personality.
Curry likened these to layers of an onion with the instructional preference models on the
outer layer, the information processing models in the middle layer, and the cognitive
personality models at the core.
The instructional preference models include Frideman and Stritter, Rezler, and
Grasha-Reichmann. Instructional preferences are in the layer that interacts most directly
with the learning environment. Examining the most observable learning behavior,
instructional preference tests have in common their reference to the individualÕs choice of
an environment in which to learn, the individualÕs expectations, the teacherÕs expectations,
and other external features.
The information processing models, in the middle layer of the onion, concern the
individualÕs approach to assimilating information. Models that Curry classifies under this
category are Kolb, Tamir, Elstein and Molidor, and Schmeck and Ribich. All of these
models examine the concept of an individualÕs preference for working at a certain pace and
These models are concerned with the degree a learner wishes to structure and participate in
his or her own learning.
Cognitive personality models, at the innermost layer of the onion, are defined by
Curry as the individualÕs approach to adapting and assimilating information. Models falling
under this category include Witkins, Myers-Briggs, and Kagan. Although all of these share
an examination of an individualÕs approach to adapting and assimilating information, they
do not deal directly with the individualÕs interaction with the environment. They are
concerned with the underlying and relatively permanent personality dimension. They also
reflect the most stable element of the individual, particularly when compared to instructional
preferences that can change to suit the needs of the learning situation and subject matter
being learned (Curry, 1983).
WitkinsÕ Field-Independent and Field-Dependent Cognitive Styles
One of the oldest, most researched, and most recognized of the cognitive style
constructs is that of field-dependence and field-independence (Thompson & Melancon,
1987). This concept has been researched by Herman A. Witkins and others since the 1940s
(Claxton & Ralston, 1978; Hashway & Duke, 1992; Morgan, 1997; Witkins et al., 1971;
Witkins et al., 1977). These cognitive styles relate to a learnerÕs use of an analytical or
global approach to learning, which Witkins referred to as independent and
field-dependent, respectively.
The original research in this area utilized body positioning and rod/frame equipment
tests a physical frame that was not aligned to vertical was placed in front of the participant
as his or her only visual reference. Participants were then asked to align the rod or their
body vertically. These tests determined that some individuals were able to align elements
vertically independent of the frame, and others would align elements with the frame. Later
tests used a simpler arrangement where individuals were asked to find a simple shape in a
more complex figure. The embedded figure tests measure how well an individual can
isolate specific elements within a more complex figure. Analyses of the data obtained by
these tests demonstrate that individuals exist along a continuum from one extreme to the
other (Witkins et al., 1971; Witkins et al., 1977).
According to this bi-polar construct, field-independent learners do not rely on the
learning environment for references. They are able to isolate the essential element from the
whole. In learning situations, they prefer to work alone without extensive direction. They
are exploratory by nature, tend to be introspective, and are not oriented to the social context.
They have an internal structure that enables them to analyze data without outside
information (Doyle & Rutherford, 1984; Morgan, 1997; Witkins et al., 1971; Witkins et al.,
1977).
In contrast, field-dependent individuals are social, outgoing, friendly, and oriented
towards people. They are less able to isolate elements from the context in which they are
presented and have difficulty distinguishing parts of a task from the whole. They prefer
cooperative learning situations and take clues from social situations (Doyle & Rutherford,
The tendency to become field-dependent or field-independent has been
demonstrated to be partially related to environment. For instance, cultures with strong
authoritarian family arrangements tend to have more field-dependent individuals (Morgan,
1997).
Gender seems to have less impact on field preferences. Although WitkinsÕ research
suggested that more females than males are field-dependent (Witkins et al., 1971), recent
research has failed to substantiate his conclusion and indicates that the proportion of
field-dependent and field-infield-dependent individuals in each gender is about equal (Haaken, 1988;
Cooperman, 1980). Haaken (1988) suggested that Witkins may have overinterpreted his
findings to be consistent with the prevailing stereotypes of women held at the time of the
constructÕs development.
Although there is little evidence that gender affects whether an individual is
field-dependent or field-infield-dependent, gender differences do exist. It is known, for instance, that
females are more verbally precocious than males, and males seem to have superior
visual-spatial perception. However, some researchers contend that the difference between female
and male spatial ability is related to their different experiences as they grow up (Jones,
1986).
Field-Neutral Characteristics
There are researchers who believe that individuals should be classified into more
categories than field-dependent and field-independent. Witkins actually espoused a
However, a number of researchers, in order to use the Group Embedded Figures Test
(GEFT) scores as a dichotomy, remove individuals from their data who fall in the midrange
between field-dependent and field-independent. Unfortunately, this eliminates research data
and creates an artificial dichotomy that does not provide information on individuals who are
neither one extreme or the other.
To eliminate this difficulty and still provide a discrete classification system, Dyer
(1995) added a third category to WitkinsÕ construct that he referred to as field-neutral.
DyerÕs inclusion of a field-neutral classification was based on work by Garton and Raven
in 1994. They contended that there was a learning style that existed between the two
extremes of field-independent and field-dependent. In DyerÕs study, which involved high
school students enrolled in Agriculture classes, he used the Group Embedded Figures Test
as the learning style instrument. After administering this test, he observed and interviewed
the subjects to further classify them by learning style. These observations and interviews
lead him to support GartonÕs and Raven's assertion that three styles existed. Dyer found
that individuals with scores in a range from 0 to 8 had field-dependent characteristics,
individuals with scores in a range from 12 to 18 had field-independent characteristics, and
individuals with scores in a range from 9 to 11 had some characteristics of both.
His work indicated that field-neutral individuals require some ÒhintÓ of structure to
perform well in educational endeavors. Although usually intellectual and logical, their
school grades frequently fail to indicate it. They perceive and absorb information abstractly,
but must convert it to a concrete form for use. They are deductive learners, interpersonally
distractions. They like authority in a classroom setting, but prefer independent study. This
mixture of characteristics makes field-neutral individuals unique from their field-dependent
and field-independent classmates.
Learning Styles and Achievement
The literature is not conclusive on the existence of a relationship between learning
styles and student achievement (Curry, 1983, 1990; MacNeil, 1980). Developing a clear
picture of this relationship is complicated by the array of learning style instruments and the
limited information that relates learning style instruments to each other.
Research on achievement and learning style has provided several insights into the
way that field-dependent and field-independent learners differ in their learning environment
needs. The practical implications of this are directly related to student achievement in
various learning environments (Jones, 1986; Liu & Reed, 1994). Many studies have shown
that field-independent individuals, for example, out perform field-dependent individuals in
higher education settings (Liu & Reed, 1994;Smith & Standal, 1981;Witkins et al. 1977)
The literature also suggested that students entering colleges and universities are
predominately field-dependent (Wooldridge, 1995). Witkins et al. (1977) indicated that
field-dependent individuals have a disadvantage in learning situations because they need
more explicit instructions when performing problem-solving tasks. They also suggested
that field-dependent learners are less likely to do as well in math and science because of the
In 1993, Lee examined multiple predictive elements related to achievement in
learning CAD, one of which was learning style. This work was centered on the use of
self-paced, embedded tutorials for AutoCAD known as the Teaching Assistant for AutoCAD
Release 11. The primary question being studied was whether AutoCAD tutorials used in
industry to train adult learners could be successfully used to provide instruction for
architectural students as an independent study course. The population under study was
students enrolled in ARCH 301, Independent Study AutoCAD Workshop, in the School of
Architecture at the University of Illinois.
The tutorials used in the study were embedded, which is a form of computer-aided
instruction (CAI) where the instruction is integrated into the program the tutorials are
designed to teach. These embedded tutorials provided training on the function and use of
the commands in AutoCAD. Because they were written for individuals in industry,
instructions in drawing standards and concepts were not included. The tutorial designers
assumed that individuals using the tutorials would already have a background in this area.
A total of 30 students participated in the study, which examined 12 predictors of
achievement in learning AutoCAD. The predictors examined were interest, relevance,
expectancy, satisfaction, level of computer experience, attitude towards computers, attitude
towards the tutorial, study time, learning styles, AutoCAD exposure in high school, recent
CAD experience, and concurrent AutoCAD experience. Students in the study were allowed
to work at their own pace during the course. At the end of the semester they were given a
posttest on AutoCAD functions, two different questionnaires, and the Kolb Learning Style
The Kolb Learning Style Inventory tests for four abilities: concrete experience (CE),
reflective observation (RO), active experimentation (AE), and abstract conceptualization
(AC) (Kolb, 1981). According to Kolb, these four abilities form the opposing ends of two
separate dimensions (abstract/concrete and active/reflective). From these abilities, Kolb
formulated four distinct learning styles known as the converger, the diverger, the
assimilator, and the accommodator. The Learning Style Inventory is used to determine an
individualÕs preferred style of receiving and organizing information. However, Kolb noted
that individuals may use any one of these styles if the situation warrants (Ayersman, 1993;
Lee, 1993).
The first questionnaire used in the study was given to the students prior to their use
of the tutorials. This questionnaire was designed to collect information about the studentsÕ
previous computer experience, attitude toward computers, and motivation. The second
questionnaire gathered student feedback on the presentation of the tutorials. The researcher
used student observations to determine where misunderstanding of learning sequences
occurred. In addition, he surveyed experts in AutoCAD to solicit their opinions on
appropriate teaching techniques that should be used for AutoCAD instruction. At the end
of the study, a multiple regression analysis was performed on the data. The results of the
study indicated that, of the 12 predictors of achievement, only the level of experience in
computer use, prior exposure to AutoCAD in high school, and attitude toward the tutorials
were significant predictors of CAD achievement. Learning style was not found to be a
Another study that examined learning style and achievement related to computer
instruction was conducted by Sexton, Raven, and Newman in the Spring of 1998 at
Mississippi State University. The primary intent of the study was to determine to what
extent different teaching methods and learning styles influenced agriculture studentsÕ
achievement in a computer applications course. The course was taught as a combination of
lectures, demonstrations, self-paced hypermedia-based laboratories, and class assignments.
The population in the study consisted of 15 female and 28 male agricultural students
at Mississippi State University enrolled in two sections of ASS 4203/6203, Applications of
Computer Technology to Agricultural and Extension Education. This was a required course
for several majors in the College of Agriculture and Life Sciences. The control group
consisted of one section of the course that limited the number of students to an enrollment
of 17. The treatment group consisted of the second section of the course that allowed a
student enrollment of 26. The course was organized into 16 modules and included units on
an introduction to computers, word processing, spreadsheets, the Internet, and presentation
packages. Each learning module consisted of a lecture, a demonstration, and a laboratory
exercise that was followed by a graded lab assignment.
The students in the control group met two days a week, and each student had access
to a computer during class time. The first class meeting each week was devoted to lectures
and class demonstrations. The second class meeting was reserved for laboratory
assignments. The instructor was available to provide individual help to students during
Instruction for students in the treatment group used the same 16 modules, but only
met once a week. During this class meeting they received the same lectures and
demonstrations provided the control group, but laboratory assignments were completed
outside of class. The instructor or a graduate teaching assistant was available in the
computer laboratory 25 hours a week to help students with assignments.
Students in the study were given the Group Embedded Figures Test (GEFT) to
determine their learning styles. A total of 14 homework assignments was assigned to
students during the course. Assignments included in the homework score were a word
processing project, a spreadsheet project, a World Wide Web project, presentation projects,
and a comprehensive lab practical. The two measures used to address authentic learning
were the time it took students to complete the lab practical and the score on a final problem
on the lab practical. The programs used for the lab practicals were Microsoft PowerPoint
97 and Corel Presentations 7.0.
A factorial multivariate analysis of variance was used to test the null hypotheses.
The researchers concluded that there was not a significant difference in the achievement of
the control and treatment groups or the field-dependent and field-independent learners.
Still another study that examined learning style and how it related to performance in
a computer applications course was conducted by Davidson, Savenye, and Orr (1992).
Their research examined learning styles and achievement with achievement measured by the
final exam and final course grades. The Gregorc Style Delineator self-assessment
instrument for identifying and quantifying learning styles of adults was used as the learning
in order. Based on the score of the rankings, four basic learning style abilities are identified.
A score of 27 or higher in a category identifies the dominant ability. These styles are
Abstract Random (AR), Abstract Sequential (AS), Concrete Random (CR), and Concrete
Sequential (CS).
According to this construct, Concrete Sequential (CS) learners are by nature
methodical, deliberate, and instinctive in their thinking. They are also pragmatic and finely
tuned in to their physical senses. CS learners prefer step-by-step conventional instruction.
They learn best in situations that present information in an orderly and efficient manner.
Abstract Sequential (AS) learners prefer abstractions, thoughts, and symbols that
correspond to the concrete, reality-based world. They are sequential learners, but prefer rich
images and lots of detail. They are able to analyze and separate relevant from irrelevant
information in order to grasp key ideas. They are highly verbal and prefer stimulating,
orderly, and quiet learning situations. They also prefer clearly organized and lean
presentations and a quiet atmosphere in which to learn.
Abstract Random (AR) learners experience reality through emotions, imagination,
and feelings. They are subjective learners and base many perceptions on intuition and the
senses. They see the essence of ideas and build themes as they work through information
randomly. They learn best by receiving information in an unstructured manner and prefer
group discussions and sensitive-rich environments.
Concrete Random (CR) learners use the physical world as a laboratory to
investigate ideas. They are capable of examining, disassembling, and changing the
steps used to reach their conclusions. They learn best in a stimulus-rich environment where
they can explore ideas and express opinions. They work well independently or in small
groups (Sexton, Raven & Newman, 1998).
The study used two sections of the computer applications course. These sections
were taught by two different instructors who used similar pedagogical methods to instruct
students. Except for the instructor, the syllabus, course content, outlines, time schedule,
textbook, related instructional materials, and evaluation criteria for the projects and exams
were the same. The study examined the relationships among learning styles and each
performance measure. A total of 68 subjects participated in the study. Analysis of the data
revealed that learners with high abstract sequential abilities had higher performance scores
for computer applications skills and knowledge on their midterm exam, received higher
scores on the second project, received higher scores on the final exam, scored more total
points, and had higher scores on the final grade than did learners with low abstract
sequential ability. Individuals with high abstract random scores showed significant negative
correlations between their learning style scores and their midterm exam grade. Negative
correlations for this group was also found between their final exam grade, the total points
they scored, and their final grade.Students with a high abstract random score also
demonstrated a higher score and a trend towards significance on their project 2 score when
compared to learners with low abstract random scores.
A study conducted by Smith and Standal (1981) that matched learning style to a
particular study technique seemed to demonstrate that a link between achievement and
community college students improve their comprehension of textbook reading assignments.
The study techniques they investigated involved teaching students to visually map or
paraphrase the salient parts of passages from the studentsÕ textbooks. The study used 144
subjects, 52 males and 92 females. Subjects in the study were enrolled in one of six
sections of an introductory psychology course. Two sections were used as a control group
(n = 41), two sections were taught to map text passages (n = 44), and two sections were
taught to paraphrase text passages (n = 59).
The learning style instrument used was the Group Embedded Figures Test. Based
on their scores on this test, students were placed into categories of dependent,
field-independent, or neither. Subjects who scored in the top third of the scores on the GEFT
were classified as field-independent, subjects who scored in the bottom third of the scores
on the GEFT were classified as field-dependent, and subjects who scored in the middle
third of the scores on the GEFT were considered neither. Data from the subjects who
scored in the middle third on the GEFT were not used in the data analyses, although these
subjects fully participated in the study.
For 10 weeks, students in the two treatment groups received 15 to 20 minutes of
training in either mapping or paraphrasing during the Tuesday and Thursday class
meetings. Total training time amounted to about 6.5 hours. The training material consisted
of short passages of 200 words or less taken from the textbooks used in the course. At the
end of the 10-week session, students were given Form B of the Descriptive Test of
Language Skills (DTLS)ÑReading Comprehension. This 30-minute test uses 15 passages
on the test. Fifteen of these assess the ability to understand main ideas, 13 assess the ability
to understand direct statements, and 17 assess the ability to make inferences.
The data were analyzed with a t test and two-way analysis of variance using the
studentsÕ scores on the reading comprehension test as the dependent variable. Results of the
analysis showed that the treatment groups did no better on the comprehension test than the
control group. However, the researchers found a relationship between learning style and
student performance on reading comprehension with field-independent subjects performing
better than field-dependent subjects. Similar results have been demonstrated in other studies
(Witkins et al., 1977).
Teaching Style, Learning Style, and Achievement
In recent years, a major area of research has been the relationship among teaching
styles, learning styles, and student achievement; however, research in this area is still
inconclusive. In 1980, MacNeil reported that the numbers of studies that supported and
failed to support the concept that matching teaching styles to learner styles improves student
achievement were about equal. In more recent research, a larger percentage of studies seems
to support a positive relationship between these variables (Wooldridge, 1995).
A study of achievement in Economics Education, conducted at Purdue University in
the Spring of 1982, examined 600 students and 20 teachers to see if a link between teaching
and learning style could be demonstrated (Charkins, OÕToole & Wetzel, 1985). As a
measure of learning style, the researchers used the Grasha-Reichmann Learning Styles
categories: dependent, collaborative, and independent. The researchers used the same
questionnaire to classify instructors participating in the study. Control groups were not part
of the research design.
According to the Grasha-Reichmann learning style construct, dependent learners
generally prefer a teacher-directed and highly structured course, collaborative learners
prefer a discussion class with a high degree of student interaction, and independent learners
like to influence the content and structure of the class. In this study, student scores were
compared to teacher scores in order to determine the degree of conflict between the teaching
and learning style.
The study used a general learning and attitude model that was based on work by
McKenzie and Staff, Bloom, Allison, Manahan, and others (Charkins, OÕToole & Wetzel,
1985). The models were:
Achievement = F(Ability, Attitude, Effort, Quality of Instruction)
Attitude = F(Ability, Achievement, Effort, Socioeconomic Factors, Quality of
Instruction)
The researchers added to this model the independent variable of a
teaching/learning-style link. As a measure of each studentÕs ability, the researchers used the studentÕs
Scholastic Aptitude Test (SAT) score. As a measure of each studentÕs knowledge of
economics, they used the Test of Understanding College Economics (TUCE).
From the linear regression model for achievement in economics, the researchers
found the following statistically significant components: the expected grade, SAT verbal
dependent instructorÕs teaching-style score and a dependent learnerÕs learning-style score.
From the linear regression model for attitude, the researchers found the statistically
significant components included the expected grades, hours students studied for the course,
the studentÕs pre-attitude-toward-economics score, the percentage of change in TUCE
score, and the absolute value of the difference between a dependent instructorÕs
teaching-style score and a dependent learnerÕs learning-teaching-style score.
The researchers in this study concluded that there was a link between learning style,
teaching style, and student gains in understanding economics. They also found that the
greater the deviation between a studentÕs learning style and a teacherÕs teaching style, the
less positive the studentÕs attitude towards economics (Charkins, OÕToole & Wetzel, 1985).
In another study that examined learning and teaching styles by MacNeil (1980), he
failed to find a relationship between the two. MacNeilÕs study began with a sample of 72
students, who volunteered to participate, from a group of students enrolled in courses
offered by the Recreation Education Program at a Big Ten university during the Spring
Semester of 1979. He used the Group Embedded Figures Test to determine the studentÕs
learning style. After giving students this test, he eliminated students who scored 13 (the
studentÕs median score) from the sample. He then defined students who scored from 1-12
as field-dependent and students who scored from 14-18 as field-independent. This left a
sample size of 64, 32 field-dependent students and 32 field-independent students. These
students were randomly assigned to one of the experimental groups or the control group,
with the restriction that the number of field-dependent and field-independent students be
The instructor style was classified into three different categories: discovery,
expository, and no treatment. MacNeil defined the discovery teacher style as one that is
student-centered. Teachers with this teaching style use discussion, group projects,
role-playing, self-paced worksheets, and group problem-solving as their dominant modes of
instruction. He defined the expository teacher style as one that is teacher-centered. Teachers
with this teaching style predominately use lectures, teacher demonstrations, and a large
degree of instructor guidance in their teaching. The no treatment (control group) was used
to reflect the baseline of receiving no instruction. This group was only given the Group
Embedded Figures Test.
The study treatment consisted of five one-hour competency-based group
instructions designed by the researcher. For each treatment group the instructional materials
were identical. The instructors involved in the study were three graduate level teachers who
received four hours of instruction by the researcher to prepare them to teach in the different
teaching styles. In addition, the student instruction sessions were attended by the researcher
to closely monitor the instructorsÕ adherence to their assigned teaching style and the
instructional content.
The two levels of learning style and the three levels of instructor style were used to
form a 3 X 2 factorial design. The change in student performance was determined by the
Behavior Modification Achievement Test (BMAT), which was an instrument designed by
the researcher. This test consisted of fifty objective questions drawn directly from the
BMAT of 0.95 was determined by the Spearman-Brown Prophecy Formula. The BMAT
was used as both a pretest and posttest in the study.
An assessment, which primarily focused on a validation of the instructional styles,
was performed to evaluate the success of the manipulation of the independent variables in
the study. This assessment, in the form of a questionnaire given to the 42 students in the
treatment groups, asked the students a series of questions. The questions related to the flow
and sequencing of critical information in the course and the level of guidance provided by
their instructor.
The results of the study indicated that instruction had a significant effect on the
learning performance of the treatment groups when compared to the control group, but
there was not a significant difference in the change in learning performance between the
treatment groups. The results suggest the subject matter and the instrument used by the
researcher may not have been difficult enough to reveal a difference in the groups. Another
contributing factor could have been that the instructors used in the study were
field-dependent (MacNeil, 1980).
Gender Differences in Computer Training
A number of studies suggest that there is a difference in malesÕ and femalesÕ
achievement and attitudes related to computer use. Females on the whole demonstrate less
interest in computers, less confidence in their abilities to use computers, and lower
achievement when using computers (Arch & Cummins, 1989; Chen, 1986; Francis, 1994;
of the literature revealed that these differences seem to have persisted over the years even
with an increase in computer use in public schools and private homes.
In a California statewide assessment of computer literacy between the years of 1982
and 1983, Fetler (1985) examined sixth-grade and twelfth-grade boys and girls. In his
study, Fetler used a test designed by specialists from the public school system, universities,
and industry. The test, the Survey of Basic Skills, assessed instructional objectives in the
area of computer literacy as well as attitudes towards computer technology and relevant
computer experiences. The test questions for the six-graders were a subset of the test
questions for the twelfth-graders, and multiple versions of these tests were prepared for the
study. The twelfth-grade part of the study included 87 schools and had an estimated return
rate of 88%. Each of the 430 cognitive test questions was answered by approximately 200
students, each of the 13 attitude questions was responded to by approximately 1,200
students, and the background questions were responded to by approximately 4,800
students. For the sixth-grade part of the study, the Survey of Basic Skills was administered
to 293,717 students. Test forms were assigned randomly with each school receiving
approximately the same number of each form. Each question related to computers was
given to an average of 7,343 students with a non-response rate between 4 and 6%.
In both halves of the study, Fetler found that the sixth-grade and twelfth-grade boys
outpaced the girls in computer literacy. The in-depth analysis of the data revealed that under
three headings (performance, attitudes, and experience) the twelfth-grade boys
outperformed girls in every major objective area except one. That objective, which failed to
strengths in the areas of computer functions and uses, impact on life, hardware, and
computer science problem solving.
The sixth-grade boys demonstrated a superior performance over the girls except in
the use of systematic procedures, which was a subset of problem-solving and not directly
related to computer skills and abilities. The sixth-grade boys showed particular strength in
the areas of vocabulary, system components, history, and simple programs.
In the area of attitudes towards computers, the twelfth-grade boys and girls differed
significantly on two statements. The girls were more likely to believe that computers
slowed down and complicated business operations and computers could not make
mathematics more interesting.
The sixth-grade boysÕ and girlsÕ attitudes differed on more issues than the
twelfth-grade students. The sixth-twelfth-grade girls were less likely to see that computer skills could help
someone get a better job, that someday most things would be run by computers, and that
computers could make mathematics more interesting. The girls also appeared to have a less
positive attitude towards computers than the boys.
In the examination of computer experience, more twelfth-grade boys than girls
reported they learned about computers from having them in their home, learned about them
from friends, and learned about them from video games. Similar results were found for the
sixth-grade students. Although the boys and girls who had taken computer courses had
similar levels of computer experience through course work, more of the girls reported they
school and video games at home. The researcher hypothesized that the girls' computer
performance would be lower because they had fewer computer experiences than the boys.
In a study with college students (Ogletree & Williams, 1990), gender was again
examined in relationship to attitudes and aptitudes related to computers. Students used in
this study were enrolled in two sophomore-level human sexuality classes at a central Texas
university. The sample consisted of 47 men and 78 women. During the first class, students
completed a questionnaire on their computer backgrounds and demographics. After
completing the questionnaire, they were asked to respond to a slightly modified version of
the Bem Sex Role Inventory (BSRI), which measures an individualÕs degree of masculine
and feminine characteristics, and the Computer Attitude Scales. During the same class,
students completed a modified version of the Self-Efficacy Questionnaire and the Computer
Aptitude Test adapted by Dambrot et al. The Computer Aptitude Test asked students to
rank their self confidence and ability to complete five computer programming tasks,
complete five computer science courses, and use the computer for five personal projects.
The five-point Likert scale used by the instrument ranged from: Ònot at all confident/canÕt
doÓ to Òcompletely confident/can do.Ó
When surveyed, approximately 85% of the participants indicated that they did not
currently own a computer, and about 63% indicated that their family did not own a
computer. Only 34% indicated that they used a computer more than an hour a week.
Initial comparisons by gender found similar results as previous studies. Analysis of
the data on the Computer Attitude Scale revealed that the males demonstrated a more