ABSTRACT
FIALLOS, MAX. Developing a Cost Model for Sourcing Products for Different Distribution Channels. (Under the direction of Dr. Kristin Thoney and Dr. Jeffrey Joines.)
Apparel sourcing operations are extremely complex due to the intricacies of a global supply chain. Sourcing decisions should not be made without an exhaustive analysis of supply chain cost structures. Landed costs must be analyzed for sourcing decisions, but they must be complemented by information of the effects of supplier lead times and consumer-retail interactions, which are critical to overall supply chain performance. A focus on cost of goods alone gives insufficient importance to the negative effects related to forecast errors when sourcing from regions with long lead times.
A supply chain cost model has been developed in this study. The model looks at cost structures for the entire supply chain from fiber to retail. The cost model shows the accrual of costs throughout each processing step within the textile and apparel industry. It also identifies costs related to international trade, including transportation costs and duties paid upon entry to the United States. The study examines the supply chain processes and costs for producing t-shirts and denim jeans in distinct regions of the world. Trade agreement duty provisions, world cotton market price competitiveness, export tax rebates, and labor rates significantly affect a countries’ competitiveness in the textile and apparel industry.
Developing a Cost Model for Sourcing Products for Different Distribution Channels
by
Max Eduardo Fiallos
A thesis submitted to the Graduate Faculty of North Carolina State University
in partial fulfillment of the requirements for the Degree of
Master of Science Textiles
Raleigh, North Carolina 2009
APPROVED BY:
Dr. Kristin A. Thoney, Associate Professor, Textile & Apparel, Technology & Management
Co-Chair of Advisory Committee
Dr. Jeffrey A. Joines, Associate Professor, Textiles Engineering, Chemistry and Science
Co-Chair of Advisory Committee
Dr. Russell E. King, Professor, Industrial and Systems Engineering
ii DEDICATION
iii BIOGRAPHY
iv
ACKNOWLEDGEMENTS
I would like to extend my utmost gratitude to Dr. Kristin Thoney, Dr. Jeff Joines, Dr. Russell King, and Dr. Gilbert O’Neal for their support and guidance throughout this process.
I also thank the Institute of Textile Technology for the opportunities to interact with industry, for funding provided to me, and enriching my overall graduate study experience. I express my thanks to all ITT staff and Patrice Hill in particular. Your efforts are very much appreciated.
My appreciation is extended to the United States Department of State, The Fulbright Foreign Student Program, and the American people for the opportunity provided me to study in the United States.
v
TABLE OF CONTENTS
LIST OF FIGURES ... vii
LIST OF TABLES ... ix
LIST OF EQUATIONS ... xi
1 Introduction ... 1
1.1 Problem Statement ... 1
1.2 Research Objectives and Research Value ... 2
2 Literature Review ... 4
2.1 Supply Chain Management ... 4
2.2 Sourcing and Supply Chain Responsiveness ... 6
2.2.1 Traditional Sourcing... 9
2.2.2 Quick Response (QR) ... 9
2.2.3 Collaborative Planning, Forecasting and Replenishment (CPFR®) ... 12
2.3 Consumer Demand Forecasting, Stockouts and Markdowns ... 12
2.4 Costing ... 14
2.4.1 Manufacturing Cost Models ... 15
2.4.2 Apparel Costing ... 15
2.5 Logistics ... 18
2.6 Global Trade ... 19
2.7 Sourcing Simulator™ ... 21
3 Methodology ... 26
3.1 Product Selection ... 26
3.2 Supply Chain Routes ... 27
3.3 Landed Cost Components ... 27
3.4 Sourcing Simulator™ ... 28
4 Sourcing Cost Model ... 29
4.1 The Textile, Apparel, and Retail Supply Chain ... 30
4.2 Manufacturing Inputs ... 32
4.2.1 Labor ... 33
4.2.2 Energy ... 34
4.2.3 Water ... 36
4.2.4 Steam ... 36
4.3 Textile Operations ... 38
4.3.1 International Production Cost Comparison... 38
4.3.2 Wet Processing ... 60
4.4 Apparel Operations ... 75
4.4.1 Fabric and Trims for a T-Shirt ... 76
vi
4.4.3 Energy for a T-Shirt ... 82
4.4.4 Off-quality and Process Yield for a T-Shirt ... 84
4.4.5 Capital Cost for a T-Shirt... 85
4.4.6 Export Rebate Taxes for a T-Shirt ... 87
4.5 Logistics, Trade, and Landed Costs for a T-Shirt ... 88
4.6 Landed Cost for T-Shirts Using Open-End Yarn ... 93
4.7 Apparel Conversion Costs for a Denim Bottom ... 94
4.8 Yarn-Forward vs. Fabric-Forward ... 105
4.9 Landed Cost for Jeans Using Ring Spun Yarn ... 106
4.10Discussion of Supply Chain Costs ... 107
4.11Retail Operations and Simulations ... 110
4.11.1Retail Performance Simulations for T-Shirts ... 110
4.11.2Retail Performance Simulations for Denim Jeans ... 113
5 Conclusions ... 115
6 Future Works ... 118
vii
LIST OF FIGURES
Figure 2.1: Customer Service Levels Affect Re-Order Lead Times (Lowson, 2003) .... 8
Figure 2.2: Customer Service Levels Affect Supplier Performance (Lowson, 2003) .... 8
Figure 2.3: Customer Service Levels Affects Inventory (Lowson, 2003) ... 9
Figure 2.4: Changes in Sourcing Practices for Seasonal Products in the UK (adapted from Butler, 2008) ... 10
Figure 4.1 - Textile, Apparel, Retail Supply Chain for T-Shirts ... 31
Figure 4.2 - Textile, Apparel, Retail Supply Chain for Denim Bottoms ... 32
Figure 4.3 - Cotton Prices (ITMF, 2008) ... 41
Figure 4.4 - Ring Yarn Manufacturing Costs in $/kg (adapted from ITMF, 2008) .... 42
Figure 4.5 - Ring Yarn Total Costs in $/kg (adapted from ITMF, 2008) ... 43
Figure 4.6 – Open-End Yarn Manufacturing Costs in $/kg (adapted from ITMF, 2008) ... 44
Figure 4.7 – Open-End Yarn Total Costs in $/kg (adapted from ITMF, 2008) ... 45
Figure 4.8 – Single Jersey Knitting Manufacturing Costs in $/m (adapted from ITMF, 2008) ... 47
Figure 4.9 - Single Jersey Fabric Total Costs in $/m (adapted from ITMF, 2008) .... 48
Figure 4.10 - Greige Knit Fabric Costs in $/m, excluding Raw Materials for ITMF and non-ITMF Countries ... 51
Figure 4.11 – Greige Knit Fabric Costs in $/m for ITMF and non-ITMF Countries .... 52
Figure 4.12 - Weaving Manufacturing Costs in $/m (adapted from ITMF, 2008) ... 53
Figure 4.13 - Woven Fabric Total Costs in $/m (adapted from ITMF, 2008) ... 54
Figure 4.14 – Woven Denim-Weight Fabric Total Cost in $ per Meter of Fabric ... 56
Figure 4.15 – Greige Woven Fabric Costs in $/m, excluding Raw Materials for ITMF and non-ITMF Countries ... 59
Figure 4.16 – Greige Woven Fabric Costs in $/m for ITMF and non-ITMF Countries 59 Figure 4.17 - Energy Consumption for a Cotton Shirt (adapted from Stegmaier, 2007) ... 61
Figure 4.18 – Piece Dyeing Processing Cost in $/lb of Knit Fabric, Excluding Dyes and Auxiliary Chemicals ... 64
Figure 4.19 – Piece Dyeing Processing Cost in $/lb of Knit Fabric, Including Dyes and Auxiliary Chemicals ... 64
Figure 4.20 - Drying and Compacting Costs in $ per Meter of Knit Fabric ... 67
Figure 4.21 – Finished Knit Fabric Cost in $/m ... 68
Figure 4.22 – Rope Dyeing Processing Cost in $/lb of Warp Yarn, Excluding Dyes and Auxiliary Chemicals ... 71
viii
Figure 4.24 – Denim Fabric Finishing Costs in $ per Meter ... 74
Figure 4.25 – Finished Denim Fabric Costs in $ per Meter ... 75
Figure 4.26 – Fabric Cost per T-Shirt ... 78
Figure 4.27 – Apparel Conversion Labor Cost per T-Shirt ... 81
Figure 4.28 – Apparel Conversion Energy Cost per T-Shirt ... 84
Figure 4.29 - Comparison of Transportation Costs for 40 ft Containers Assuming Bunker Surcharges are Directly Proportional to Oil Prices ... 91
Figure 4.30 – Fabric Cost per Denim Jean ... 95
Figure 4.31 – Apparel Conversion Labor Cost per Denim Jean ... 97
Figure 4.32 – Apparel Conversion Energy Cost per Denim Jean ... 99
ix LIST OF TABLES
Table 4.1 - Fully Loaded Hourly Labor Rates ... 34
Table 4.2 - Electrical Energy Rates ... 35
Table 4.3 - Water Rates ... 36
Table 4.4 - No. 6 Residual Fuel Oil Rates ... 37
Table 4.5 - Steam Rates ... 37
Table 4.6 - Ring Yarn Manufacturing Costs in $/kg (adapted from ITMF, 2008) ... 42
Table 4.7 - Ring Yarn Total Cost in $/kg (adapted from ITMF, 2008) ... 43
Table 4.8 - Open-End Yarn Manufacturing Costs in $/kg (adapted from ITMF, 2008) ... 44
Table 4.9 - Open-End Yarn Total Costs in $/kg (adapted from ITMF, 2008) ... 45
Table 4.10 - Single Jersey Knitting Manufacturing Costs in $/m (adapted from ITMF, 2008) ... 46
Table 4.11 - Single Jersey Fabric Total Costs in $/m (adapted from ITMF, 2008) ... 47
Table 4.12 - Forty-foot Container Shipping Rates ... 49
Table 4.13 - Greige Knit Fabric Costs in $/m for all Countries ... 51
Table 4.14 - Weaving Manufacturing Costs in $/m (adapted from ITMF, 2008) ... 53
Table 4.15 - Woven Fabric Total Costs in $/m (adapted from ITMF, 2008) ... 54
Table 4.16 – Woven Denim-Weight Fabric Total Cost in $ per Meter of Fabric ... 56
Table 4.17 – Greige Woven Fabric Costs in $/m for all Countries ... 58
Table 4.18 - Resource Consumption Rates per Pound of Knit Fabric for Piece Dyeing ... 62
Table 4.19 - Piece Dyeing Costs in $/lb and $/m of Knit Fabric... 63
Table 4.20 - Drying and Compacting Costs in $ per Meter of Knit Fabric ... 66
Table 4.21 – Finished Knit Fabric Cost in $ per meter ... 68
Table 4.22 – Hourly Resource Consumption Rates for Rope Dyeing ... 69
Table 4.23 – Rope Dyeing Costs in $/lb of Warp Yarn and $/m of Woven Fabric .... 71
Table 4.24 – Denim Fabric Finishing Costs in $ per Meter of Fabric ... 73
Table 4.25 – Finished Denim Fabric Costs in $ per Meter ... 75
Table 4.26 - Fabric Cost per T-Shirt ... 77
Table 4.27 - Trim Requirement and Costs for a Floor-ready T-Shirt ... 79
Table 4.28 – Apparel Conversion Labor Cost per T-Shirt ... 81
Table 4.29 – Apparel Conversion Energy Cost per T-Shirt ... 83
Table 4.30 – Apparel Conversion Process Yield Cost per T-Shirt ... 85
Table 4.31 – Exit-Factory, Export Tax Rebate, and FOB Values per T-Shirt ... 88
x
Table 4.34 - Landed Cost per T-Shirt ... 93
Table 4.35 - Landed Cost per T-shirt Using Open-end Yarn ... 94
Table 4.36 – Fabric Cost per Denim Jean ... 95
Table 4.37 – Trim Requirement and Cost for a Floor-Ready Denim Jean ... 96
Table 4.38 – Apparel Conversion Labor Cost per Denim Jean ... 97
Table 4.39 – Apparel Conversion Energy Cost per Denim Jean ... 99
Table 4.40 – Denim Jean Dry Processing and Washing Costs in $ per Garment .... 100
Table 4.41 – Apparel Conversion Process Yield Cost per Denim Jean ... 102
Table 4.42 – Exit-Factory, Export Tax Rebate, and FOB Values per Denim Jean ... 104
Table 4.43 – Maritime Transit Times in days and Transportation Costs per Denim Jean ... 104
Table 4.44 – Landed Cost for Denim Jeans ... 105
Table 4.45 – Yarn-forward and Fabric-forward Garment Costs ... 106
Table 4.46 – Jeans Landed Cost Using Ring Spun Yarn ... 106
Table 4.47 – Optimal Retail Performance Metrics for T-Shirts of Open-End Yarn .. 112
Table 4.48 – Optimal Retail Performance Metrics for T-Shirts of Ring Spun Yarn .. 112
Table 4.49 – Optimal Retail Performance Metrics for Denim Jeans of Open-End Yarn ... 114
xi
LIST OF EQUATIONS
Equation 4.1 – Cost of Steam in $ per kilogram of steam ... 37
Equation 4.2 – Cost of Yarn including Shipping Costs in $ per Meter of Knit Fabric . 49 Equation 4.3 – Cost Calculations for non-ITMF Countries ... 50
Equation 4.4 – Yarn Cost per Meter of Woven Fabric ... 55
Equation 4.5 – Labor Cost for Piece Dyeing in $ per Pound of Knit Fabric ... 62
Equation 4.6 – Energy Cost for Piece Dyeing in $ per Pound of Knit Fabric ... 62
Equation 4.7 – Steam Cost for Piece Dyeing in $ per Pound of Knit Fabric ... 62
Equation 4.8 – Water Cost for Piece Dyeing in $ per Pound of Knit Fabric ... 63
Equation 4.9 – Chemical and Dye Cost for Piece Dyeing in $ per Pound of Knit Fabric ... 63
Equation 4.10 – Labor Cost for Drying and Compacting in $ per Meter of Knit Fabric ... 65
Equation 4.11 – Energy Cost for Drying and Compacting in $ per Meter of Knit Fabric ... 66
Equation 4.12 – Steam Cost for Drying and Compacting in $ per Meter of Knit Fabric ... 66
Equation 4.13 – Knit Fabric Cost in $ per Meter including Dyeing, Drying and Compacting ... 67
Equation 4.14 – Labor Cost for Rope Dyeing in $ per Pound of Dyed Warp Yarn .... 70
Equation 4.15 – Energy Cost for Rope Dyeing in $ per Pound of Dyed Warp Yarn .. 70
Equation 4.16 – Steam Cost for Rope Dyeing in $ per Pound of Dyed Warp Yarn ... 70
Equation 4.17 – Water Cost for Rope Dyeing in $ per Pound of Dyed Warp Yarn ... 70
Equation 4.18 – Chemical and Dye Cost for Rope Dyeing in $ per Pound of Dyed Warp Yarn ... 70
Equation 4.19 – Labor Cost for Finishing Denim Fabric in $ per Meter of Fabric ... 73
Equation 4.20 – Energy Cost for Finishing Denim Fabric in $ per Meter of Fabric .... 73
Equation 4.21 – Steam Cost for Finishing Denim Fabric in $ per Meter of Fabric .... 73
Equation 4.22 – Water Cost for Finishing Denim Fabric in $ per Meter of Fabric ... 73
Equation 4.23 – Denim Fabric Cost in $ per Meter including Dyeing and Finishing .. 74
Equation 4.24 – Fabric Cost per T-Shirt ... 77
Equation 4.25 – Trim Cost per T-Shirt ... 79
Equation 4.26 – Apparel Conversion Direct Labor Cost per T-Shirt ... 80
Equation 4.27 – Apparel Conversion Indirect Labor Cost per T-Shirt ... 81
Equation 4.28 – Apparel Conversion Energy Consumption per T-Shirt ... 82
Equation 4.29 – Apparel Conversion Energy Cost per T-Shirt ... 83
Equation 4.30 – Apparel Conversion Process Yield Cost per T-Shirt ... 85
xii
Equation 4.32 – Exit-Factory Cost per T-Shirt... 87
Equation 4.33 – Export Tax Rebate per T-Shirt ... 88
Equation 4.34 – Transportation Cost per T-Shirt ... 90
Equation 4.35 – Duty Cost per T-Shirt ... 93
Equation 4.36 – Fabric Cost per Denim Bottom ... 95
Equation 4.37 – Labor Cost for Denim Jean Dry Processing ... 100
Equation 4.38 – Water Cost for Denim Jean Washing ... 100
Equation 4.39 – Apparel Conversion Process Yield Cost per Denim Jean ... 102
Equation 4.40 – Capital Cost per Denim Jean ... 103
Equation 4.41 – Exit-Factory Cost per Denim Jean ... 103
1
1
Introduction
As sourcing of textile and apparel products continues to shift toward Asia, retailers are faced with managing an increasingly complex procurement strategy. Sourcing products from Asia requires planning for long lead times and heavy reliance on sales forecast data. The inaccuracies of forecasts can create inventory stockouts or surplus inventory at the end of selling seasons. Both scenarios negatively affect a company’s profitability. This research project will compare supply chains with short lead time against supply chains with low cost manufacturing with lengthier lead times and their ability to minimize forecast error effects on retail performance.
1.1
Problem Statement
In some instances, sourcing decisions are based on limited information, primarily focused on labor costs while paying little attention to other critical information. Asia has become the major producer of apparel goods, in part due to their highly competitive labor rates. Sourcing from Asia implies having longer lead times to the United States, compared to the responsiveness of other areas of the world. Given replenishment is not a viable option in some cases when sourcing from Asia, there is an increased reliance on forecast data.
2
demand as well as the stock-keeping unit (SKU) mix. Unfortunately, placing replenishment orders to better service true demand is not a viable alternative due to long lead times; there is an imbalance between in-season replenishment requirements and far-east lead times.
In an attempt to have improved consumer service levels, retailers often order above-forecasted quantities of goods. The improved service levels come at the high cost of diminished profit margins given excess inventory has to be marked down, also referred to as discounted or “put on sale”, at the end of selling seasons. Not only is it common for retailers to have excess inventory at the end of selling seasons, but often they have inadequate SKU mixes in inventory (i.e., carry the wrong styles, colors, and/or sizes), which ultimately results in stockouts and lower service levels during the selling seasons.
1.2
Research Objectives and Research Value
This research addresses the issues of cost and lead time associated with various textile supply chains. The specific objectives of the research are:
1. to develop a cost model for sourcing apparel goods;
3
3. to analyze performance of different global supply chains, as related to landed costs and lead times;
4. to build upon previous research performed by Lisa Hartman (ITT Fellow of 2006) by reducing assumptions and validating the results by using specific data from the new cost model.
The objectives of the research project are beneficial to improving retail sourcing practices and to identify opportunities for textile and apparel production in the western hemisphere. The cost model aims to improve sourcing decisions by including all landed costs associated with an item and avoid focusing excessively on labor costs. Identifying apparel product types that should be sourced within short lead time regions aids justifying producing more textile and apparel products within the western hemisphere.
4
2
Literature Review
The following sections review supply chain management issues related to the sourcing of products. Different sourcing strategies and their supply chain structure’s ability to respond to consumer demand fluctuations are included. Also, an examination of product and sourcing costing practices are presented. Finally, a review of the Sourcing Simulator™ software system and sourcing simulation capabilities is presented.
2.1
Supply Chain Management
According to the Council of Logistics Management the definition of supply chain management is the systemic, strategic coordination of the traditional business functions and the tactics across these business functions within a particular company across businesses within the supply chain for the purposes of improving the long-term performance of the individual companies and the supply chain as a whole. Another, more simple, definition of supply chain management is the integration of key business processes from the end user through original supplier that provides products, services, and information that add value for customers and other stakeholders (Long, 2003).
5
process for all entities involved and creates value-added products for consumers (Long, 2003). It is of utmost importance for sourcing decisions to include looking into the strengths and weaknesses of complete supply chains as this will have a significant impact on overall sourcing strategy performance.
As an industry example of supply chain leadership, Apparel Magazine documents how J.C. Penney leads the retail industry in best practices and innovation relating to global supply chain management. J.C. Penney has focused on improving speed to market of goods, vendor consolidation, and logistics to gain an edge in the marketplace. The company has developed and implemented factory-to-store supply systems for specific goods. Suppliers reduced shipping lead times within five and seven days of receiving orders and therefore are able to respond to actual consumer demand patterns. By being able to service actual consumer demand, J.C. Penney has been able to reduce stockouts and ultimately increase sales. Direct shipment from factory to stores has helped reduce warehousing costs by simply bypassing warehouses altogether. Another way in which J.C. Penney has improved their supply chain is by accelerating their product development capabilities. The concept-to-consumer cycle has been reduced from two years to forty-five days in some cases. Such reductions in product development time are highly advantageous.
6
TPAT) program it can move its goods through customs rapidly. It has decided to diversify the ports it uses to avoid congestion in ports such as Los Angeles, and now it brings some of its shipments from India, Sri Lanka, and other neighboring countries through east coast ports, such as New Jersey, Savannah, and Charleston. J.C. Penney also supports logistics operations with leading edge information technology systems, such as i2, Teradata, ClearTrack, Oracle forecasting engines, and Avery Dennison InfoChain Express. They also benefits from smooth flow of goods from suppliers to stores by collaborating with their partners to ensure products are floor-ready (Atkinson, 2006).
2.2
Sourcing and Supply Chain Responsiveness
7
A high level simulation model on outsourcing from Asia developed by Kumar and Arbi (2008) provides insight on how supply chains can be more responsive. The study suggests how IT systems can be leveraged to reduce lead times. One of the supply chain synergies the author recommends is forming long term partnerships. The partnerships can reduce order processing times if both sides agree to a common IT platform.
8
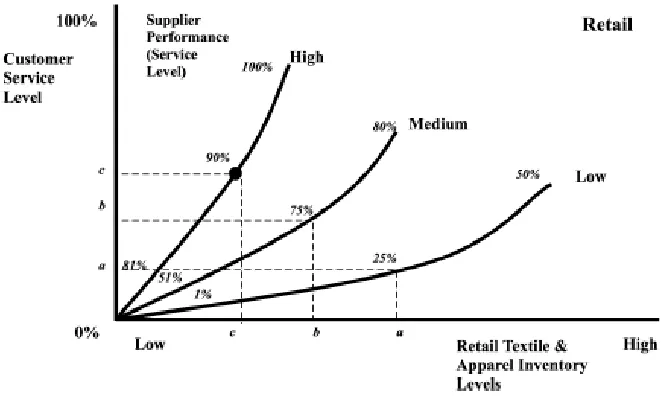
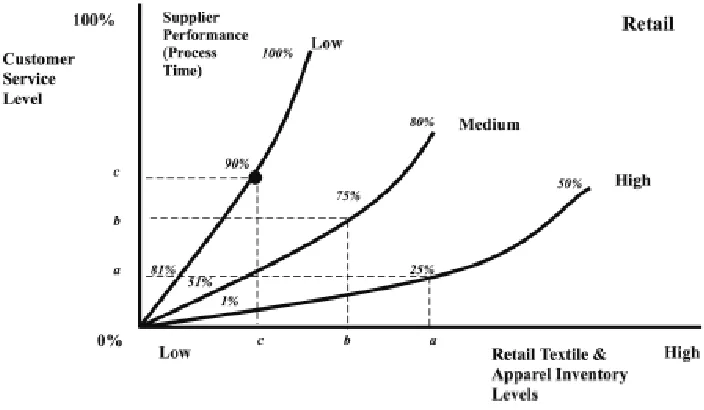
Figure 2.1: Customer Service Levels Affect Re-Order Lead Times (Lowson, 2003)
9
Figure 2.3: Customer Service Levels Affects Inventory (Lowson, 2003)
2.2.1 Traditional Sourcing
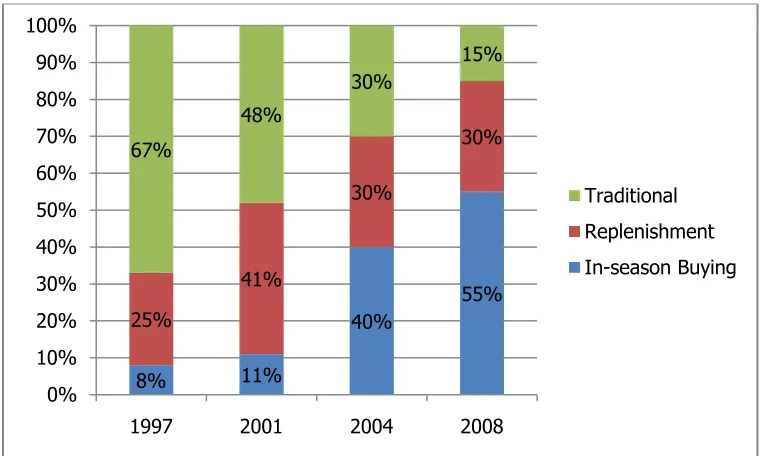
Traditional sourcing is a procurement method which aims to have all goods forecasted to sell available before an actual selling season begins. This strategy has no in-season reorders and cannot respond to actual demand fluctuations (Hartman, 2006). This type of practice is becoming less commonly used by some importing countries. For example, the United Kingdom has reduced their traditional sourcing of seasonal products from 67% in 1997 to 15% in 2008 (Butler, 2008).
2.2.2 Quick Response (QR)
10
name implies, supplies products with quick turn times. This enables orders to be placed more closely to and within selling seasons and therefore have better product offering accuracy. QR can improve returns, flexibility, and customer service levels (Hunter, 2002). This practice has been increasingly adopted for sourcing seasonal products in recent years in the United Kingdom. In-season buying and replenishments, which are related to quick response, has also become more widely used (Butler, 2008). Figure 2.4 depicts the changes the UK has adopted for seasonal product sourcing.
Figure 2.4: Changes in Sourcing Practices for Seasonal Products in the UK (adapted from Butler, 2008) 8% 11% 40% 55% 25% 41% 30% 30% 67% 48% 30% 15% 0% 10% 20% 30% 40% 50% 60% 70% 80% 90% 100%
1997 2001 2004 2008
11
Consumer satisfaction is a key performance indicator of retail operations, as repeated patronage is linked with customer satisfaction. A study by Ko (2007) recently focused on examining how quick response techniques (QRT) by retailers affect customer satisfaction. The study divided store attributes into QRT-related and non-QRT attributes. Some of the QRT-related retail store attributes were availability of advertised products, accuracy of advertised products, price for value, new/fresh merchandise, and checkout time, among others. Some non-QRT store attributes were after-sale service, location of store, parking facilities, store hours, and others.
The study analyzed three types of shopping orientations of customers: fashion focused, economy focused, and shopping time focused. The 232 women study found that QRT practices yield great customer satisfaction to fashion focused and economy focused customers. This is due to low levels of stockouts, quick merchandise turnaround, and high value service for reasonable pricing (Ko, 2007).
12
2.2.3 Collaborative Planning, Forecasting and Replenishment (CPFR®)
A concept very similar to quick response, and one of the latest developments in supply chain optimization, comes from collaborative efforts and partnership ideologies. Collaborative Planning, Forecasting and Replenishment (CPFR®) is a business practice which aims to combine the intelligence of all supply chain participants in the planning and fulfillment of customer demand, specifically by making consumer demand intelligence available to all partners. By linking all processes, CPFR® aims to improve the availability of goods to consumers, reduce inventory, transportation and logistics costs. Case studies of CPFR® projects have shown improvements of in-stock percentage of up to 8% and a total supply chain inventory reduction of 10 to 40% (Voluntary Interindustry Commerce Solutions, 2008).
2.3
Consumer Demand Forecasting, Stockouts and Markdowns
13
been sewn to allow consumer color preference data to be more accurate, but this approach is limited in application (Yeh, 2003).
Research finds that apparel retailers in the United States lose $64 billion per year due to markdowns. Some of the retailers allocate half of their planning resources to managing markdowns. About five percent of excess product inventory is pushed to off-price retail channels (Kurt Salmon Associates, 2008). Leading sourcing consultant, David Birnbaum, has been quoted saying “retailers can no longer bear the burden of the markdown epidemic. Going forward factories will be forced either to participate in the markdown loss (which will eventually bankrupt them) or work to solve the problem once and for all” (Nichols, 2008).
Recent benchmark studies performed by Retail Systems Research further detail how common forecasting error affects business performance. More than fifty percent of respondents admit to struggling with excessive promotional discounts and markdowns pricing of seasonal goods. While those actions are related to sell-through of on-hand inventory, retailers significantly struggle with out of stock items as well. Roughly forty percent of respondents consider out of stocks to be a persistent problem for basic products, and thirty percent believe the same is true of seasonal products (Rosenblum, 2008).
14
Players, like Zara, are rotating their product much more frequently and have increased their seasons per year up to twenty in some product categories. Traditional forecasting methods for fashion markets have resulted in overstocks or stockouts. Reliance on forecasts to meet consumer demand must be reduced and in its place should be reduction of lead times (Christopher, 2004).
Three distinct lead times that are essential for competing effectively in fashion markets are time-to-market, time-to-serve, and time-to-react. Agile supply chains should be information centered, focusing on consumer trends, sharing information virtually, and having supply chain linkages working together and flexible by using player strengths. The latter characteristic is exemplified by Zara and Benetton in that they source certain operations to specialized and often small, manufacturers. While speed and flexibility are important, the required levels of both are determined by consumer demand unpredictability (Christopher, 2004).
2.4
Costing
15 2.4.1 Manufacturing Cost Models
A study on inter-country pooled data illustrates that costs for the paper, iron and steel, and aggregate manufacturing industries are driven by capital, labor, energy, and material inputs (Roy, 2006). The electronics assembly industry’s cost structure is formed by factory time, human resources, setup times, processing times, materials and overhead (Locascio, 2000). The costs for pultrusion processes (Creese, 2000), general job-shop assembly operations (Aderoba, 1997), injection molding process (Shehab, 2002), and ethanol production processes (Kwiatkowski, 2006) share the same cost drivers: materials, labor, energy, overhead, and cost of capital. Studies on cost drivers and cost accounting are less readily available than studies on economic order quantity (EOQ).
2.4.2 Apparel Costing
16
apparel collection are summarized into labor, materials, and overhead (Aktuglu, 2001).
In parts of the world, the availability of working capital can be a limiting factor to a company’s competitiveness. During a panel discussion at Material World in April 2008 for example, Jim Chestnut of National Textiles, expressed that working capital in Central America is in short supply and needs to improve in order to keep the area competitive. He also described difficulties of obtaining capital investment financing for projects in that area.
17
One costing method that stands out, Full Value Cost Analysis is a comprehensive tool which aids industry professionals to consider, and include, often-missed components of costing (Birnbaum, 2000). Costing items fall under the following three categories: direct costs, indirect costs, and macro costs. Macro costs are related to specific countries and their infrastructure, financial institutions, corruption, communications, bureaucratic inefficiencies, tariffs, safeguard impositions, and similar factors. While these costs are very important, they are extremely difficult to quantify and use in costing analyses.
18
Direct costs are, as its name implies, costs which are directly related to the actual garments. The operations and inputs included in direct costs are cut and make labor, trims, fabric, and others. Direct costs are the one variable in the cost equation which can be negotiated by buyers, as a buyer’s reach will not be able to modify indirect or macro costs (Birnbaum, 2000).
2.5
Logistics
The previous section discussed manufacturing costs, but a very important support structure and indirect cost of production to take into account is logistics. Numerous textbooks on logistics and supply chain management define logistics using the Council of Logistics Management’s definition. Logistics is “that part of the supply chain process that plans, implements, and controls the efficient, effective flow and storage of goods, services, and related information from point of origin to point of consumption in order to meet customer requirements” as defined by the Council of Logistics Management (Long, 2003). Logistics operations are charged with the obligation of having products at the right place at the right time. Therefore an extremely important consideration when deciding on the appropriate logistics infrastructure to employ is lead times.
19
requirements, and procedures which must be followed as well as port congestion and charges, which are among other factors that affect lead times and costs. Shipping routes have different frequency of service departures and transportation times. Access from western South America to the US east coast requires use of the Panama Canal, as does in many cases from the Far East. Shipments from India to the US east coast commonly require transit through the Suez Canal. Insurance for goods shipped, bunker surcharges, and overall cost structures also vary from one shipping route to another. These and many other factors must be evaluated when making sourcing decisions.
2.6
Global Trade
In a post-quota world and where free trade agreements by the United States have been signed it is extremely important to understand the implications. Free trade agreements lower trade barriers such as tariffs and allow for reciprocal market access between trading partners. Textile businesses that are well informed of the implications of free trade agreements can leverage their knowledge to gain advantages.
20
products from China, the US textile industry must reinvent itself. China has become the dominant supplier of apparel products because it has a very complete supply chain with efficient product development services. However, China’s lengthy lead times cannot respond to fluctuations in consumer demand as effectively. The US textile and apparel industry has become more complex due to shorter product life cycles, volatile and unpredictable demands, and high product variety, otherwise known as SKUs.
In order to counteract the variation of demand, retail firms are pursuing different supply chain strategies that meet the following requirements:
Delayed production close to selling seasons for improved forecasting accuracy,
short turn-around time,
high product variety in small order size, and
21
fashion apparel instead of basic apparel and make geographic proximity advantages relevant. However, in order to be able to source these products from the area, the textile industry must invest in the area and form long term relationships. It is also necessary that pre-production services be established and offered within DR-CAFTA regions.
Retailers should realize that profitability improvements should focus on maximizing revenue and not cost of goods reductions. This can only occur if retailers sell what is actually demanded by consumers. In order to have a successful strategy it is important to have retailers, apparel and textile firms cooperating. Not only is speed-to-market needed, but also insight into consumer demand trends and behavior (Oh, 2007).
2.7
Sourcing Simulator™
22
The actual simulation is dependent on the information users input. User inputs include settings related to the buyer’s plan, markdowns and promotions, sourcing strategy, cost, consumer demand, and vendor specification. Under the before mentioned tabs the software user can specify the item selling season duration, total units forecasted to sell, style/color/size mix, specify promotion periods and its related details, supplier performance, lead times, cost of goods, among many other parameters.
Once all parameters are set to specifications, the system is ready to simulate the scenario. The system begins by generating random arrival of customers to the retail setting and assigns an SKU to the customer randomly. The SKU is related to a specific style, color and size garment. The system then checks if the SKU is in-stock on the retail shelves. If the SKU is available then a sale is recorded. If the SKU is out-of-stock, the customer may choose an alternate SKU or leave without making a purchase.
23
Industry case studies illustrate the practical applications of the Sourcing Simulator™ software. King and Maddalena (1998) performed a replenishment strategy analysis in cooperation with two companies: Dillard’s’ and clothing manufacturer Warren Featherbone Co. Both retailer and manufacturer were interested in implementing replenishment scenarios for children’s apparel. The participants used the Sourcing Simulator™ software to analyze several strategies prior to making a commitment. The simulations run showed that gross margin performance was improved significantly with the adoption of single in-season reorder with a 50% initial inventory delivery, compared to a traditional sourcing approach with 100% initial inventory delivery. The single in-season replenishment also had improved metrics in service levels and inventory turns. The study also investigated initial inventory stocking percentages and its effect on revenue, forecast error effects on gross margin, and the number of reorders and its effects on gross margin. Based on the scenario analyses the two companies were able to adopt a trial strategy.
24
helps move merchandise more effectively. The authors conclude that apparel suppliers with replenishment capabilities have much to offer their retail customers (King and Maddalena, 1999).
King and Moon (1999) employed the Sourcing Simulator™ to analyze different replenishment strategies for a vertically integrated manufacturer who had recently expanded their operations along the textile and apparel supply chain. By systematically changing simulation parameters relevant to the manufacturer, including initial inventory shipment quantities, number of reorder and frequency, lead times and costs associated with different raw material stocking policies, the users were able to obtain performance metric outputs for each scenario. The performance metrics detail retailer (brand) performance, as well as manufacturer performance, including gross margins, service levels, and on-time shipments, among others.
Lisa Hartman (2005) employed the Sourcing Simulator™ software system for an exhaustive analysis of several sourcing scenarios. Hartman focused on how supply chain speed in sourcing impacted retail performance. In her study, she analyzed the performance of a great number of sourcing strategies for basic goods.
25
weeks of inventory and reorder target weeks of supply needed to yield a given target service level at retail. Performance metrics were collected (e.g. related to inventory levels, service levels, ROI, etc.) once the optimal solution was found for each scenario.
26
3
Methodology
The review of literature showed there is a need for additional costing tools for a largely international textile and apparel supply chain complex. The initial objective of the research project is to develop a cost model for sourcing apparel products. Seasonal as well as basic apparel items produced in different supply chain routes where products could be sourced are included in the study. A list of yarn-forward cost categories will be developed and collected. Once the cost model has been completed, costs associated to specific products from each supply chain route will be fed to simulation scenarios in the Sourcing Simulator™. Analyses on supply chain impacts on retail performance will then be performed.
3.1
Product Selection
27
products are sourced from all over the world including many Far East and Western Hemisphere countries. The wide sourcing base provides for a variety of scenarios with a set of diverse costs and lead times.
3.2
Supply Chain Routes
The following supply chains will be analyzed in the research project. 1. U.S. Yarn U.S. Fabric U.S. Cut/Sew/Finishing U.S. Retail
2. U.S. Yarn U.S./CAFTA-DR Fabric CAFTA-DR Cut/Sew/Finishing U.S. Retail
3. U.S. Yarn U.S./ANDEAN Fabric ANDEAN Cut/Sew/Finishing U.S. Retail
4. China Yarn China Fabric China Cut/Sew/Finishing U.S. Retail 5. China Yarn China Fabric Vietnam Cut/Sew/Finishing U.S. Retail 6. India Yarn India Fabric India Cut/Sew/Finishing U.S. Retail
3.3
Landed Cost Components
To compare the various supply chains, landed costs of the goods needs to be established. Cost analysis will begin from fiber input costs through inbound U.S. logistics. The major cost components to that will be included in the cost model for the two products and the different supply chain regions/routes are:
28 textile wet processing,
cutting and sewing operational activities and their related labor costs, finishing (denim washing, floor-ready packing, etc.),
raw material outbound logistics, port of export charges,
U.S. rates of duty, and inbound logistics.
3.4
Sourcing Simulator™
29
4
Sourcing Cost Model
The cost model developed in this study focuses on direct costs in relation to where a product is made. The model is different from others in that it goes further into detail, encompasses supply chain costs from fiber to end-consumer, and provides comparisons of multiple countries for sourcing apparel goods, while being relevant to the textile, apparel, and retail supply chain. The cost model helps identify the overall makeup of costs for the procurement of goods. The breakdown of the many cost elements allows for an improved appreciation of the importance of each element. All of the cost data and related cost calculations have been entered into a spreadsheet for interested parties.
30
4.1
The Textile, Apparel, and Retail Supply Chain
31
desizing agents, surfactants, enzymes, and softeners that give the jean desired hand and visual properties. Figure 4.1 illustrates a typical apparel supply chain for the production of a t-shirt, while Figure 4.2 shows a denim bottoms supply chain. Costing of the two products will be carried out throughout this chapter. The following sections describe the core cost drivers of each sub-industry of the supply chain.
32
Figure 4.2 - Textile, Apparel, Retail Supply Chain for Denim Bottoms
4.2
Manufacturing Inputs
33 4.2.1 Labor
The most comprehensive publisher of labor wages is the International Labor Office, a branch of the United Nations. Their wages are reported by economic activity in manufacturing, or more generally by manufacturing industries as a whole. Rates for specific industries, including textiles and apparel, are limited in availability for certain countries. The ILO report has reporting gaps as not all countries have data reported for every time period or every economic activity (International Labor Organization, 2009).
34
Table 4.1 - Fully Loaded Hourly Labor Rates
$/hr Source
China 1.08 O'Rourke
Colombia 1.42 O'Rourke
Guatemala 1.65 O'Rourke
India 0.51 O'Rourke
United States 14.10 ITMF IPCC 2008
Vietnam 0.38 O'Rourke
4.2.2 Energy
35
Table 4.2 - Electrical Energy Rates
$/kWh Source
China 0.1000 ITMF
Colombia 0.1070 OLADE Guatemala 0.1600 ENEE
India 0.1120 ITMF
United States 0.0630 ITMF
Vietnam 0.0550 The Associated Press
Energy generation infrastructures vary significantly from country to country. Some countries have been myopic in their decisions and eventually become vulnerable to macroeconomic conditions. Some Central American countries have supported recent increases in demand for energy by adding thermal energy stations that run on residual fuel oils to their grid. As a consequence, those countries are now susceptible to surges in world oil prices, which can make their energy more expensive to produce.
36 4.2.3 Water
Information on water rates was obtained from ITMF IPCC 2008 report, municipal water agencies (EPM, 2009), web resources (Look at Vietnam, 2009), as well as from operating data from companies with operations in the countries of interest. Information on water costs are found in Table 4.3.
Table 4.3 - Water Rates
$/m3 $/ gal Source
China 0.3600 0.0014 ITMF
Colombia 0.4099 0.0016 EPM
Guatemala 0.2496 0.0009 Industry data
India 0.3200 0.0012 ITMF
United States 0.3389 0.0013 Industry data Vietnam 0.4588 0.0017 Look at Vietnam
4.2.4 Steam
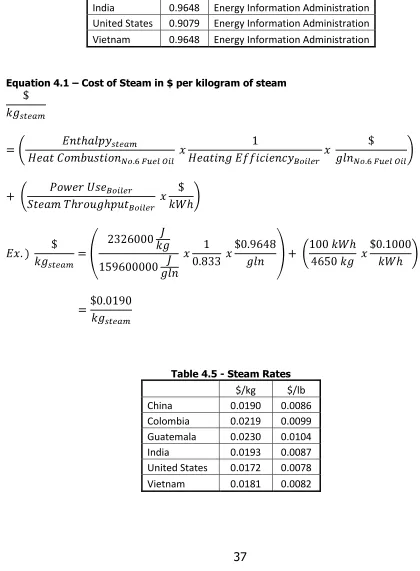
37
Table 4.4 - No. 6 Residual Fuel Oil Rates
$/gal Source
China 0.9648 Energy Information Administration Colombia 1.1198 Energy Information Administration Guatemala 1.1198 Energy Information Administration India 0.9648 Energy Information Administration United States 0.9079 Energy Information Administration Vietnam 0.9648 Energy Information Administration
Equation 4.1 – Cost of Steam in $ per kilogram of steam
Table 4.5 - Steam Rates
$/kg $/lb
China 0.0190 0.0086
Colombia 0.0219 0.0099 Guatemala 0.0230 0.0104
India 0.0193 0.0087
United States 0.0172 0.0078
38
4.3
Textile Operations
The textile industry requires large investments in facilities, equipment, and machinery. Reports and analyses have shown capital related expenses can represent as much as thirty seven percent of United States ring spinning manufacturing costs, excluding raw material costs, and as much as twenty three percent of costs when raw materials are taken into account (International Textile Manufacturers Federation, 2008). Other textile operations, such as knitting and weaving follow similar trends in capital intensity. Despite the capital intensiveness of the textile industry and its role as a barrier to entry, textile operations can be found in developed and developing countries as well. Some countries have textile infrastructures and market participation to lesser degrees, but it is clear that textile operations have participants from all parts of the world.
4.3.1 International Production Cost Comparison
39
ITMF began publishing the International Production Cost Comparison (IPCC) report in 1979. The publication seeks to enable understanding of the capital intensity of the textile industry and to provide a detailed review of all manufacturing costs. The study, developed through cooperation with original equipment manufacturers (OEMs), individual textile companies, and several countries’ textile associations, breaks down the major manufacturing costs and total product costs of major operations. The areas of textile operations included in the report are spinning, texturing, knitting, and weaving. ITMF’s publication provides key textile cost data used as a base for inputting fabric raw material costs to the sourcing cost model developed in the research.
40
The countries included in the study are Egypt, Brazil, Italy, Korea, Turkey, China, India, and the United States, with the latter three countries being of most relevance and importance to the sourcing cost model research. The study assumes that output is the same for all countries, and compensates for this by varying the amount of labor required in each country to obtain the established output levels. Although the report does not analyze a vast range of yarn counts and types, woven or knitted fabric weights, the report does provide a vast amount of information on common product types. Albeit limited in product scope, the structure of the cost data can be used as a base to scale for cost approximations of similar fabrics. Each manufacturing process cost is apportioned into waste, labor, power, auxiliary materials, capital, packing (in texturing), and raw materials. By taking average currency exchange rates of the first quarter of 2008, costs are presented in US Dollars.
4.3.1.1 Spinning
41
Figure 4.3 - Cotton Prices (ITMF, 2008)
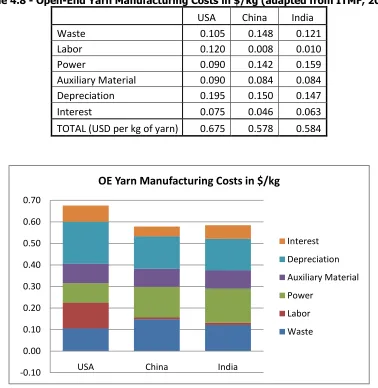
There are two types of yarns included in the IPCC report. The first yarn analyzed is a combed ring spun yarn, Ne 30, using 1-1/8 inch cotton staple. The areas of operation analyzed include winding and assume a rate of output of 400 kilograms per hour on Rieter equipment. The second yarn analyzed is a carded open-end spun yarn, Ne 20, using 1-1/16 inch cotton staple. The output rate is the same 400 kilograms per hour on Rieter equipment as well. Table 4.6 and Figure 4.4 show the manufacturing costs related to the production of ring spun yarn, while Table 4.7 and Figure 4.5 illustrate total product cost including raw material costs. The manufacturing costs of rotor spun yarn can be seen in Table 4.8 and Figure 4.6, while the total product cost including raw material is shown in Table 4.9 and Figure 4.7.
1.49
2.04
1.64 1.40
1.99
1.61
0.00 0.50 1.00 1.50 2.00 2.50
USA China India
Cotton Prices in $/kg
42
Table 4.6 - Ring Yarn Manufacturing Costs in $/kg (adapted from ITMF, 2008)
USA China India
Waste 0.240 0.328 0.263
Labor 0.503 0.033 0.043
Power 0.216 0.343 0.384
Auxiliary Material 0.132 0.118 0.118
Depreciation 0.470 0.364 0.354
Interest 0.173 0.113 0.155
TOTAL (USD per kg of yarn) 1.734 1.299 1.317
Figure 4.4 - Ring Yarn Manufacturing Costs in $/kg (adapted from ITMF, 2008) 0.00
0.20 0.40 0.60 0.80 1.00 1.20 1.40 1.60 1.80 2.00
USA China India
Ring Yarn Manufacturing Costs in $/kg
Interest
Depreciation
Auxiliary Material
Power
Labor
43
Table 4.7 - Ring Yarn Total Cost in $/kg (adapted from ITMF, 2008)
USA China India
Waste 0.240 0.328 0.263
Labor 0.503 0.033 0.043
Power 0.216 0.343 0.384
Auxiliary Material 0.132 0.118 0.118
Depreciation 0.470 0.364 0.354
Interest 0.173 0.113 0.155
Raw Material 1.490 2.040 1.640
TOTAL (USD per kg of yarn) 3.224 3.339 2.957
Figure 4.5 - Ring Yarn Total Costs in $/kg (adapted from ITMF, 2008) 0.00
0.50 1.00 1.50 2.00 2.50 3.00 3.50
USA China India
Ring Yarn Total Costs in $/kg
Raw Material
Interest
Depreciation
Auxiliary Material
Power
Labor
44
Table 4.8 - Open-End Yarn Manufacturing Costs in $/kg (adapted from ITMF, 2008)
USA China India
Waste 0.105 0.148 0.121
Labor 0.120 0.008 0.010
Power 0.090 0.142 0.159
Auxiliary Material 0.090 0.084 0.084
Depreciation 0.195 0.150 0.147
Interest 0.075 0.046 0.063
TOTAL (USD per kg of yarn) 0.675 0.578 0.584
Figure 4.6 – Open-End Yarn Manufacturing Costs in $/kg (adapted from ITMF, 2008) -0.10
0.00 0.10 0.20 0.30 0.40 0.50 0.60 0.70
USA China India
OE Yarn Manufacturing Costs in $/kg
Interest
Depreciation
Auxiliary Material
Power
Labor
45
Table 4.9 - Open-End Yarn Total Costs in $/kg (adapted from ITMF, 2008)
USA China India
Waste 0.105 0.148 0.121
Labor 0.120 0.008 0.010
Power 0.090 0.142 0.159
Auxiliary Material 0.090 0.084 0.084
Depreciation 0.195 0.150 0.147
Interest 0.075 0.046 0.063
Raw Material 1.400 1.990 1.610
TOTAL (USD per kg of yarn) 2.075 2.568 2.194
Figure 4.7 – Open-End Yarn Total Costs in $/kg (adapted from ITMF, 2008)
4.3.1.2 Knitting
ITMF’s International Production Country Cost report covers three knitted fabric structures: single jersey, lapique, and interlock. The single jersey fabric, which is relevant to this cost model, is knitted with 100% cotton, combed, Ne 30, ring spun
0.00 0.50 1.00 1.50 2.00 2.50 3.00
USA China India
OE Yarn Total Costs in $/kg
46
yarn. The fabric has a weight of 230 grams per meter and an open-width of 1.92 meters and is manufactured on Karl Mayer Relanit 3.2 II knitting machines, with 30 inch diameter, 24 gauge, and 96 feeders with side creel. The cost calculations are based on a mill with seventeen machines with an output per machine of 25.3 kilograms per hour. Table 4.10 and Figure 4.8 provide a detail of the costs of producing the knitted fabric, while Table 4.11 and Figure 4.9 include raw material costs of Ne 30 CPRS yarn as shown in Table 4.7.
Table 4.10 - Single Jersey Knitting Manufacturing Costs in $/m (adapted from ITMF, 2008)
USA China India
Labor 0.025 0.001 0.002
Power 0.003 0.005 0.005
Auxiliary Material 0.007 0.006 0.006
Depreciation 0.011 0.012 0.009
Interest 0.004 0.003 0.003
47
Figure 4.8 – Single Jersey Knitting Manufacturing Costs in $/m (adapted from ITMF, 2008)
Table 4.11 - Single Jersey Fabric Total Costs in $/m (adapted from ITMF, 2008)
USA China India
Labor 0.025 0.001 0.002
Power 0.003 0.005 0.005
Auxiliary Material 0.007 0.006 0.006
Depreciation 0.011 0.012 0.009
Interest 0.004 0.003 0.003
Raw Material (CPRS Ne 30 Yarn) 0.742 0.768 0.680 TOTAL (USD per m of fabric) 0.792 0.795 0.705
0.00 0.01 0.02 0.03 0.04 0.05 0.06
USA China India
Knitting Manufacturing Costs in $/m
Interest
Depreciation
Auxiliary Material
Power
48
Figure 4.9 - Single Jersey Fabric Total Costs in $/m (adapted from ITMF, 2008)
The information and cost structure found in Table 4.11 was taken as a base for calculating knitted fabric costs for countries not included in the ITMF report, including Guatemala, Vietnam and Colombia. Raw material costs for Guatemala and Colombia were set equal to US yarn cost plus maritime transportation costs to the respective country. Vietnam’s raw material costs were set to China’s yarn costs plus maritime transportation costs from China. Container shipping rates were obtained through Seaboard Marine (2008) and Orient Overseas Container Line (2008). Consultation with yarn manufacturers exporting their products provided container stuffing data. For yarn shipping cost calculations, it was assumed that up to 16,646.84 kilograms of yarn can be shipped in a forty foot container and that a 1.87% insurance charge is applied to the cost of yarn. Equation 4.2 accounts for
0.00 0.10 0.20 0.30 0.40 0.50 0.60 0.70 0.80 0.90
USA China India
Knit Fabric Total Costs in $/m
49
raw material cost calculations for non-ITMF countries including the cost of shipping yarn, followed by an example calculation for using yarn shipped from the US to Guatemala, using the shipping rates shown in Table 4.12.
Table 4.12 - Forty-foot Container Shipping Rates
$/40ft
US to Colombia 3660 US to Guatemala 2851 China to Vietnam 1788
Equation 4.2 – Cost of Yarn including Shipping Costs in $ per Meter of Knit Fabric
50
per hour and dollars per kWh, respectively. Guatemala, Vietnam, and Colombia were assigned values equal to the average of the scaled values against the United States, China, and India. The calculations for labor and power costs for non-ITMF countries can be calculated using Equation 4.3; labor costs for Colombia are shown as an example. Table 4.13, Figure 4.10, and Figure 4.11 show greige fabric costs for all countries.
51
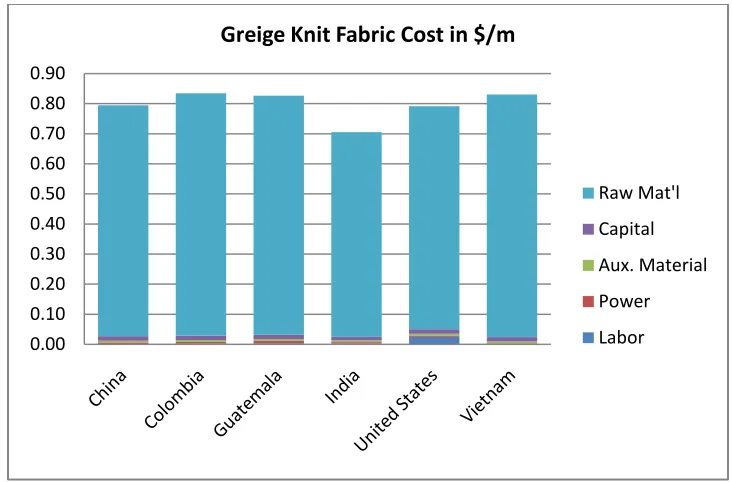
Table 4.13 - Greige Knit Fabric Costs in $/m for all Countries
Labor Power
Aux.
Material Capital
Raw Material
Greige Total
$/m $/m $/m $/m $/m $/m
China 0.0010 0.0050 0.0060 0.0150 0.7680 0.7950
Colombia 0.0031 0.0051 0.0063 0.0140 0.8060 0.8345 Guatemala 0.0036 0.0076 0.0063 0.0140 0.7948 0.8263
India 0.0020 0.0050 0.0060 0.0120 0.6801 0.7051
United States 0.0250 0.0030 0.0070 0.0150 0.7415 0.7915 Vietnam 0.0008 0.0026 0.0063 0.0140 0.8070 0.8308
Figure 4.10 - Greige Knit Fabric Costs in $/m, excluding Raw Materials for ITMF and non-ITMF Countries 0.00 0.01 0.02 0.03 0.04 0.05 0.06
Greige Knit Fabric Manufacturing Cost in $/m, excluding Raw Materials
Capital
Aux. Material
Power
52
Figure 4.11 – Greige Knit Fabric Costs in $/m for ITMF and non-ITMF Countries
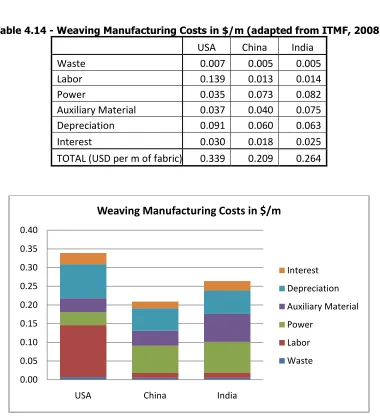
4.3.1.3 Weaving
The report covers three woven fabric structures, with the open-end cotton yarn fabrics being of most relevance to this cost model. The construction of the woven fabric using open-end yarn has a construction of 24.0/24.0 threads per centimeter, with a fabric width of 1.68 meters and 248 gram per meter greige fabric weight for equivalent weights 147.62 grams per square meter (or 4.35 oz/yard2). The output per machine is 21.9 meters per hour. The calculations for producing the fabric are based on a mill with 72 Sultex B190 N2 EP11 air-jet weaving machines, and also accounts for expenses related to air conditioning, weaving preparation, cloth inspection, and material handling. Table 4.14 and Figure 4.12 document the
0.00 0.10 0.20 0.30 0.40 0.50 0.60 0.70 0.80 0.90
Greige Knit Fabric Cost in $/m
Raw Mat'l
Capital
Aux. Material
Power
53
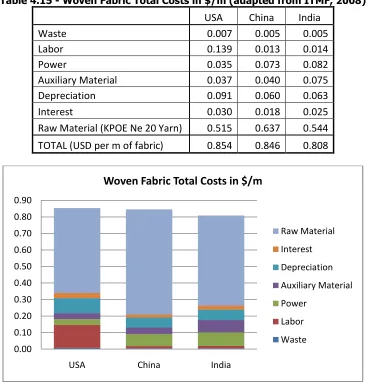
manufacturing costs associated with producing the rotor yarn fabric, while Table 4.15 and Figure 4.13 also include raw material costs of Ne 20 KPOE yarn as shown in Table 4.9.
Table 4.14 - Weaving Manufacturing Costs in $/m (adapted from ITMF, 2008)
USA China India
Waste 0.007 0.005 0.005
Labor 0.139 0.013 0.014
Power 0.035 0.073 0.082
Auxiliary Material 0.037 0.040 0.075
Depreciation 0.091 0.060 0.063
Interest 0.030 0.018 0.025
TOTAL (USD per m of fabric) 0.339 0.209 0.264
Figure 4.12 - Weaving Manufacturing Costs in $/m (adapted from ITMF, 2008) 0.00 0.05 0.10 0.15 0.20 0.25 0.30 0.35 0.40
USA China India
Weaving Manufacturing Costs in $/m
54
Table 4.15 - Woven Fabric Total Costs in $/m (adapted from ITMF, 2008)
USA China India
Waste 0.007 0.005 0.005
Labor 0.139 0.013 0.014
Power 0.035 0.073 0.082
Auxiliary Material 0.037 0.040 0.075
Depreciation 0.091 0.060 0.063
Interest 0.030 0.018 0.025
Raw Material (KPOE Ne 20 Yarn) 0.515 0.637 0.544 TOTAL (USD per m of fabric) 0.854 0.846 0.808
Figure 4.13 - Woven Fabric Total Costs in $/m (adapted from ITMF, 2008)
The yarn and woven fabric structures for basic denim bottoms differ from what is found in ITMF’s IPCC 2008 report. Denim jeans require yarn counts that are significantly coarser than Ne 20 and use fabrics with weights heavier than 4.35 oz/yd2. The basic denim jean included in this study has been assumed to have Ne 6 warp yarns and to have a fabric weight of 12.5 oz/yd2 or 423.81 g/m2.
0.00 0.10 0.20 0.30 0.40 0.50 0.60 0.70 0.80 0.90
USA China India
Woven Fabric Total Costs in $/m
55
Coarser yarns, such as Ne 6 KPOE yarn compared to Ne 20, will have lower rotor revolutions per minute but require less twist insertion as well, resulting in similar yarn production output rates. For this reason and that yarn costs in ITMF’s IPCC 2008 report are presented by weight, which is dictated in its majority by cotton prices, Ne 6 yarn costs was assumed to be equal to the information in ITMF’s report for KPOE Ne 20 yarn.
The fabric presented within ITMF’s report is of significantly lighter weight compared to the fabric weight assumed, but this difference is accounted for by scaling the yarn raw material costs to reflect the heavier fabric construction. Nonetheless, the fabric width, pick density, pick insertion rate, and linear output of fabric rate are similar. Despite the incongruent product types, the information is the best available for this study and therefore is taken as a basis for denim product cost calculations. Equation 4.4 calculates the cost of raw materials for the heavier fabric weight using yarn costs as detailed in Table 4.9, which is followed by an example calculation for the USA respectively. Table 4.16 summarizes the adapted total fabric costs by substituting the new yarn cost.
56
Table 4.16 – Woven Denim-Weight Fabric Total Cost in $ per Meter of Fabric
USA China India
Waste 0.007 0.005 0.005
Labor 0.139 0.013 0.014
Power 0.035 0.073 0.082
Auxiliary Material 0.037 0.040 0.075
Depreciation 0.091 0.060 0.063
Interest 0.030 0.018 0.025
Raw Material (KPOE Ne 6 Yarn) 1.4774 1.8284 1.5621 TOTAL (USD per m of fabric) 1.8164 2.0374 1.8261
Figure 4.14 – Woven Denim-Weight Fabric Total Cost in $ per Meter of Fabric 0.000
0.500 1.000 1.500 2.000 2.500
USA China India
Woven Fabric Total Costs in $/m
Raw Material
Interest
Depreciation
Auxiliary Material
Power
Labor
57
The information and cost structure found in Table 4.16 was taken as a base for calculating woven fabric costs for countries not included in the ITMF report, including Guatemala, Vietnam and Colombia. Raw material costs for Guatemala and Colombia were set equal to US yarn cost plus maritime transportation costs, including a 1.87% insurance charge, to the respective country. Vietnam’s raw material costs were set to China’s yarn costs plus maritime transportation costs, also including a 1.87% insurance charge, from China. The example below uses Equation 4.2 to account for yarn raw material cost calculations for non-ITMF countries including the cost of shipping yarn, for using yarn shipped from the US to Guatemala, using the shipping rates shown in Table 4.12.
58
were assigned values equal to the average of the scaled values against the United States, China, and India. The calculations for labor and power costs for non-ITMF countries can be calculated using Equation 4.3; labor costs for Colombia are shown below as an example. Table 4.17, Figure 4.15, and Figure 4.16 show greige fabric costs for all countries.
Table 4.17 – Greige Woven Fabric Costs in $/m for all Countries
Waste Labor Power
Aux.
Material Capital Raw Mat'l
Greige Total
Country $/m $/m $/m $/m $/m $/m $/m
China 0.0050 0.0130 0.0730 0.0400 0.0780 1.8284 2.0374
Colombia 0.0057 0.0234 0.0720 0.0507 0.0957 1.6616 1.9089
Guatemala 0.0057 0.0271 0.1076 0.0507 0.0957 1.6270 1.9137
India 0.0050 0.0140 0.0820 0.0750 0.0880 1.5621 1.8261
United States 0.0070 0.1390 0.0350 0.0370 0.1210 1.4774 1.8164
59
Figure 4.15 – Greige Woven Fabric Costs in $/m, excluding Raw Materials for ITMF and non-ITMF Countries
Figure 4.16 – Greige Woven Fabric Costs in $/m for ITMF and non-ITMF Countries 0.00 0.05 0.10 0.15 0.20 0.25 0.30 0.35
Greige Woven Fabric Manufacturing Cost in $/m, excluding Raw Materials
Capital Aux. Material Power Labor Waste 0.00 0.50 1.00 1.50 2.00 2.50
Greige Woven Fabric Cost in $/m
60 4.3.2 Wet Processing
The wet processing stage of textile operations is characterized by a costly consumption of resources. Dyeing and finishing machinery manufacturer executive Bill Fong, of Fong’s Industries Co. Ltd., supplied water consumption data at a recent industry exposition. According to the data presented, the average kilogram of finished fabric can require between 100 and 150 liters of water to be processed (Rupp, 2008). Information supplied by original equipment manufacturers for this study indicate that technology currently available deviates significantly from the previous statistic, as much less water is consumed per kilogram of fabric according to their specifications.
61
Figure 4.17 - Energy Consumption for a Cotton Shirt (adapted from Stegmaier, 2007)
4.3.2.1 Wet Processing for Knits – Piece Dyeing
Sources of information for wet processing costs were made possible by original equipment manufacturers. Gaston County Dyeing Machine Company provided piece dyeing operating data including labor, chemical, dyes, water, steam, and electric consumption rates for a typical plant setup (Davis, 2009). Information was provided for scouring and dyeing 100% cotton piece goods with a dark shade. The costs are related to processing the fabric on a 2-strand Millennium Dyeing Machine with Charge Tank using reactive dyes. The analysis was setup assuming a 1000 pound load, 4.78-hour cycle time, at 90 percent efficiency for an output of 188 pounds of fabric per hour. Table 4.18 illustrates the resource consumption rates per pound for
1.8 2.49
6.2
0.08 0
1 2 3 4 5 6 7
Spinning Weaving Finishing Make Up
Energy Consumption
62
the given production setup, while Equation 4.5 through Equation 4.9 show cost calculation formulas, followed by an example calculation based on operating in China. Table 4.19, Figure 4.18, and Figure 4.19 summarize dyeing costs for all countries included in the study.
Table 4.18 - Resource Consumption Rates per Pound of Knit Fabric for Piece Dyeing
Component Unit Qty
Labor hour 1/3 x 1/188
Auxiliary Chemical $ 0.0874
Dyes $ 0.6818
Water gallon 4.8
Steam lb 2.13
Energy kWh 0.0853
Equation 4.5 – Labor Cost for Piece Dyeing in $ per Pound of Knit Fabric
Equation 4.6 – Energy Cost for Piece Dyeing in $ per Pound of Knit Fabric
63
Equation 4.8 – Water Cost for Piece Dyeing in $ per Pound of Knit Fabric
Equation 4.9 – Chemical and Dye Cost for Piece Dyeing in $ per Pound of Knit Fabric
Table 4.19 - Piece Dyeing Costs in $/lb and $/m of Knit Fabric
Labor Energy Steam Water Dyes & Chem
TOTAL $/lb $/m China 0.0019 0.0085 0.0184 0.0065 0.7692 0.8046 0.4080 Colombia 0.0025 0.0091 0.0212 0.0074 0.7692 0.8094 0.4104 Guatemala 0.0029 0.0136 0.0223 0.0045 0.7692 0.8125 0.4120 India 0.0009 0.0096 0.0186 0.0058 0.7692 0.8041 0.4077 United States 0.0250 0.0054 0.0167 0.0062 0.7692 0.8224 0.4170 Vietnam 0.0007 0.0047 0.0175 0.0083 0.7692 0.8003 0.4058