Reduced Reference Image Quality Assessment
by Spatial Distribution of Image Structures
Based on Fractal Analysis
K.Gowthami1, S.Raghavendra Swami2, S.Ravi Kumar3
M.Tech, Dept. of ECE, PVKK Institute of Technology, Affiliated to JNTUA, AP, India1
Associate Professor, Dept. of ECE, PVKK Institute of Technology, Affiliated to JNTUA, AP, India2
Associate Professor, Dept. of ECE, PVKK Institute of Technology, Affiliated to JNTUA, AP, India3
ABSTRACT: Reduced-reference image quality assessment (RRIQA) provides a practical solution for automatic image
quality evaluations in various applications where only partial information about the original reference image is accessible. In this paper, multifractal analysis is personalized to reduced-reference image quality assessment (RR-IQA). A new RR-QA approach is proposed, which measures the difference of spatial arrangement between the reference image and the distorted image in terms of spatial regularity measured by fractal dimension. An image is first shown in wavelet domain using duel tree complex wavelet transform. Then, fractal dimensions are computed on each wavelet sub-band and concatenated as a feature vector. Finally, the extracted features are pooled as the quality score of the distorted image using ℓ1 distance. Compared with existing methods, the proposed approach measures image quality
from the perspective of the spatial distribution of image patterns. Simulation results have demonstrated the excellent performance of the proposed method.
KEYWORDS: Image quality assessment, similarity of spatial arrangements, fractal dimension, Log-Gabor
representation.
I. INTRODUCTION
Reduced-reference (RR) image quality metrics provide a solution that lies between FR and NR models. They are designed to predict the perceptual quality of distorted images with only partial information about the reference images. Recently, the video quality experts group has included RR image/video quality assessment as one of its directions for future development. RR methods are useful in a number of applications. For example, in real-time visual communication systems, they can be used to track image quality degradations and control the streaming resources. The system includes a feature extraction process at the sender side and a feature extraction/quality analysis process at the receiver side. The extracted RR features usually have a much lower data rate than the image data and are typically transmitted to the receiver through an ancillary channel. Although it is often assumed that the ancillary channel is error-free, this is not an absolutely necessary requirement since even partly decoded RR features may still be helpful in evaluating the quality of the distorted image, though the accuracy may be severely affected.
II. RELATED WORK
1) Reduced-reference image quality assessment by structural similarity estimation AUTHORS: A. Rehman and Z. Wang
Reduced-reference image quality assessment (RR-IQA) provides a practical solution for automatic image quality evaluations in various applications where only partial information about the original reference image is accessible. Here we propose an RR-IQA method by estimating the structural similarity (SSIM) index, which is a widely used Full-Reference (FR) image quality measure shown to be a good indicator of perceptual image quality. Specifically, we extract statistical features from a multi-scale, multi-orientation divisive normalization transform and develop a distortion measure by following the philosophy in the construction of SSIM. We found an interesting linear relationship between the FR SSIM measure and our RR estimate when the image distortion type is fixed. A regression-by discretization method is then applied to normalize our measure across image distortion types. We use six publicly available subject-rated databases to test the proposed RR-SSIM method, which shows strong correlations with both SSIM and subjective quality evaluations. Finally, we introduce the novel idea of partially repairing an image using RR features and use deblurring as an example to demonstrate its application.
2) Reduced reference entropic differencing for image quality assessment AUTHORS: R. Soundararajan and A. C. Bovik, “RRED indices.
We study the problem of automatic “reduced-reference” image quality assessment (QA) algorithms from the point of view of image information change. Such changes are measured between the reference- and natural-image approximations of the distorted image. Algorithms that measure differences between the entropies of wavelet coefficients of reference and distorted images, as perceived by humans, are designed. The algorithms differ in the data on which the entropy difference is calculated and on the amount of information from the reference that is required for quality computation, ranging from almost full information to almost no information from the reference. A special case of these is algorithms that require just a single number from the reference for QA. The algorithms are shown to correlate very well with subjective quality scores, as demonstrated on the Laboratory for Image and Video Engineering Image Quality Assessment Database and the Tampere Image Database. Performance degradation, as the amount of information is reduced, is also studied.
II. EXISTING SYSTEM
To quantify how much an image is affected by degradation, a metric is required ti evaluate how good an image is in
visual meaning for human visual system (HVS).This leads to the research on image quality assessment (IQA).
As the ultimate solution, subjective IQA has its advantages on the reliability and consistency with human for the quality is directly quantified by observes. Nevertheless the practicality of subjective IQA is very limited because it is expensive and time-consuming.
PROPOSED SYSTEM:
This paper is implemented by using Log-Gabor representation and fractal analysis. The former aims to create a complete basis of visual perception, while the latter can encode spatial information in the form of the geometrical distribution of visual data.
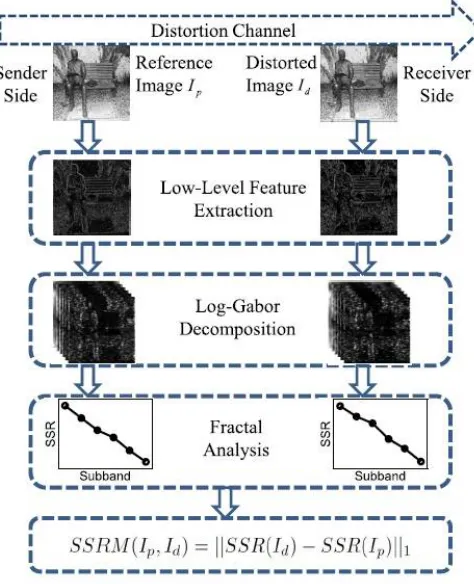
Specifically, the proposed RR-IQA feature, called spectrum of spatial regularity (SSR), characterizes the spatial distribution of image structures based on fractal analysis. The spatial-frequency components of image are first extracted by Log-Gabor filtering. Then fractal dimension is used to measure the spatial regularity of the arrangements in each Log-Gabor subband. Finally all the computed fractal dimensions are collected as a feature vector. By using fractal analysis that has a strong correlation with HVS, the image structures are well encoded and the difference of their spatial arrangements between images can be well characterized.
SYSTEM ARCHITECTURE:
Fig 1: Outline of the proposed method.
IMPLEMENTATION
1. Low Level Feature Extraction
Given an image I, we first extract low-level visual features from the image. A feature map M is computed from I by M=m(I). An accepted measurement should be sensitive to a wide range of image distortion types. In our method, the intensity measurement and the gradient measurement are used, which are defined as follows,
2. Log-Gabor Decomposition
The Log-Gabor filters {H (ρ, θ)}ρ,θ are run on the feature image M to localize the image structures of different
orientations and frequencies. This procedure results in multiple response images {Gρ,θ}ρ,θ from the feature image:
Where F(·,H) denotes filtering with the Log-Gabor filter H. By using Log-Gabor filtering, we convert the extracted image features from image space into visual perceptive space. Then, parallel to characterizing the spatial distribution of the visual responses in the V1 area of HVS.
3. Fractal Analysis
We extract features from the Log-Gabor response images via fractal analysis. The fractal dimension is computed on each response image and all the fractal dimensions are concatenated as the proposed SSR feature, i.e.,
Where denotes the concatenation of all the scalars into a vector. The SSR feature globally summarizes the spatial regularity of image structures of different orientations and frequencies. Thus, it can reflect efficiently the changes of local image features caused by different types of distortion. In practice, the SSR features can be extracted globally through an image or locally in small blocks. We found that local SSR gives better prediction performance than global SSR. This is because local SSR provides a richer description. Using local SSR also facilitate the generation of a quality map for estimating quality in local regions.
4.Similarity Index of Spatial Regularity
Once the SSR features of both the pristine image Ip and the distorted image Id have been obtained, we compute the proposed similarity index of spatial regularity (denoted by SSRM) as the quality score of the distorted image, which is done by calculating the L1 distance of the two SSR feature vectors as follows,
III. SIMULATION RESULTS
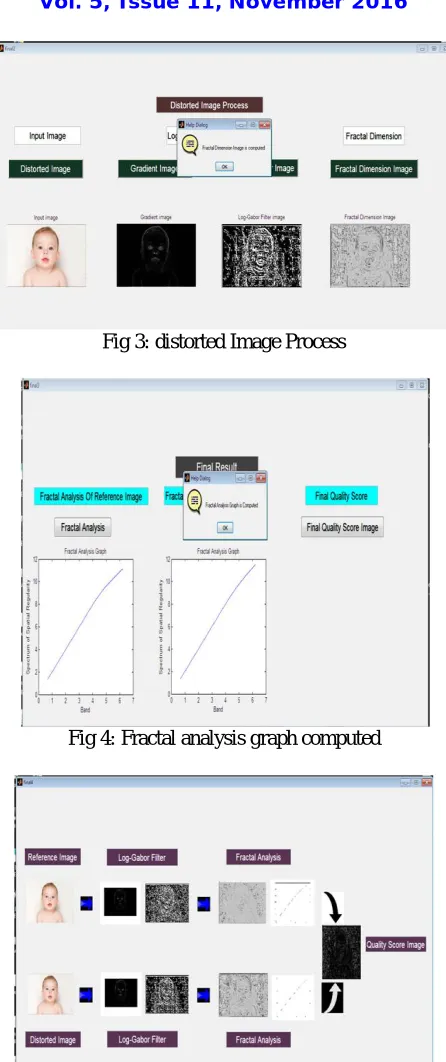
Fig 3: distorted Image Process
Fig 4: Fractal analysis graph computed
Fig 5: Final Result of Fractal analysis
IV. CONCLUSION
quality assessment is a challenging task, especially when only part information of the reference image is known. We extracted the low level feature and use duel tree complex wavelet transform for decomposition of the image. This extracts the spatial frequency components of the image. For characterizing the distortion we use RRIQA is used. Fractal analysis is employed to characterize the spatial distributions of image structured expressed in Log-Gabor sub-bands of both the reference image and the distorted image. The results show that our method is competitive against the state-of-the-art approaches.
In future the spectrum of spatial regularity can be obtained by various decomposition methods are used and their performance is analyzed.
REFERENCES
[1] Yong Xu, Delei Liu, YuhuiQuan, and Patrick Le Callet , Fractal Analysis for Reduced Reference Image Quality Assessment IEEE TRANSACTIONS ON IMAGE PROCESSING, VOL. 24, NO. 7, JULY 2015
[2] A. Rehman and Z. Wang, “Reduced-reference image quality assessment by structural similarity estimation,” IEEE Trans. Image Process., vol. 21, no. 8, pp. 3378–3389, Aug. 2012.
[3] H. R. Sheikh and A. C. Bovik, “Image information and visual quality,” IEEE Trans. Image Process., vol. 15, no. 2, pp. 430–444, Feb. 2006. [4] N. Damera-Venkata, T. D. Kite, W. S. Geisler, B. L. Evans, and A. C. Bovik, “Image quality assessment based on a degradation model,”IEEE
Trans. Image Process., vol. 9, no. 4, pp. 636–650, Apr. 2000.
[5] L. Zhang, L. Zhang, X. Mou, and D. Zhang, “FSIM: A feature similarity index for image quality assessment,” IEEE Trans. Image Process., vol. 20, no. 8, pp. 2378–2386, Aug. 2011.
[6] H. R. Sheikh, A. C. Bovik, and L. Cormack, “No-reference quality assessment using natural scene statistics: JPEG2000,” IEEE Trans.Image Process., vol. 14, no. 11, pp. 1918–1927, Nov. 2005.
[7] Z. Wang, A. C. Bovik, and B. L. Evans, “Blind measurement of blocking artifacts in images,” in Proc. IEEE Int. Conf. Image Process., vol. 3. Sep. 2000, pp. 981–984.
[8] Z. Wang, H. R. Sheikh, and A. C. Bovik, “No-reference perceptual quality assessment of JPEG compressed images,” in Proc. IEEE Int.Conf. Image Process., vol. 1. Sep. 2002, pp. I-477–I-480.
[9] X. Gao, W. Lu, D. Tao, and X. Li, “Image quality assessment based on multiscale geometric analysis,” IEEE Trans. Image Process., vol. 18, no. 7, pp. 1409–1423, Jul. 2009.
[10] U. Engelke, M. Kusuma, H. J. Zepernick, and M. Caldera, “Reducedreference metric design for objective perceptual quality assessment in wireless imaging,” Signal Process., Image Commun., vol. 24, no. 7, pp. 525–547, 2009.
BIOGRAPHY
K.GOWTHAMI completed B.Tech in ECE Department from Sri Venkateswara Institute Of Technology, Anantapur. Pursuing masters in Digital Electronics and Communication Systems in PVKK Institute of Technology, Anantapur.
Mr. S.RAVI KUMAR completed B.Tech in ECE Department from G PULLA REDDY Engineering College, Kurnool. Completed Masters in Digital Systems and Computer Electronics in BITS Engineering College, Warangal. Currently working as Associate Professor in Dept of ECE , PVKK Institute of Technology ,Anantapur.