R E S E A R C H
Open Access
Improving throughput and fairness by improved
channel assignment using topology control
based on power control for radio
multi-channel wireless mesh networks
Aizaz U Chaudhry
*, Nazia Ahmad and Roshdy HM Hafez
Abstract
Multi-radio multi-channel (MRMC) wireless mesh networks (WMNs) achieve higher throughput using multiple simultaneous transmissions and receptions. However, due to limited number of non-overlapping channels, such networks suffer from co-channel interference, which degrades their performance. To mitigate co-channel interference, effective channel assignment algorithms (CAAs) are desired. In this article, we propose a novel CAA,
Topology-controlled Interference-aware Channel-assignment Algorithm(TICA), for MRMC WMNs. This algorithm uses topology control based on power control to assign channels to multi-radio mesh routers such that co-channel interference is minimized, network throughput is maximized, and network connectivity is guaranteed. We further propose to use two-way interference-range edge coloring, and call the improved algorithmEnhanced TICA(e-TICA), which improves the fairness among flows in the network. However, the presence of relatively long links in some topologies leads to conflicting channel assignments due to their high interference range. To address this issue, we propose to utilize minimum spanning tree rooted at the gateway to reduce conflicting channels, and in turn, improve medium access fairness among the mesh nodes. We call the improved algorithme-TICA version 2( e-TICA2). We evaluate the performance of the proposed CAAs using simulations in NS2. We show that TICA significantly outperforms the Common Channel Assignment scheme in terms of network throughput, and e-TICA and e-TICA2 achieve better fairness among traffic flows as compared to TICA. It is also shown that e-TICA2 leads to improved network throughput, as compared to TICA and e-TICA.
Keywords:channel assignment, fairness, interference-range edge coloring, topology control, wireless mesh networks
1. Introduction
In multi-radio multi-channel (MRMC) wireless mesh networks (WMNs), a key issue is the co-channel inter-ference from simultaneous transmissions of mesh nodes located within the interference range of each other, which degrades the capacity of the network. Mitigating such interference in the MRMC WMN architecture requires effective Channel Assignment (CA). This involves assigning a channel to each radio in a way that minimizes interference on any given channel as well as ensures network connectivity [1].
Topology control using transmit power control is a useful technique for reducing the co-channel interfer-ence in a WMN and increasing the network capacity. This is done by adjusting the transmission range (TR) of a mesh node by controlling its transmit power. The main goal of a Topology Control Algorithm (TCA) is to minimize the co-channel interference, enhance spatial channel reuse, and maintain network connectivity through the selection of minimum transmission power for each radio interface. Hence, mesh nodes transmit at the minimum power required to maintain connectivity with their immediate neighbors. This leads to multi-hop communication instead of long direct links and results in lower interference in the network.
* Correspondence: [email protected]
Department of Systems and Computer Engineering, Carleton University, Ottawa, ON, Canada
In this article, we propose centralized Channel Assign-ment Algorithms (CAAs), which build a controlled topology using power control with the goal of minimiz-ing interference between Mesh Routers (MRs) and ensuring network connectivity at the same time. The advantage of topology control based on power control lies in the fact that it improves network spatial reuse and hence, the traffic carrying capacity. To the best of the authors’knowledge, the proposed CAAs are the first of their kind to use topology control based on power control for CA in MRMC WMNs. The main contribu-tions of this study are as follows:
•A new TCA,Select x for less than x, that builds the network connectivity graph by selecting the nearest neighbors for each mesh node in the network with the objective of minimizing interference among MRs and enhancing frequency reuse as well as simultaneously ensuring a connected network.
•A new CAA, Topology-controlled Interference-aware
Channel-assignment Algorithm(TICA), which uses the
Select x for less than x TCA to intelligently assign the available channels to the MRs with the objective of minimizing interference and hence, improving network throughput. A preliminary work on TICA has been pre-sented in [2].
• An extension of TICA,Enhanced TICA (e-TICA), which, instead of using the one-way interference-range edge coloring approach of TICA, uses two-way interfer-ence-range edge coloring. e-TICA results in a more accurate CA, which leads to an enhancement in the fair-ness among traffic flows without compromising the net-work throughput. A preliminary net-work on e-TICA has been presented in [3].
• An enhancement of e-TICA,e-TICA version 2 (
e-TICA2), which employs a Minimum Spanning Tree
(MST) rooted at the gateway instead of a Shortest Path Tree (SPT) employed in TICA and e-TICA, to reduce conflicting channels. This approach improves medium access fairness among the mesh nodes, which leads to an improvement in the network throughput.
•A centralizedFailure Recovery Mechanism(FRM) for our proposed CAAs, which provides automatic and fast failure recovery by reorganizing the network to bypass the failed node and to restore connectivity. A prelimin-ary work on the proposed FRM has been presented in [4].
The rest of the article is organized as follows. In Sec-tion 2, we present existing literature related to CA schemes and schemes using topology control for CA. The network architecture for the proposed model is pre-sented in Section 3. In Section 4, we present the TCA, Select x for less than x, and the details of its phases. In Section 5, we explain the CA problem and present TICA along with the details of its phases. In Section 6,
we discuss the problem of one-way interference-range edge coloring and present e-TICA. In Section 7, we dis-cuss the problem of long links, and present e-TICA2 along with the details of its MST approach to counter this problem. In Section 8, we present the FRM for our proposed CAAs. In Section 9, we provide simulation results to evaluate the performance of the proposed CAAs. The article concludes in Section 10.
2. Related study
the technique of two-way interference-range edge color-ing to achieve a more accurate CA.
Topology control in WMNs is typically targeted toward reducing interference and improving spectral efficiency while maintaining network connectivity. Interference is confined by lowering the transmit power. Since transmit power is directly proportional to the distance between the nodes, a reasonable strategy is to replace the long links with shorter ones. Local Minimum Spanning Tree (LMST) is a TCA presented in [12], which uses MST to achieve short link lengths resulting in the medium being shared efficiently. In CAAs proposed in [13-15], the network topology has been built using MST. The motivation for using MST in these CA schemes is that shorter links resulting from MST imply more capacity in WMN by reducing interference with nearby links which use the same channel. Our proposed CAA, e-TICA2, minimizes con-flicting channels by employing an MST rooted at the gateway in combination with topology control based on power control and two-way interference-range edge coloring.
Since the main network resource, namely the fre-quency spectrum is limited, it must be shared fairly among the contending nodes. Achieving fairness in WMNs can broadly be categorized in terms of per-node and per-flow fairness. Per-flow fairness refers to equal share of the data among traffic flows arriving at the gateway. Unfairness among flows arises due to multiple flows sharing the same link. This causes congestion at such links which leads to unfairness among flows reach-ing the gateway. Per-node fairness refers to equal access for each node to the wireless medium. Unfairness in medium access arises in MRMC WMNs due to some nodes operating on a conflicting channel and contend-ing with each other for medium access on that channel. The authors have proposed an algorithm in [16] to improve the fairness by differentiating the traffic among the connections in a wireless multi-hop network. In [17], the authors propose a receiving node assistance feature in addition to the existing CSMA/CA protocol to remove exposed terminal problem and enhance fair-ness in multi-hop wireless networks. The authors have proposed a graph-based algorithm in [18] for improving fairness in WMNs that is based on employing multiple queues per node, using different back-off parameters and EIFS values. In [19], the authors have proposed a fair binary exponential back-off algorithm by adapting the contention window to reduce the effect of flow star-vation, thereby improving fairness in a WMN. All of these schemes have used Jain’s fairness index [20] as a measure of the network fairness. Unlike [16-19], our proposed CAAs, e-TICA and e-TICA2, improve fairness among flows through a more accurate CA and improve
medium access fairness by reducing the conflicting channels, respectively.
3. Network architecture
In our proposed model, each MR is equipped with five radios which operate on IEEE 802.11a [21] channels (5 GHz band). One of these radios is used for control traf-fic, while the other four radios are used for data traffic. Each radio interface of the multi-radio MR is equipped with an omni-directional antenna.
The IEEE 802.11a standard uses Orthogonal Fre-quency Division Multiplexing (OFDM) as the physical layer transmission technology. Out of the 12 available non-overlapping 802.11a channels, channel 12 is used for control radio on each MR and the remaining 11 channels are used for data radios. Since each MR is equipped with four data radios, it can communicate with a maximum of four neighbors for data communica-tion simultaneously, which implies that the Maximum Node Degree (MND) per node is four. The MND of four is selected in order to fully utilize the 11 available non-overlapping channels. Results have shown that with 12 available channels, network throughput increases up to an MND of four per node and saturates after that [5]. Roofnet [22] is an experimental WMN built by Massa-chusetts Institute of Technology (MIT). Similar to Roof-net, we assume that each mesh node has omni-directional antennas installed on the roof of a building and the propagation environment is characterized by a strong line-of-sight component. So, the channel propa-gation model used is either free-space propapropa-gation model or two-ray propagation model, depending on the cross-over distance.
4. Select x for less than xTCA 4.1. Gateway advertisement
Initially, the gateway broadcasts a “Hello” message on the control channel, announcing itself as the gateway. Each MR that receives this Hello message on the control channel over its control radio broadcasts it again and it is flooded throughout the network. The Hello message contains a hop-count field that is incremented at each hop during its broadcast. An MR may receive multiple copies of this message. However, the distance of an MR from the gateway is the shortest path length (shortest hop count) of the Hello message received by the MR through its control radio over different paths. In this way, each MR knows the next hop to reach the gateway using its control radio.
4.2. Topology control problem
to maintain the network connectivity with the use of minimum power [23]. The objective of the proposed Select x for less than x TCA is to build a connectivity graph with a small node degree to mitigate the co-chan-nel interference and enhance spatial chanco-chan-nel reuse as well as preserve network connectivity with the use of minimal power, as less transmit power translates to less interference.
4.3. Assumptions
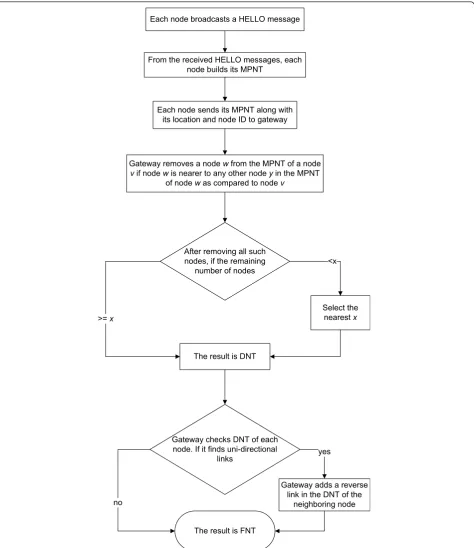
Our proposed TCA controls the network topology by selecting the nearest neighbors for each mesh node in the network with the objective of minimizing interfer-ence among MRs. The proposed TCA, which is shown in Figure 1, is based on the following assumptions:
•All mesh nodes start with the maximum transmis-sion power.
•Each mesh node has its location information. •Each mesh node uses an omni-directional antenna for both transmission and reception.
•Each mesh node is able to adjust its own transmis-sion power.
•The maximum transmission power is the same for
all mesh nodes.
•The maximum TR for any two mesh nodes to
com-municate directly is also the same.
•The initial topology graph created, when every mesh node transmits with maximum power, is strongly connected.
4.4. Phases ofSelect x for less than xTCA 4.4.1. Exchange of information between nodes
In the first exchange, each node broadcasts a Hello mes-sage at maximum power containing its node ID and position.
4.4.2. Building the maximum power neighbor table
From the information in the received Hello messages, each node arranges its neighboring nodes in ascending order of their distance. The result is the maximum power neighbor table (MPNT). Then, each node sends its MPNT along with its position and node ID to the gateway using its control radio.
4.4.3. Building the direct neighbor table
For each node in the network, the gateway builds a direct neighbor table (DNT). Based on the information
in the MPNT of node vand the MPNTs of its
neigh-bors, if (a) node w is in the MPNT of nodev and (b) node wis closer to any other node y in the MPNT of node w than to node v, then the gateway eliminates
node wfrom the MPNT of node v. If after removing
nodes from the MPNT of nodev, the remaining number of nodes in the MPNT of node vis equal to “x - 1,” then the gateway selects“x“ nearest nodes as neighbors of node v, which results in the DNT. However, after
removing nodes from the MPNT of node v, if the
remaining number of nodes is greater than or equal to “x,” the result is the DNT. We call the above algorithm
as Select x for less than x TCA, where x is a positive
integer.
4.4.4. Converting into bi-directional links
For each node in the network, the gateway converts the uni-directional links in the DNT of a node into bi-direc-tional links. For each uni-direcbi-direc-tional link, this is done by adding a reverse link in the DNT of the neighboring node. This converts the DNT into bi-directional DNT, which results in the Final Neighbor Table (FNT). 4.4.5. Calculating the minimum power required
For each node in the network, the gateway calculates the minimum power required to reach each of the nodes in the FNT of a node, using appropriate propa-gation model formulas. If the distance between two nodesu andv is less than the cross-over distance, i.e., d(u, v) < Cross_over_dist, Free Space propagation model is used, whereas if d(u, v) > Cross_over_dist, two-ray propagation model is used. Cross-over dis-tance is given by [24]
Cross over dist= 4πhthr
λ , (1)
wherehtandhrare the antenna heights of the
trans-mitter and receiver, respectively. The minimum power for the free-space propagation model is calculated as [24]
Pmin= RxThresh(4πd)
2
GtGrλ2
. (2)
The minimum power for the two-ray propagation model is given by [24]
Pmin= RxThresh(d)
4
GtGrh2th2r
, (3)
where Gt and Gr are the transmitter and receiver
antenna gains, respectively. RxThresh is the power
required by the radio interface of the receiving node to correctly receive the message.
5. TICA 5.1. CA problem
The CA problem in MRMC WMNs involves assigning a channel to each radio of an MR in a way that minimizes interference on any given channel and ensures connec-tivity between the mesh nodes.
5.1.1. Objectives
5.1.2. Constraints
In order to achieve these goals, the CAA should satisfy the following requirements:
• In order to communicate, a pair of mesh nodes
within transmission range of each other needs to have a common channel assigned to their end-point radios.
Each node broadcasts a HELLO message
From the received HELLO messages, each node builds its MPNT
The result is DNT After removing all such nodes, if the remaining
number of nodes
Gateway removes a nodewfrom the MPNT of a node
vif nodewis nearer to any other nodeyin the MPNT of nodewas compared to nodev
Select the nearestx
<x
Gateway checks DNT of each node. If it finds uni-directional
links
Gateway adds a reverse link in the DNT of the
neighboring node yes >=x
The result is FNT no
Each node sends its MPNT along with its location and node ID to gateway
• Links in direct interference range of each other should be assigned non-overlapping channels.
• The number of distinct channels that can be
assigned to an MR is bounded by the number of radios it has.
• The total number of non-overlapping channels is fixed.
•Since the traffic in a WMN is directed to and from the gateway, the traffic flows aggregate at routers close to the gateway. Links that are expected to support heavy traffic should be given more bandwidth than others. In other words, these links should use a radio channel that is shared by fewer nodes. Therefore, priority in CA should be given to links starting from the gateway based on the number of nodes that use a link to reach the gateway.
5.2. Interference-range edge coloring
If Kbe the number of available colors (channels), then for K ≥ 4, the distance-2 edge coloring problem, also known as strong edge coloring problem, is NP-complete [25]. A distance-2 edge coloring of a graph G is an assignment of colors to edges so that any two edges within distance-2 of each other have distinct colors. Two edges ofG are within distance-2 of each other if either they are adjacent or there is some other edge that is adjacent to both of them. The distance-2 edge color-ing has been used in [26] for CA, where the authors have described the interference model as two-hop inter-ference model. In this model, two edges interfere with each other if they are within two-hop distance. In other words, two edges cannot transmit simultaneously on the same channel if they are sharing a node or are adjacent to a common edge.
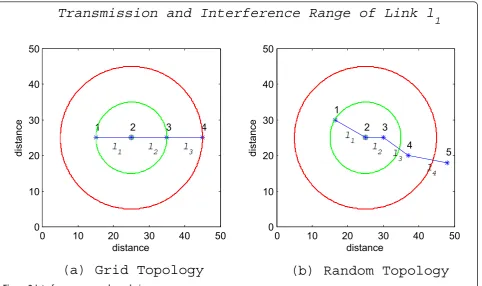
To minimize co-channel interference in a WMN, it is necessary to assign channels to links such that links within interference range of each other are assigned dif-ferent channels (colors). This problem can be termed as interference-range edge coloring, and the corresponding interference model can be called interference-range interference model. In a grid topology where links are of equal length, the interference-range edge coloring is similar to distance-2 edge coloring, as shown in Figure 2a. The channel assigned to linkl1 cannot be assigned
to links l2 andl3 as they are within the interference
range of Node 2, which is an end node of link l1. Note
that l2 andl3 are also within two-hop distance of l1.
However, in a random topology where links are of dif-ferent lengths due to the random nature of the topology, the interference-range edge coloring can be harder than distance-2 edge coloring, as shown in Figure 2b. In this case, the channel assigned to link l1 cannot be assigned
to links l2,l3, and l4 as they are within the interference
range of Node 2, which is an end node of link l1. Note
thatl2,l3, and l4are within three-hop distance ofl1.
In our proposed network model, the number of avail-able channels (colors) is 11 which means that K= 11. Based on its similarity to distance-2 edge coloring pro-blem which is NP-complete for K≥ 4, the interference-range edge coloring problem is, therefore, also NP-com-plete. Hence, we propose TICA, which is an approxi-mate algorithm for CA in MRMC WMNs. TICA has an overall computational complexity of O(N3), where Nis the number of nodes in the network.
5.3. Phases of TICA
TICA, as shown in Figure 3, has the following phases. 5.3.1. Topology control
In order to create the network connectivity graph with the aim of reducing the interference between MRs, net-work topology is controlled using power control at each MR. All nodes send their MPNTs to the gateway using their control radio. Note that in order to send its MPNT to the gateway, each MR knows the next hop to reach the gateway using its control radio via gateway advertisement process. Gateway starts with theSelect 1
for less than 1TCA and builds FNTs for all nodes. The
computational complexity of this phase isO(LM+ N3 +
LD2) ≈O(N3), sinceLM <N2 and LD2 <N3, whereLMis
the number of links in the MPNTs of all nodes, LD is
the number of links in the DNTs of all nodes, andNis the number of nodes in the network.
5.3.2. Connectivity graph
Based on the FNTs of all nodes, the gateway builds the connectivity graph. It checks the resulting network for connectivity to ensure that it can reach any node in the network directly or through intermediate hops. If the resulting network is not connected, the gateway moves to a higher TCA by incrementing xin the Select x for
less than x TCA. The computational complexity of this
phase isO(LF + N), where LF<N2 and is the number of
links in the FNTs of all nodes in the network. 5.3.3. Minimum power-based SPT with an MND of 4 After ensuring that the connectivity graph is connected, the gateway builds the SPT based on the connectivity graph. The computational complexity of this phase isO(LF
5.3.4. Link ranking
The gateway calculates the rank of each link in the SPT based on the number of nodes that use a link to reach the gateway. Iflis a link and nis a node using linklto
whereNis the total number of nodes in the network. In, l is 1 if noden is using link l, and 0 otherwise. In
case of links with the same rank, link whose power of farthest node to the gateway is smallest is given a higher rank. If there are still links with the same rank, link with smallest node IDs is given a higher rank. The com-putational complexity of this phase isO(N2).
5.3.5. CA
The algorithm then assigns a channel to each link of the MPSPT according to its rank. The computational com-plexity of this phase isO(N3). It begins with assigning the 11 available channels to the 11 highest-ranked links such that channel 1 is assigned to first-ranked link. For the 12th-ranked link and onwards, the gateway checks the CA of all links within the interference range of both nodes that constitute that link. Out of the 11 available channels, those channels that are not assigned to any link within the interference range (IR) of both nodes
that constitute that link are termed as non-conflicting channels. If the gateway finds one or more non-conflict-ing channels, it assigns that channel to the link which has the highest channel number.
5.3.5.1. Least interfering channelIf the gateway cannot find any non-conflicting channel, it selects a channel that causes minimum interference to the link. Such a channel is called a Least Interfering Channel (LIC). 5.3.5.2. Interference levelTo find out the LIC, the gate-way builds the interference level (IL) for all 11 channels. LIC is the channel with minimum IL, which means that assigning this channel to the 12th-ranked link results in minimum interference in the network. For example, in order to build IL for channel 1, the gateway finds all links within IR of each of the two nodes that constitute the 12th-ranked link that use channel 1 and calculates IL of each link based on its rank and distance from a node of the 12th-ranked link. It sums up individual ILs of all links that use channel 1 within IR of each of the two nodes that constitute 12th-ranked link, to find out the total IL for channel 1. This is done by using
(IL)i=
where iis the channel that has value between 1 and 11, (IL)i is IL of channeli,r is rank of link using
chan-neli, Ris maximum rank assigned to a link in MPSPT,
0 10 20 30 40 50
(a) Grid Topology
(b) Random Topology
0 10 20 30 40 50
Transmission and Interference Range of Link l
1
distance
distance
mis a link using channelithat is within IR of a node of the 12th-ranked link,d is distance from a node of link m to a node of the 12th-ranked link, and a is 2 or 4 depending on cross-over distance.
If a link is emanating from either of the two nodes that constitute the 12th-ranked link and a channel has been assigned to that link, then IL for this channel is set to infinity. LIC is selected as
(IL)LIC= min[(IL)1, (IL)2, ..., (IL)11]. (6)
Similarly, the gateway assigns channels to all the links in the MPSPT. Using its control radio, it then sends each mesh node the channel assignment and routing message (CARM). For each channel assigned to an MR, the CARM message contains the channel number and the neighbor node to communicate with using this channel. The CARM also contains the next hop to reach the gateway for data traffic. Based on the channel assigned to an MR to communicate with a neighbor and its distance to that neighbor, the MR applies power con-trol and adjusts its transmission power accordingly, using (2) or (3), depending on the cross-over distance.
6. e-TICA
TICA uses interference-range edge coloring for assign-ing a channel to a link, whereby it inspects the channel-assigned links within the interference range of both mesh nodes that constitute that link before assigning it a channel. However, this approach of one-way interfer-ence-range edge coloring does not find all the LICs in most cases. This leads to undetected hidden links which results in the CAA allocating the same channel to two links within the interference range of each others’ end nodes. This leads to decreased network throughput and fairness. This drawback of TICA has been addressed by employing two-way interference-range edge coloring in e-TICA. e-TICA results in an accurate CA thus redu-cing interference and improving fairness among flows without sacrificing the network throughput. Its compu-tational complexity is the same as that of TICA.
We investigate a scenario, as shown in Figure 4, where TICA, which is based on one-way interference-range edge coloring, has been used for CA. This scenario con-sists of a random topology comprised of 36 MRs where Node 15 is the gateway. The interference range is MRs send MPNT to GW
If any node in the SPT has MND > 4
GW keeps four links with the minimum weight
Yes
GW assigns 11 available channels to 11 highest ranked
links
For each link in SPT, GW builds link ranking
For 12thranked link and onwards, GW checks channel assignment
within its IR
If GW finds channels that are not assigned to any link within IR of a link
GW checks resulting network for connectivity
GW moves to a higher TCA
GW builds SPT based on minimum power
GW runs TCA & builds connectivity graph
GW checks resulting network for connectivity
GW moves to a higher TCA
Not connected
No
GW assigns channel with highest channel number
Yes
GW selects a LIC
No
Similarly, GW assigns channels to all links
Connected
Not connected
Connected
indicated by the circular disks in Figure 4. Link 23-19 is ranked nine and hence, it is allocated channel 9, which has not been allocated to any other link yet. Link 1-17 has a lower rank as it is used by four nodes to reach the gateway. Since the algorithm has already allocated the 11 channels, it searches the interference range of nodes 1 and 17 for an available channel. Link 1-17 is assigned channel 9 as the algorithm cannot find any other link using channel 9, as shown in Figure 4. From Figure 4, it can be observed that nodes 1 and 17 are in the interfer-ence range of nodes 23 and 19 of link 23-19, which is not identified by TICA because it is based on one-way interference-range edge coloring. In other words, link 23-19 becomes a hidden link during the CA phase of link 1-17. Eventually, links 1-17 and 23-19 share the same channel even though the nodes which constitute these links are within the interference range of each other. Therefore, the hidden link problem may lead to degradation in the network throughput and fairness.
The proposed algorithm, e-TICA, resolves the above problem by using two-way interference-range edge col-oring. When channels are being assigned to links, e-TICA inspects the links in the interference range of both nodes associated with both links. For example, in order to assign a channel to link 1-17, e-TICA checks the channels being used in the interference range of nodes 1 and 17, as well as the channel assigned to link 23-19. We term the new model as two-way interfer-ence-range edge coloring, which implies that links formed by nodes that are within the interference range of each other will not be allocated the same channel, provided that there is a channel available for allocation. Table 1 summarizes the CA with TICA as well as e-TICA for the scenario described above. As is evident from this table, e-TICA allocates channel 7 to link 1-17 instead of channel 9. TICA also allocates the same channel to links 19-36 and 1-31 in this scenario even though the nodes that constitute these links are within
0 50 100 150 200 250 300 350 400 450 500
the interference range of each other, whereas e-TICA allocates channel 8 to link 1-31 instead of channel 11, thereby eliminating the hidden link problem.
Tables 2 and 3 show a comparison of the number of LICs resulting from TICA and e-TICA for 25 different random topologies (RTs) of a 36-node network and a 100-node network, respectively. As can be seen from these tables, TICA does not find all the LICs in most cases, whereas e-TICA is able to do so and thus results in a more accurate CA.
7. e-TICA2
The two-way interference-range edge-coloring intro-duced in e-TICA leads to an improved CA scheme and eliminates the problem of hidden links. However, in some topologies, owing to the long links, LICs result in increasing the interference. Hence, reuse of a channel within the interference range causes significant decrease in network throughput. Since the long links contribute to interference, they should be replaced with shorter links wherever possible. So, a modified CAA, e-TICA2, is presented in this section which employs an MST rooted at the gateway instead of a SPT to reduce the occurrence of conflicting channels, thereby, improving fairness in medium access and network throughput. Its computational complexity is also same as that of TICA.
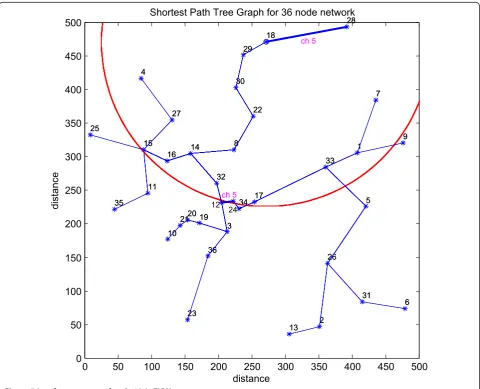
7.1. Improving fairness in medium access using MST A scenario as shown in Figure 5 is investigated, where a topology encounters LICs while utilizing the e-TICA algorithm. Due to LICs, the network throughput decreases as a result of interference caused by links using the same channel within the interference range. In this scenario, link 18-28 has been assigned channel 5 by e-TICA and link 12-24 has also been allocated channel 5. The circular disk in Figure 5 indicates the interfer-ence range of node 18. Since the link 12-24 is in the
interference range of node 18, both nodes 28 and 24 will compete for access to the medium on this channel. Specifically, when node 24 needs to communicate with node 12 on channel 5 and node 28 needs to communi-cate with node 18 on the same channel simultaneously, contention for medium access based on CSMA/CA will occur on channel 5. The presence of LICs affects the fairness in medium access and hence the network throughput, since some nodes, such as nodes 28 and 24, compete for access to the medium.
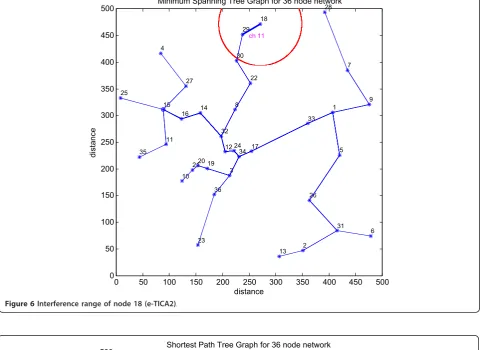
A new approach is proposed for maximizing spatial channel reuse and reducing LICs by utilizing an MST rooted at the GW instead of the SPT. The motivation behind using MST is to achieve short link lengths which will result in the medium being shared efficiently by reducing LICs. Since transmit power is proportional to the distance between the nodes, the shorter the distance, the lower the transmit power. Less transmit power translates to less interference which leads to better spa-tial channel reuse. The modified CAA, e-TICA2, replaces the SPT approach of e-TICA with the MST approach. In both approaches, the link weight is the minimum transmit power required by a node to reach its neighbor for building the minimum power based tree. Figure 6 shows that utilizing MST results in shorter hops between nodes and hence, the interference range of node 18 is shrunk. Table 2 also shows the number of LICs resulting from e-TICA2 for 25 different RTs of a 36-node network. In the investigated scenario, the SPT approach results in 6 LICs, whereas the MST approach, indicated by RT 17 in Table 2, reduces the number of LICs to 4. e-TICA2 results in a reduction of LICs, as indicated in Tables 2 and 3, which implies that nodes have better access to the medium whenever they have data to transmit. Thus, competition with other nodes for access to the medium on the assigned channel is lower. So, utilizing minimum power-based MST (MPMST) will improve the fairness in medium access and hence, the network throughput.
7.2. Improving throughput using four radios of the gateway
The maximum achievable throughput of a topology is limited by the performance bottleneck at the links which originate from the GW, as well as the number of traffic sources using those links. The maximum data
Table 1 Comparison of TICA and e-TICA channel assignments
Link Channel assignment (TICA) Channel assignment (e-TICA)
23-19 9 9
1-17 9 7
19-16 11 11
1-31 11 8
Table 2 Comparison of LICs identified by TICA, e-TICA, and e-TICA2 (36-node network)
CAA RT
1 2 3 4 5 6 7 8 9 10 11 12 13 14 15 16 17 18 19 20 21 22 23 24 25
TICA 1 5 2 2 1 2 2 1 2 2 4 3 2 3 2 3 4 0 1 2 1 2 2 4 3
e-TICA 3 8 4 3 2 2 2 1 3 3 4 4 2 3 2 3 6 0 1 3 3 3 2 4 4
rates achievable at a link with one, two, and three sources are 8.192, 16.384, and 24.576 Mbps, respectively. IEEE 802.11a supports a maximum data rate of 54 Mbps. However, the effective data rate is 24.748 Mbps, while the rest is consumed by overhead. Hence, if there are more than three sources sharing a link, there is a traffic bottleneck at that link with the achievable data rate being limited to 24.748 Mbps. The maximum achievable throughput and in turn the throughput per-formance of e-TICA2 can be improved by utilizing all four radios of the gateway. In order to utilize all four
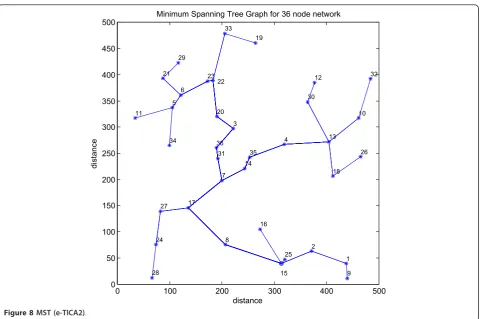
radios of the gateway, e-TICA2 builds an MPMST from the gateway utilizing its four nearest neighbors.
A scenario is investigated using e-TICA and e-TICA2 as shown in Figures 7 and 8, respectively. From Figure 7, it can be seen that e-TICA results in the GW utilizing only one of its four radios. This limits the maximum achievable throughput to 24.748 Mbps. As shown in this figure, all sources are using the same link to reach the GW which causes a bottleneck at link 15-25. This traffic bottleneck limits the throughput performance of the network by confining the maximum achievable
Table 3 Comparison of LICs identified by TICA, e-TICA, and e-TICA2 (100-node network)
CAA RT
Shortest Path Tree Graph for 36 node network
distance
0 50 100 150 200 250 300 350 400 450 500
Minimum Spanning Tree Graph for 36 node network
distance
distance
ch 11
Figure 6Interference range of node 18 (e-TICA2).
0 50 100 150 200 250 300 350 400 450 500
Shortest Path Tree Graph for 36 node network
distance
distance
throughput. Applying e-TICA2 to the same topology increases the maximum achievable throughput to 49.3 Mbps. As shown in Figure 8, e-TICA2 ensures that the GW utilizes all four of its radios. The traffic load is now distributed among the four links of the GW where the maximum traffic load on the links 15-8, 15-16, 15-25, and 15-2 is 24.748, 8.192, 8.192, and 8.192 Mbps, respectively. Thus, the traffic load is distributed among the four radios in e-TICA2 as compared to one radio in e-TICA. This reduces traffic congestion on the links which are close to the GW and results in an improve-ment in the throughput and fairness of the network. The throughput of this scenario with TICA and e-TICA is 24.6 Mbps, whereas with e-TICA2 is 49.3 Mbps.
8. FRM
The proposed CAAs are fault-tolerant and support auto-matic and fast failure recovery. In case of node failure, the FRM is initiated by the gateway.
All nodes send periodic “keep-alive” messages to the gateway on the control channel using their control radios. The keep-alive message tells the gateway that the node is active. If the gateway does not receive three consecutive keep-alive messages from a node z,
then it concludes that node z has failed and is no
longer active. The gateway then deletes the MPNT for
this node and deletes node z from MPNTs of all its
neighboring nodes. Note that the gateway received MPNTs of all nodes during the setup phase. During the setup phase, nodes exchanged Hello messages, which were transmitted at maximum power on the control channel and contained the node ID and node position. From the received Hello messages, each node built an MPNT by arranging its neighboring nodes in ascending order of their distance. Each node then sent its MPNT to the gateway over the control channel using its control radio.
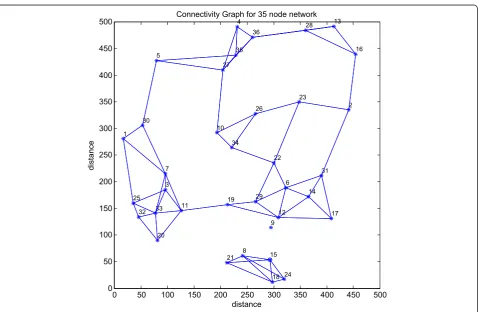
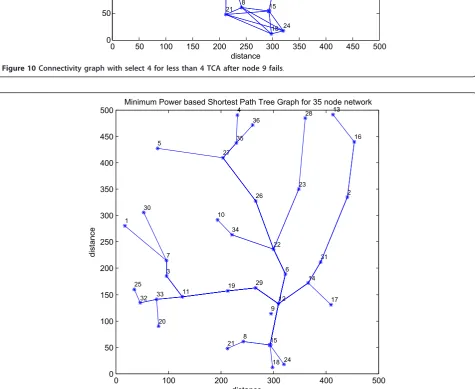
After detecting the failed node, deleting its corre-sponding MPNT and deleting it from the MPNTs of its neighbors, the gateway builds the DNT for each node using theSelect x for less than xTCA. The gateway con-verts the uni-directional links in the DNT of a node into bi-directional links, which results in the FNT of that node. Similarly, the gateway builds the FNTs for all active nodes. Based on the FNTs of all active nodes in the network, the gateway builds the connectivity graph and checks the resulting network for connectivity. After ensuring that the connectivity graph is connected, the gateway builds the MPSPT (as in TICA and e-TICA) or MPMST (as in e-TICA2), with an MND of four. After ensuring that the minimum power-based tree is con-nected, the gateway builds the link ranking. Based on
0 100 200 300 400 500
Minimum Spanning Tree Graph for 36 node network
distance
distance
the link ranking, the gateway assigns the channels to links.
The gateway then sends the new CARM to all nodes in the network on the control channel. Each MR receives the CARM on the control channel over its con-trol radio and compares the existing CA with the updated CA. It switches its radios to new channels in case the new CA is different from the old one. Based on the channel assigned to an MR to communicate with a neighbor and its distance to that neighbor, the MR applies power control and adjusts its transmission power accordingly, using (2) or (3) depending on the cross-over distance. Each MR also updates its next hop required to reach the gateway for data traffic. Figures 9, 10, and 11 highlight the FRM, which reorganizes the network to bypass the failed Node 9 and restores connectivity.
9. Performance evaluation
The performance of our proposed CAA, TICA, for MRMC WMNs is compared against the Common Channel Assignment (CCA) scheme [27] as well as its variant, CCA with topology control (CCA-TC), in terms of network throughput. CCA is a well known and com-monly used benchmark scheme, which has also been
used before by other first-of-their-kind schemes, such as [5,7], for performance comparison. Then, we have com-pared the performance of e-TICA and e-TICA2 with TICA in terms of throughput ratio and fairness ratio. If xibe the throughput of a flowiand Nis the total
num-ber of flows (sources) in the network, then the Jain’s fairness index,FJ, is given by
FJ=
Absolute fairness is achieved whenFJ = 1 and absolute
unfairness is achieved whenFJ = 1/N.
For the purpose of comparison between the fairness of CAAs, we define the‘Fairness Ratio’,FX,Y, as
FX,Y = FJ,X FJ,Y
, (8)
whereX andYcould be TICA, e-TICA, or e-TICA2.
Therefore,FX,Y> 1 indicates that fairness of CAA X is
better than that of CAAY.
The‘Throughput Ratio’, TR, is defined as the ratio of
the throughput achieved by e-TICA2, e-TICA, and TICA over their maximum achievable throughputs,
0 50 100 150 200 250 300 350 400 450 500
Connectivity Graph for 35 node network
distance
distance
0 50 100 150 200 250 300 350 400 450 500
Connectivity Graph for 35 node network
distance
distance
Figure 10Connectivity graph with select 4 for less than 4 TCA after node 9 fails.
0 100 200 300 400 500
Minimum Power based Shortest Path Tree Graph for 35 node network
distance
distance
respectively. TR= 1 indicates that the algorithm has
achieved the maximum achievable throughput for that particular topology.
In the CCA scheme, all MRs have four radio inter-faces. The first radio on each MR is tuned to the first non-overlapping channel; the second radio is tuned to the second non-overlapping channel, and so on. In this scheme, MRs do not control their power, transmit with the same maximum power, and use AODV (Ad-hoc On-Demand Distance Vector) routing protocol [28]. In the CCA-TC scheme, the MRs follow the same network model as that proposed in Section 3. In this scheme, the network topology is controlled using theSelect x for less
than xTCA. However, the channels are assigned to the
links of the MPSPT similar to the CCA scheme. From the CARM, each MR applies power control based on the channel assigned to an MR to communicate with a neighbor and its distance to that neighbor as well as updates its next hop.
9.1. Simulation environment
The performance of the proposed CAAs has been evalu-ated using simulations which have been carried out in NS2 (version 2.30) [29]. The original model in NS2 was modified using the procedure given in [30] to create multi-interface mesh nodes. All radios are IEEE 802.11a radios that support 12 channels. The packet reception threshold is set to -65 dBm in order to achieve a maxi-mum data rate of 54 Mbps supported by IEEE 802.11a. In order to achieve a strongly connected topology, the maximum transmission power for all radios is set to 27 dBm. RTS/CTS is disabled.
9.2. Network topology
A random topology has been used for the evaluation, in which MRs are distributed randomly according to a uni-form distribution in a 500 × 500 m2 area. Twenty-five different random topologies of a 36-node network and a 100-node network are considered. Irrespective of its location, Node 15 is set to be the gateway for all ran-dom topologies.
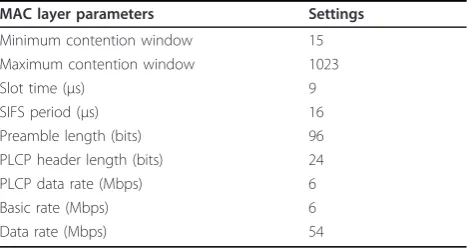
9.3. Simulation parameters
The physical (PHY) and medium access control (MAC) layer settings used for the simulations are shown in Tables 4 and 5, respectively. The MRs at the periphery of the network are the traffic sources and send traffic to the gateway simultaneously, thus representing a scenario in which multiple flows within the WMN interfere with each other. Each of these nodes generates an 8 Mbps Constant Bit Rate UDP traffic stream consisting of 1024 bytes packets for 100 s. The propagation model is cho-sen to be two-ray propagation model if the distance
between two nodes is greater than the cross over dis-tance and the free space propagation model otherwise.
9.4. Simulation results 9.4.1. TICA versus CCA
9.4.1.1. Network throughput Tables 6 and 7 and Fig-ures 12 and 13 show the results for the average network throughput of all three CAA schemes for 25 different random topologies of the 36-node network and the 100-node network, respectively. These results clearly indicate that TICA significantly outperforms the other two schemes.
9.4.2. e-TICA versus TICA
9.4.2.1. Throughput ratio As stated earlier, the maxi-mum achievable throughput of a topology is limited by the performance bottleneck at the links that originate from the gateway, as well as the number of traffic sources using these links. For the scenario in Figure 4, there are four links emanating from the GW. The maxi-mum achievable throughput for links 15-2 and 15-5 is 8.192 Mbps each since there is only one source using each link. The maximum achievable throughput for link 15-31 is 24.576 Mbps since there are three sources using this link. The maximum achievable throughput for link 15-8 is limited to 24.748 Mbps since there are more than three sources using this link. Hence, the total max-imum achievable throughput for this scenario is 65.7 Mbps.
In Tables 8 and 9 and Figures 14 and 15, the through-put ratios of e-TICA and TICA over the maximum achievable throughput for 25 different realizations of the
Table 4 PHY layer configuration in NS2
Physical layer parameters Settings
TX/RX antenna height (m) 3
Gain of TX/RX antenna 1
Packet capture threshold (dB) 10 Packet reception threshold (Watts) 3.16227e-10 Carrier sense threshold (Watts) 7.90569e-11
Table 5 MAC layer configuration in NS2
MAC layer parameters Settings
Minimum contention window 15 Maximum contention window 1023
Slot time (μs) 9
SIFS period (μs) 16
Preamble length (bits) 96 PLCP header length (bits) 24
PLCP data rate (Mbps) 6
Basic rate (Mbps) 6
random topology for the 36-node network and the 100-node network are shown, respectively. The difference in
TR achieved by e-TICA and TICA is apparent from
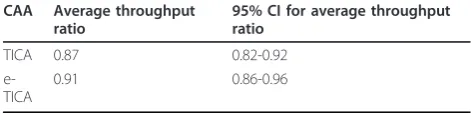
these results. For the 100-node network, the averageTR
achieved by e-TICA is 9% more than that achieved by TICA.
9.4.2.2. Fairness ratioIn Tables 10 and 11 and Figures 16 and 17, the FRamong traffic flows in the network
using e-TICA is compared with that achieved using TICA for 25 different realizations of the random topol-ogy for the 36-node network and the 100-node network, respectively, using (8).FR> 1 indicates better fairness by
e-TICA than by TICA. It is apparent from these results that e-TICA outperforms TICA in terms of fairness. For the 100-node network, the averageFRover the 25
ran-dom topologies is 1.20. This improvement is due to the two-way interference-range edge coloring during CA, which results in the elimination of hidden links leading to a more accurate CA with e-TICA. As a result, fair-ness among traffic flows in the network is improved with e-TICA without sacrificing the average network throughput.
9.4.3. e-TICA2 versus e-TICA and TICA
TICA and e-TICA use the SPT approach to build a minimum power-based tree from the gateway to each node whereas e-TICA2 employs the MST approach for
Table 6 Results for network throughput (36-node network)
CAA Average
throughput
95% CI interval for average throughput
TICA 46.66 41.67-51.65
CCA-TC 14.39 10.69-18.09
CCA 14.59 11.86-17.32
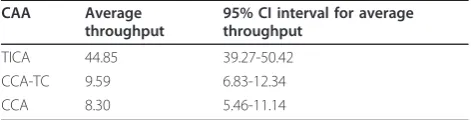
Table 7 Results for network throughput (100-node network)
CAA Average
throughput
95% CI interval for average throughput
TICA 44.85 39.27-50.42
CCA-TC 9.59 6.83-12.34
CCA 8.30 5.46-11.14
0 5 10 15 20 25
0 10 20 30 40 50 60 70 80
Random Topology Index
Average Throughput (Mbps)
Throughput Comparison for 36 node network
TICA CCA−TC CCA
the same. For a fair comparison, we have ensured that the number of traffic sources is the same for all three CAAs in the following way. IfA = {end nodes for SPT}
and B = {end nodes of MST}, then for comparing all
three CAAs, we have made a super set ‘C’ which is defined as C = A U B. Hence,C = {end nodes of SPT and MST}. Thus, the traffic sources in each realization of the random topology for each CAA are the end nodes of the SPT and the end nodes of the MST. 9.4.3.1. Throughput ratioTables 12 and 13 and Figures 18 and 19, which show a comparison of theTRfor the
three CAAs for the 36-node network and the 100-node network, respectively, indicate that e-TICA2 outper-forms TICA and e-TICA in most random topologies.
For the 100-node network, the average TRachieved by
e-TICA2 is 14% more than that achieved by e-TICA and 23% more than that achieved by TICA. This improvement is due to the MST approach and the use of maximum possible radios out of the four available radios of the GW to build the MST. MST rooted at the gateway replaces long links with shorter ones. Shorter hops lead to shrinking the interference range which in turn leads to better spatial reuse. Hence, LICs are reduced, thereby improving fairness of medium access for the mesh nodes. Also, utilizing the maximum possi-ble radios of the GW to build the MST results in the distribution of the traffic load among the links of the GW, thereby, reducing the traffic bottleneck at the GW.
0 5 10 15 20 25
0 10 20 30 40 50 60 70 80
Random Topology Index
Average Throughput (Mbps)
Throughput Comparison for 100 node network
TICA CCA−TC CCA
Figure 13Throughput comparison for 100-node network (TICA versus CCA).
Table 8 Results for throughput ratio (36-node network)
CAA Average throughput
ratio
95% CI for average throughput ratio
TICA 0.87 0.82-0.92
e-TICA
0.91 0.86-0.96
Table 9 Results for throughput ratio (100-node network)
CAA Average throughput
ratio
95% CI for average throughput ratio
TICA 0.82 0.75-0.88
e-TICA
0 5 10 15 20 25 0
0.2 0.4 0.6 0.8 1 1.2
Random Topology Index TR
Comparison of Throughput Ratio for 36 node network
TICA e−TICA
Figure 14Comparison of throughput ratio for 36-node network (e-TICA versus TICA).
0 5 10 15 20 25
0 0.2 0.4 0.6 0.8 1 1.2
Random Topology Index T R
Comparison of Throughput Ratio for 100 node network
TICA e−TICA
9.4.3.2. Fairness ratioTables 14 and 15 and Figures 20 and 21 show that fairness ratio of e-TICA2 is better than that of TICA but less than that of e-TICA. For the 100-node network, the average fairness ratio of e-TICA2 over TICA is 1.07 whereas the average fairness ratio of e-TICA2 over e-TICA is 0.97.
These results clearly show that e-TICA2 leads to improved network throughput, as compared to e-TICA and TICA. Also, e-TICA2 is fairer than TICA but less fair as compared to e-TICA. In e-TICA2, MST leads to shorter links/hops having shorter interference range,
which leads to reduced LICs, improved fairness in med-ium access and hence, improved network throughput. Although MST leads to shorter hops but it also leads to more hops from the source to the gateway and the aver-age number of hops from the sources to gateway increases. Due to these more hops from the sources to the gateway, more flows pass through the same link and have to share that link, which negatively impacts the fairness among the flows in the network.
10. Conclusion
In this article, we have introduced Select x for less than
x TCA, which minimizes the co-channel interference by
selecting the nearest neighbors for each mesh node in the network. We have introduced TICA, which is a fixed and centralized CAA for MRMC WMNs. It employs topology control based on power control by usingSelect x for less than xTCA for building the con-nectivity graph. It assigns channels to the multi-radio mesh nodes with the objective of improving the network throughput by minimizing the co-channel interference as well as ensures network connectivity. As verified by simulation results, TICA significantly outperforms the CCA scheme and its variant, CCA-TC scheme, in terms
Table 10 Results for fairness ratio (36-node network)
CAA Average fairness
ratio
95% CI for average fairness ratio
e-TICA over TICA
1.08 1.01-1.16
Table 11 Results for fairness ratio (100-node network)
CAA Average fairness
ratio
95% CI for average fairness ratio
e-TICA over TICA
1.20 1.11-1.29
0 5 10 15 20 25
0 0.2 0.4 0.6 0.8 1 1.2 1.4 1.6 1.8 2
Random Topology Index
F R
Comparison of Fairness Ratio for 36 node network
e−TICA over TICA
of network throughput. We proposed a new FRM for our proposed CAAs, which supports automatic and fast failure recovery. The GW runs the FRM in case of node failure.
We have shown that enhancements made to TICA lead to an improved CAA, e-TICA, which is verified by the simulation results presented herein. The key objec-tive during the CA phase in an MRMC WMN is to eliminate the presence of conflicting channels within the interference range of nodes. However, due to the avail-ability of a limited number of orthogonal channels, this is not always possible. Hence, a CAA that reduces inter-ference among nodes and provides maximum spatial reuse is needed. The two-way interference-range edge coloring model, introduced in e-TICA, implies that links formed by nodes that are within the interference range of each other will not be allocated the same channel, provided that there is a channel available for allocation. This leads to a better CA strategy yielding an improved
CAA, e-TICA, which improves the fairness among
traf-fic flows without compromising the network
throughput.
We have shown that enhancements made to e-TICA lead to a more efficient CAA, e-TICA2, which has been verified by the simulation results. To overcome the co-channel interference problem caused by long links in a random topology, e-TICA2 utilizes an MST rooted at the GW. The shorter links resulting from MST lead to a small interference range. Replacing SPT with MST in e-TICA2 leads to the reduction of LICs, which reduces the interference and improves medium access fairness, thereby, increasing the network throughput. The simula-tion results indicate that the average throughput ratio over 25 random topologies for the 100-node network, using TICA2, is 14% more than that achieved by e-TICA and 23% more than that achieved by e-TICA. The fairness among traffic flows with e-TICA2 is better than
0 5 10 15 20 25
0 0.2 0.4 0.6 0.8 1 1.2 1.4 1.6 1.8 2
Random Topology Index
F R
Comparison of Fairness Ratio for 100 node network
e−TICA over TICA
Figure 17Comparison of fairness ratio for 100-node network (e-TICA versus TICA).
Table 12 Results for throughput ratio (36-node network)
CAA Average throughput
ratio
95% CI for average throughput ratio
e-TICA2
0.94 0.89-0.99
e-TICA 0.90 0.83-0.97
TICA 0.84 0.77-0.91
Table 13 Results for throughput ratio (100-node network)
CAA Average throughput
ratio
95% CI for average throughput ratio
e-TICA2
0.95 0.92-0.98
e-TICA 0.83 0.76-0.91
0 5 10 15 20 25 0
0.2 0.4 0.6 0.8 1 1.2
Random Topology Index TR
Comparison of Throughput Ratio for 36 node network
e−TICA2 e−TICA TICA
Figure 18Comparison of throughput ratio for 36-node network (e-TICA2 versus e-TICA and TICA).
0 5 10 15 20 25
0 0.2 0.4 0.6 0.8 1 1.2
Random Topology Index T R
Comparison of Throughput Ratio for 100 node network
e−TICA2 e−TICA TICA
0 5 10 15 20 25 0
0.5 1 1.5 2 2.5 3
Random Topology Index F R
Comparison of Fairness Ratio for 36 node network
e−TICA2 over e−TICA e−TICA2 over TICA
Figure 20Comparison of fairness ratio for 36-node network (e-TICA2 versus e-TICA and TICA).
0 5 10 15 20 25
0 0.5 1 1.5 2 2.5 3
Random Topology Index
F R
Comparison of Fairness Ratio for 100 node network
e−TICA2 over e−TICA e−TICA2 over TICA
that with TICA but less than that with e-TICA. The two enhancements of utilizing an MST and maximum possi-ble out of the four radios of the GW, when coupled together, yield an improved CAA, e-TICA2, which is successful in improving the medium access fairness by reducing the conflicting channels, thereby increasing network throughput, while also improving the fairness among traffic flows.
The propagation model used is free-space model or two-ray model depending upon the cross-over distance. As part of future work, the performance of the proposed CAAs may be tested under more realistic propagation models, such as Shadowing and Rayleigh-fading.
Competing interests
The authors declare that they have no competing interests.
Received: 25 October 2011 Accepted: 30 April 2012 Published: 30 April 2012
References
1. H Skalli, S Ghosh, SK Das, L Lenzini, M Conti, Channel assignment strategies for multi-radio wireless mesh networks: issues and solutions. IEEE Commun Mag.45(11), 86–93 (2007)
2. AU Chaudhry, RHM Hafez, O Aboul-Magd, SA Mahmoud, Throughput improvement in multi-radio multi-channel 802.11a-based wireless mesh networks, inIEEE Globecom 2010, Miami, USA, pp. 1–5 (6-10 December 2010). doi: 10.1109/GLOCOM.2010.5684193
3. N Ahmad, AU Chaudhry, RHM Hafez, Enhanced topology-controlled interference-aware channel assignment for multi-radio multi-channel wireless mesh networks, inIFIP Wireless Days 2011, Niagra, Canada, pp. 1–6 (10-12 October 2011). doi: 10.1109/WD.2011.6098188
4. AU Chaudhry, RHM Hafez, O Aboul-Magd, SA Mahmoud, Fault-tolerant and scalable channel assignment for multi-radio multi-channel IEEE 802.11a-based wireless mesh networks, inIEEE Globecom 2010 Workshop on Mobile
Computing and Emerging Communication Networks 2010 (MCECN 2010),
Miami, USA, pp. 1113–1117 (6-10 December 2010). doi: 10.1109/ GLOCOMW.2010.5700108
5. A Raniwala, K Gopalan, T Chiueh, Centralized channel assignment and routing algorithms for multi-channel wireless mesh networks. ACM MC2R. 8(2), 50–65 (2004)
6. P Kyasanur, N Vaidya, Routing and interface assignment in multi-channel multi-interface wireless networks, inIEEE WCNC 2005, New Orleans, USA, pp. 2051–2056 (13-17 March 2005). doi: 10.1109/WCNC.2005.1424834
7. K Ramachandran, E Belding, K Almeroth, M Buddhikot, Interference-aware channel assignment in multi-radio wireless mesh networks, inIEEE
INFOCOM 2006, Barcelona, Spain, pp. 1–12 (23-29 April 2006). doi: 10.1109/
INFOCOM.2006.177
8. A Raniwala, T Chiueh, Architecture and algorithms for an IEEE 802.11-based multi-channel wireless mesh network, inIEEE INFOCOM 2005, Miami, USA, pp. 2223–2234 (13-17 March 2005). doi: 10.1109/INFCOM.2005.1498497 9. R Koshy, L Ruan, A joint radio and channel assignment (JRCA) scheme for
802.11-based wireless mesh networks, inIEEE Globecom Workshops 2009, Honolulu, USA, pp. 1–6 (30 November-1 December 2006). doi: 10.1109/ GLOCOMW.2009.5360773
10. S Avallone, IF Akyildiz, A channel assignment algorithm for multi-radio wireless mesh networks. Comput Commun.31(7), 1343–1353 (2008) 11. AP Subramanian, H Gupta, SR Das, C Jing, Minimum interference channel
assignment in multiradio wireless mesh networks. IEEE Trans Mob Comput. 7(12), 1459–1473 (2008)
12. N Li, J Hou, L Sha, Design and analysis of an MST-based topology control algorithm. IEEE Trans Wirel Commun.4(3), 1195–1206 (2005)
13. H Huang, X Cao, X Wang, Topology simplification and channel assignment in multi-radio wireless mesh networks. inIEEE International Conference on
Systems, Man and Cybernetics 2008 (SMC 2008),Singapore1285–1290 (12-15
October 2008). doi: 10.1109/ICSMC.2008.4811461
14. MK Marina, SR Das, A topology control approach for utilizing multiple channels in multi-radio wireless mesh networks, in2nd International
Conference on Broadband Networks, 2005, Boston, USA, pp. 381–390 (3-7
October 2005). doi: 10.1109/ICBN.2005.1589641
15. K Athota, A Negi, CR Rao, Interference-traffic aware channel assignment for MRMC WMNs, inIEEE 2nd International Advance Computing Conference 2010
(IACC 2010), Patiala, India, pp. 273–278 (19-20 February 2010). doi: 10.1109/
IADCC.2010.5422998
16. DD Vergados, DJ Vergados, A Sgora, D Vouyioukas, I Anagnostopoulos, Enhancing fairness in wireless multi-hop networks, in3rd International
Conference on Mobile Multimedia Communications 2007 (MobiMedia 2007),
Nafpaktos, Greece, pp. 1–6 (27-29 August 2007). ISBN 978-963-06-2670-5 17. M Durvy, O Dousse, P Thiran, Self-organization properties of CSMA/CA
systems and their consequences on fairness. IEEE Trans Inf Theory.55(3), 931–943 (2009)
18. S Nahle, N Malouch, Graph-based approach for enhancing capacity and fairness in wireless mesh networks, inIEEE Globecom 2009, Honolulu, USA, pp. 1–7 (30 November - 4 December 2009). doi: 10.1109/
GLOCOM.2009.5425230
19. K Ronasi, S Gopalakrishnan, V Wong, Flow starvation mitigation for wireless mesh networks, inIEEE WCNC 2009, Budapest, Hungary, pp. 1–6 (5-8 April 2009). doi: 10.1109/WCNC.2009.4917728
20. R Jain,The Art of Computer Systems Performance Analysis: Techniques for
Experimental Design, Measurement, Simulation, and Modeling,
(Wiley-Interscience, New York, 1991)
21. IEEE Standard for Information Technology-Telecommunications and Information Exchange Between Systems-Local and Metropolitan Area Networks-Specific Requirements–Part 11: Wireless LAN MAC and PHY Specifications IEEE Std 802.11-2007. Revision of IEEE Std 802.11-1999 22. J Bicket, D Aguayo, S Biswas, R Morris, Architecture and evaluation of an
unplanned 802.11b mesh network, in11th Annual International Conference
on Mobile Computing and Networking 2005 (MOBICOM 2005), Cologne,
Germany, pp. 31–42 (28 August - 2 September 2005). doi: 10.1145/ 1080829.1080833
23. V Kawadia, PR Kumar, Principles and protocols for power control in wireless ad hoc networks. IEEE J Sel Areas Commun (Special Issues in Wireless Ad Hoc Networks).23(1), 76–88 (2005)
24. T Rappaport,Wireless Communications: Principles and Practice, 2nd edn. (Prentice Hall, Upper Saddle River, NJ, 2002)
25. M Mahdian, On the computational complexity of strong edge coloring. Disc Appl Math.118, 239–248 (2002)
26. M Shin, S Lee, Y Kim, Distributed channel assignment for multi-radio wireless networks, inIEEE International Conference on Mobile Ad hoc and
Sensor Systems 2006, Vancouver, Canada, pp. 417–426 (9-12 October 2006).
doi: 10.1109/MOBHOC.2006.278582
27. R Draves, J Padhye, B Zill, Routing in multi-radio, multi-hop wireless mesh networks, inACM MobiCom 2004, Philadelphia, USA, pp. 114–128 (26 Spetember - 1 October 2004). doi: 10.1145/1023720.1023732 Table 14 Results for fairness ratio (36-node network)
CAA Average fairness
ratio
95% CI for average fairness ratio
Table 15 Results for fairness ratio (100-node network)
CAA Average fairness
ratio
28. Ad Hoc On-Demand Distance Vector (AODV) Routing Ptotocol. RFC3561 http://www.ietf.org/rfc/rfc3561.txt
29. The VINT Project: Network Simulator–NS2 http://www.isi.edu/nsnam/ns/ 30. RA Calvo, JP Campo, Adding multiple interface support in NS-2, (University
of Cantabria, 2007) http://personales.unican.es/aguerocr/files/ ucMultiIfacesSupport.pdf
doi:10.1186/1687-1499-2012-155
Cite this article as:Chaudhryet al.:Improving throughput and fairness by improved channel assignment using topology control based on power control for multi-radio multi-channel wireless mesh networks.
EURASIP Journal on Wireless Communications and Networking2012 2012:155.
Submit your manuscript to a
journal and benefi t from:
7Convenient online submission
7 Rigorous peer review
7Immediate publication on acceptance
7 Open access: articles freely available online
7High visibility within the fi eld
7 Retaining the copyright to your article