CSEIT1722140 | Received : 22 March 2017 | Accepted: 31 March 2017 | March-April-2017 [(2)2: 524-531]
International Journal of Scientific Research in Computer Science, Engineering and Information Technology © 2017 IJSRCSEIT | Volume 2 | Issue 2 | ISSN : 2456-3307
524
Object Sorting Mechanism by Using Computer Vision
Harshavardhan Bharat Taktode , Prof. A. A. Bagade
Mechanical Engineering, DYPSOEA, Pune, Maharastra, India
ABSTRACT
Bearing and Gear are the main cause of a poor quality and difficulty to the manufacturer. Inspection process is done on these are mostly non-automatic and very time consuming. To reduce error on identifying bearing and gear defects requires more automatic and accurate inspection process. By considering these defects, the research improve a bearing and gear defect recognizer, which uses computer vision for the defect detection. The recognizer identifies the bearing and gear defects within economical cost. In this firstly, the camera capture the digital images by image acquisition device and converts the image to binary image by local threshold techniques. Later, the outputs of the processed image are the area of the faulty portion and compute the possible defective and non –defective bearing and gear as an output.
Keywords : Object Sorting Mechanism, Computer Vision, Quality Management, Digital Image Processing Techniques, Image Segmentation, Non Smooth Corner Detection
I.
INTRODUCTION
All steel industries aim to produce various competitive steel products. The competition enhancement depends mainly on productivity and quality of the steel produced by each industry. In this sector, there have been an enlarge amount of losses due to defective products. Most defects arising in the production process are still detected by human inspection. The work of inspectors is very tedious and time consuming. The identification rate is about 70%. In addition, the effectiveness of visual inspection decreases quickly with fatigue. Digital image processing techniques have been increasingly applied to steel bearing and gear samples for analysing the product.
As the technological progress is happening, the products are now extensively made using steel material, which needs to be ultra-light weight and modular in nature steel components like bearing, gears. As per industry statistics, we have found that bearing and gear are made up of steel material, which is prone to various kinds of defects when manufacturing using image processing. Therefore we suggest a fully robust system taking advantage of image processing techniques (Image segmentation, Non smooth corner
detection etc.) must be explored to build an economical solution to provide Total Quality Management in manufacturing units which would allow an eco-system of continuous monitoring and improvement there by reducing the cost.
improve the quality of images. Next, object inspection algorithm should process quickly the large volumes of image for real-time processing. Therefore, defect detection algorithm should satisfy two conflicting requirements of reducing the processing time and improving the efficiency of defect detection. To enhance performance of detection, edge preserving method is suggested for noise reduction of target image. Finally, experiment results show that the proposed algorithm guarantees the condition of the real-time processing and accuracy of detection.
S. Kamaruddin et.al paper presented a study in which an attempt has been made to improve the quality characteristic (shrinkage) of an injection moulding product (plastic tray) made from blends plastic (75% polypropylene (PP) and 25% low density polyethylene (LDPE)) by optimizing the injection moulding parameters using the Taguchi method. This paper had made an attempt to describe the optimization of the injection moulding process parameters for optimum shrinkage performance of a plastic tray which is made from polymer blends or polyblends.The performance of the plastic trays was evaluated in terms of its shrinkage behaviour. The analysis of the results shows that the optimal combinations for low shrinkage are low melting temperature, high injection pressure, low holding pressure, long holding time and long cooling time. Using Taguchi method for design of experiment (DOE), other significant effects such as interaction among injection moulding parameters are also investigated.
2. Model Presentation
The system design of bearing and gear defect recognizer, which mentioned into this paper, is illustrated in Fig. 1. The proposed system can be a competitive model for recognizing bearing and gear defects in real world. Base on the research, the
The second part calculates the number of bearing balls and gears and third part checks whether the bearing and gear defective or non-defective.
A. Processing Input Using Computer Vision Technique
(1) Ball counting algorithm of bearing
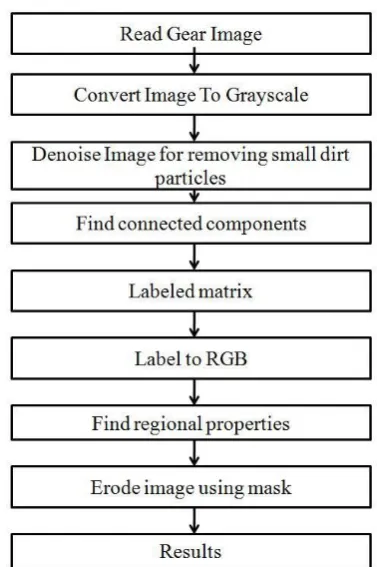
Figure 2 : Flow chart for Calculating balls of bearing
The steps for ball calculating algorithm of bearings are as follows:
The input image is read by using imread function. The algorithm can be tested for gray scale and a
colour image by appropriately using functions such as is gray function.
Denoise the bearing image for removing the small dirt particles.
Find the connected components of the bearing image .Pixels are connected if their edges touch. This means that a pair of adjoining pixels is part of the same object only if they are both on and are connected along the horizontal or vertical direction. Generate the labelled matrix.
Extract regional properties of the bearing image. Erode image.
Results.
(2) Teeth Counting Algorithm of Gear
Figure 3: Flow chart for Calculating teeth’s of gear
The steps for ball calculating algorithm of gears are as follows:
The input image is read by using imread function. The algorithm can be tested for gray scale and a
colour image by appropriately using functions such as is gray function.
Denoise the bearing image for removing the small dirt particles.
Denoise the bearing image for removing the small dirt particles.
Generate the labelled matrix.
Extract regional properties of the bearing image. Erode image.
Algorithm for purposed work
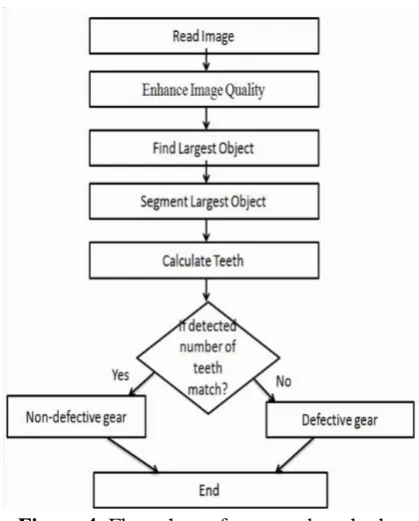
Figure 4: Flow chart of proposed method
The proposed algorithm is mentioned as follows:
The input image is read by using imread function. The algorithm can be tested for gray scale by
appropriately using functions.
Enhancement image quality by using the spatial filters which operate on pixel values.
Denoising -Noise is the result of errors in the image acquisition process that result in pixel values that do not reflect the true intensities of the real scene. Segment largest object i.e. gear image.
Calculate the labels i.e. number of tenths of gear. If the number of teeth match with the subscribe
number then the gear is non-defective, otherwise the gear is defected.
III.
RESULTS AND DISCUSSION
To see the qualitatively as well as quantitatively performance of the proposed algorithm, some experiments are conducted on several colored and gray scale images. The effectiveness of the approach has been justified using different images. The results are computed qualitatively (visually) as well as quantitatively using quality measures.
Results for Bearing:
which consist of original images and output bearing images.
This is the RGB image of the original bearing which is used as an output .
The bearing images have been converted into Black by using the complement code for increasing the visibility.
Figure 7: Binary Image
The above figure shows the binary image for increasing the visibility with respect to surface .
Figure 8:Circumference of Bearing
The above figure shows the step of the ball calculating algorithm where it identifies the outer as well as inner circumference of ball based on Ball counting algorithm.
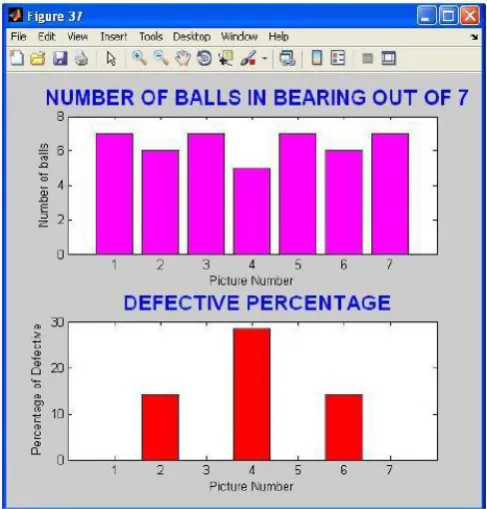
Figure 9: Count no of Balls
The above image counts the no of balls of the bearing image for checking whether the no of balls are the same as that of the subscribe number .If the number of ball matches with the subscribe number then the bearing is non-defective otherwise it is defected.
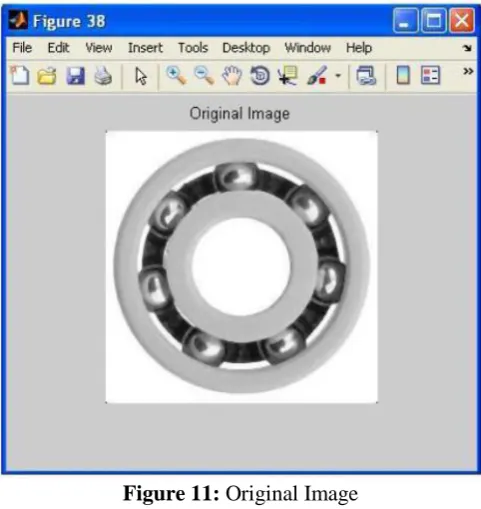
Figure 11: Original Image
This fig shows the RGB image of the original plastic bearing which is used to make industrial like robotics
Figure 12: Defected bearing
The above image basically shows the location of the defect after running the identifier algorithm based on thresholding.
Results for Gear:
The following figures are the screenshots of the proposed work, which shows the different images which consist of original images and output gear images.
Figure 13: Original gear image
This is the RGB image of the original plastic gear, which is used as an input.
Figure 14 : Segmentation process
Here the number of the gray values in the value was 255 which have been reduced to 35 with segmentation process.
Figure 15: Grey scale image
The gear images have been converted into black by using the complement code for increasing the visibility.
Figure 16: Binary image
Figure 17: RGB image
This is the colored image of a gear for Highlighting the gear part.
Figure 18: Input image
This is the binarized image of the gear passing through the Teeth counting algorithm.
Figure 19 : Circumference of Gear
The above image shows the step of a teeth calculating algorithm where it identify where it identify the outer
as well as inner circumference of teeth based on Teeth counting algorithm.
Figure 20: Count number of teeth’s
The above image count the number of teeth’s of the gear image for checking whether the number of teeth’s are same as that of the subscribe number. If the number of teeth matches with the subscribe number then the gear in nondefective otherwise it is defected.
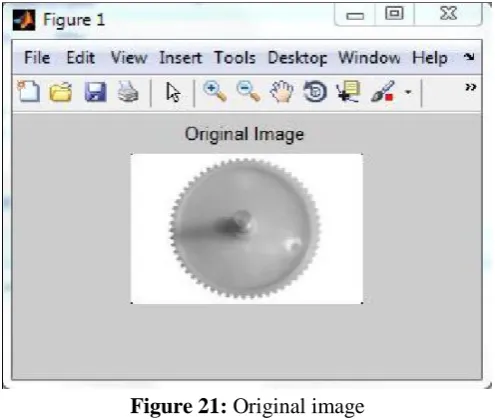
Figure 21: Original image
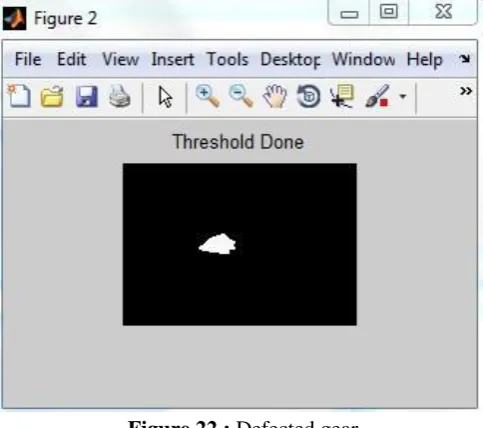
Figure 22 : Defected gear
The above image basically shows the location of the defect after running the defect identifier algorithm based on thresholding.
IV.CONCLUSION
Basically, in this paper we have been able to detect defective Bearings and Gears which have specific number of balls and teeths.If the number of balls and teeth’s are deformed or more or less than the subscribe number then the bearing and gear are defective in nature and therefore the bearings and gear are useless. Secondly, we have been able to identify some surface defects by using range bound thresholding which can work on both color and grey scale images of the bearing and gears. After conducting the above procedure for defect detection we suggest that in future we must take advantage of some machine learning algorithms for making defects detecting more reliable and robust.
V. FUTURE SCOPE
There are number of future possibilities for improving the performance of these detection algorithms like usage of machine algorithms, which help to identify the defective parts as these occur over a period of time. They increase their accuracy based on the updated parameter set and scenario machine algorithm like Support Vector Machine, K-NN and neural network can be used.
VI. ACKNOWLEDGEMENT
I would like to thanks my sweet Brother and my Parents for their support and trust.
VII.
REFERENCES
[1] Er. Manju Bala Goel , Er. Karamjeet Singh , Er.Pertik Garg - Fault Detection in Bearing Using Digital Image Processing –International Journal Of Engineering Research And Technology (IJERT), ISSN: 2278-0181 Vol 2.Issue 11 November 2013 [2] Amandeep Mavi, Mandeep Kaur,(2012) ―Identify
defects in Plastic (gears) using Digital image processing -A Review IRACST - International Journal of Computer Science and Information Technology & Security (IJCSITS), ISSN: 2249-9555 Vol. 2, No.2, April 2012
[3] S. Kamaruddin, Zahid A. Khan and S. H. Foong(2010) ― Application of Taguchi Method in the Optimization of Injection Moulding Parameters for Manufacturing Products from Plastic Blend ‖ IACSIT International Journal of Engineering and Technology, Vol.2, No.6, December 2010 ISSN: 1793-8236.
[4] Bernd Scholz-Reiter, Michael Lütjen, Hendrik Thamer, Dennis Dickmann, ―Towards Machine Vision based Surface Inspection of Micro-Parts‖, Recent Advances in Applied and Theoretical Mechanics, ISSN: 1790-2769 ISBN: 978-960-4741403.
[5] WANG Yansong, JIN Weiqi, and ZHONG