A new algorithm for the detection of seismic quiescence: introduction
of the RTM algorithm, a modified RTL algorithm
Toshiyasu Nagao1, Akihiro Takeuchi1, and Kenji Nakamura2
1Earthquake Prediction Research Center, Institute of Oceanic Research and Development, Tokai University, Shizuoka, Japan 2Graduate School of Marine Science and Technology, Tokai University, Shizuoka, Japan
(Received July 8, 2010; Revised December 16, 2010; Accepted December 19, 2010; Online published March 4, 2011)
There are a number of reports on seismic quiescence phenomena before large earthquakes. The RTL algorithm is a weighted coefficient statistical method that takes into account the magnitude, occurrence time, and place of earthquake when seismicity pattern changes before large earthquakes are being investigated. However, we consider the original RTL algorithm to be overweighted on distance. In this paper, we introduce a modified RTL algorithm, called the RTM algorithm, and apply it to three large earthquakes in Japan, namely, the Hyogo-ken Nanbu earthquake in 1995 (MJMA7.3), the Noto Hanto earthquake in 2007 (MJMA6.9), and the
Iwate-Miyagi Nairiku earthquake in 2008 (MJMA7.2), as test cases. Because this algorithm uses several parameters
to characterize the weighted coefficients, multiparameter sets have to be prepared for the tests. The results show that the RTM algorithm is more sensitive than the RTL algorithm to seismic quiescence phenomena. This paper represents the first step in a series of future analyses of seismic quiescence phenomena using the RTM algorithm. At this moment, whole surveyed parameters are empirically selected for use in the method. We have to consider the physical meaning of the “best fit” parameter, such as the relation ofCFS, among others, in future analyses. Key words:Seismicity, seismic quiescence, RTM, RTL, precursor.
1.
Introduction
Several methods are currently available to diagnose fu-ture seismic activity, including the Z-value (Wyss and Habermann, 1988) and ETAS (e.g., Ogata, 2006), or pre-dict major earthquakes, such as M8 (Keilis-Borok and Kossobokov, 1990), RTP (Shebalin et al., 2004), and Hotspot (Rundleet al., 2002). In addition, there are many reports of seismic activity decreasing prior to the occur-rence of major earthquakes in or around the focal region (e.g., Mogi, 1979; Wyss et al., 1981; Kisslinger, 1988; Wyss and Habermann, 1988; Wiemer and Wyss, 1994). This latter phenomenon, called seismic quiescence, is ex-pected to provide useful information for earthquake predic-tion. In many of the above reports the authors frequently claim that the seismic quiescence and activation occurred simultaneously. Matsumura (2005) has also modeled these phenomena as occurring simultaneously under redistribu-tion of the tectonic stress, resulting in a net quiescence.
To detect the occurrence of quiescence, Sobolev and Tyupkin (1997, 1999) proposed a weighted coefficient method called the RTL algorithm. The basic assumption of this method is that each prior event has some influence on the main event under investigation and that this influ-ence weight varies as described by the formulae below. The value ofRTL, which is supposed to represent the state of seismicity at the position(x,y,z)at timet, is the product
Copyright cThe Society of Geomagnetism and Earth, Planetary and Space Sci-ences (SGEPSS); The Seismological Society of Japan; The Volcanological Society of Japan; The Geodetic Society of Japan; The Japanese Society for Planetary Sci-ences; TERRAPUB.
whereri is the distance between the position and the ith
earthquake’s hypocenter, r0 is the characteristic distance, Rtr(x,y,z)is the trend ofR(x,y,z)in the calculation
pe-riod, ti is the occurrence time of the ith earthquake, t0
is the characteristic time-span, Ttr(x,y,z)is the trend of T(x,y,z) in the calculation period, li is the ith
earth-quake’s rupture dimension (= fault length) in kilometers obtained from the relation with theith earthquake’s mag-nitude Mi : logli = 0.5Mi −1.8 (Kasahara, 1981), and
Ltr(x,y,z)is the trend ofL(x,y,z)in the calculation
pe-riod. The integernis the number of earthquake events that satisfy the following criteria:
Mi ≥ Mmin, (4)
ri≤ Rmax=krr0, (5) t−ti ≤Tmax=ktt0, (6)
whereMminis the cut-off magnitude ensuring the
complete-ness of the earthquake catalog after declustering, and Rmax
andTmaxare the cut-off distance and time interval,
respec-tively. In the past, almost all studies adopted 2 forkr and
Fig. 1. Time variation of factorsL,FL, andMat the epicenter (135.04◦E, 34.59◦N) of the Hyogo-ken Nanbu Earthquake in 1995 (MJMA7.3) in southwest Japan. The arrow showed an abrupt shift of the factorLin April 1992. Thick, thin and dotted lines showM,LandFL, respectively.
kt. The three factors (R, T, and L) actually used are,
af-ter normalization by their standard deviations,σR,σT, and
σL, respectively. Therefore, the calculatedRTLvalue is in
the unit of the standard deviation (σ =σRσTσL). Detailed
mathematical and statistical descriptions of the RTL method are well documented in Huang (2006).
Positive values ofRTLindicate seismic activation, while negative values indicate quiescence. Huanget al. (2001) showed that the RTL value was approximately −7 to −10 at the epicenter of the Hyogo-ken Nanbu earthquake in 1995 (MJMA7.3, the so-called 1995 Kobe earthquake
about 6 months before the earthquake, where MJMA is the
earthquake magnitude defined by the Japan Meteorological Agency (JMA)). Huang and Nagao (2002) showed a clear spatial and temporal quiescence pattern at around the epi-center of the 2000 Tottori earthquake (MJMA7.3, Japan).
Huang (2008) recently applied the RTL algorithm to the 2008 Wenchuan earthquake (MS8.0, China). Wyss et al.
(2004) applied both the Z value and the RTL methods to two major earthquakes in Sakhalin and concluded that the two methods yield almost identical results, strongly sug-gesting that the observed precursory quiescence anomalies are robust and real.
As shown in Eqs. (1) and (3), ri is used to calculate
both R andL. This dual appearance ofri seems to be in
contradiction to the original concept of the RTL algorithm, i.e., the equi-importance of space and time. To remedy this situation, we have modified the RTL algorithm and apply this new algorithm (the RTM algorithm) to three Japanese earthquakes in Section 4.
Both the RTL and RTM algorithms contain a number of adjustable parameters, namely,T0,Tmax,R0,Rmax, and
oth-ers. In the past, the most suitable set of parameters was retrospectively chosen by a trial and error method. Seis-mic quiescence phenomena do not always result in a large earthquake. Sometimes nothing happens. Therefore, it is essential that seismologists screen out, as much as possible, false (artificial) quiescence. To this end, we perform a
mul-tiparameter survey test (more than ten parameter sets) with the aim of obtaining a good understanding of the nature of seismic quiescence phenomena.
2.
RTM Algorithm
The factorLof the RTL algorithm includesriin its
defi-nition (Eq. (3)). In this section, we try to explain the RTL al-gorithm and the advantages of the RTM alal-gorithm using the case of the Hyogo-ken Nanbu earthquake in 1995 in Japan (MJMA7.3). Figure 1 shows the time variation of L at the
epicenter (135.04◦E, 34.59◦N) of the main shock. Here,
L is normalized by its standard deviation σL. The JMA
earthquake catalog is used. The original data set (MJMA ≥
1.5) is declustered using the JMA’s standard program (H. Takayama, personal communication). This decluster pro-gram is classified as a link algorithm (e.g., Frohlich and Davis, 1990). Earthquakes that occurred within a certain epicentral distance within a certain day from a prior earth-quake are judged to be aftershocks of this earthearth-quake. The JMA has selected 3 km and 7 days in this algorithm (A. Yoshida, personal communication), and we adopt these val-ues in this study. We call this the “3 km/7 days” routine hereafter.
There is a strange shift ofLin April 1992, as shown by an arrow in Fig. 1. A careful survey of the used data reveal that an earthquake occurred very close to the epicenter of the main shock at that time. The very smallri in Eq. (3) quite
naturally makesli/ri andL very large. Here, note that the
completeness of the earthquake catalog is not considered in Fig. 1 because the aim of this figure is to show the effects on the factorL.
To avoid this effect, which is due to the dual appearance of ri, we introduce new factors FL (fault length) and M
Fig. 2. Time variations ofRTL(dotted line) andRTM(solid line) under the parameter set #15 at the epicenter (135.04◦E, 34.59◦N) of the 1995 Kobe Earthquake (MJMA7.3) in southwest Japan.
M(x,y,z,t)=
culation period,Mi is theith earthquake’s magnitude, and
Mtr(x,y,z)is the trend ofM(x,y,z)in the calculation
pe-riod. These factors do not includeri. Figure 1 also shows
the time variations ofFLandM. Here,FLandM are nor-malized by their standard deviation (σFLandσM). They do
not show any abrupt shift in their values. Since the degree of accuracy ofMandFLare basically the same, in this paper, we adopt the dimensionlessMas a new factor.
The new indicatorRTMis defined as the product of three dimensionless factors, namely, R, T, and M. We rec-ognize seismic quiescence when theRTM (andRTL) val-ues are ≤−8 (darker shading in all Tables). This num-ber (−8) comes from the product of−2 sigma anomalies in the three factors (R,T, and M). We recognize seismic quasi-quiescence when theRTM(andRTL) values are≤−6 (lighter shading in Tables 2 and 3).
3.
Completeness Check of the Seismic Catalog
It is important to check the completeness of earthquake catalogs before evaluating the seismic activity. Hi-net, which is the new dense seismic station network in Japan (e.g. Obara 2003) established after the 1995 Kobe Earth-quake, has made the detectability of inland earthquakes in Japan very high. The way of confirmation of the com-pleteness itself has been an interesting study, and various ways have been proposed. One of the most sophisticated methods is a probability-based magnitude of completeness (PMC) method (e.g., Nanjoet al., 2010a). However, com-pared with Gutenberg-Richter (G-R) based methods (e.g., Woessner and Wiemer, 2005), applying the PMC method is
more difficult because it requires detailed knowledge about the network and its setup etc.
In this study, we evaluate Mc, the lower limit of
mag-nitude for the catalog completeness, from the Gutenberg-Richter plots of the initial 1-year data in the calculation period. As a result, we found Mc = 2.5 for the 1995
Kobe Earthquake when we used the catalog after 1987 (see figure 2 of Huanget al., 2001). In contrast, Huang
et al. (2001) determined Mc = 3.0 because they started
the calculation in 1978. For other two earthquakes (the Noto Hanto Earthquake in 2007 (MJMA6.9) and the
Iwate-Miyagi Nairiku Earthquake in 2008 (MJMA7.2)), we found Mc=1.5.
4.
Parameter Survey
The RTL and RTM algorithms have a number of ad-justable parameters. The most suitable set of parameters is chosen retrospectively through an extensive parameter sur-vey. In this section, we show how the RTL and RTM algo-rithms work by using the examples of their application to three major earthquakes in Japan.
The devastating 1995 Kobe earthquake (MJMA7.3)
oc-curred in southwest Japan on January 17, 1995. As already mentioned, Huang et al. (2001) showed the existence of seismic quiescence before this earthquake by the original RTL algorithm. To verify the effectiveness of the new RTM algorithm, we applied it to this earthquake as an example.
Table 1. Results of parameter survey in RTL and RTM algorithms at the epicenter of the 1995 Kobe Earthquake (MJMA7.3).
Fig. 3. Spatial distributions of the seismic quiescence in the RTL and RTM algorisms before the 1995 Kobe Earthquake. Figures represent the most quiescent period at the end of September, 1994 (about 3.5 months before the main shock). Stars show the epicenter.
a minimum withinTmax(see Eq. (6)) from the occurrence
time. The variations are similar forRTLandRTM, but the abnormal decreases are more conspicuous forRTMthan for
RTL. Table 1 shows the minimumRTLandRTMvalues for
various parameter sets. Based on these data, clear quies-cence (4 cases; shaded column) appears only for largeMmin
Table 2. Results of parameter survey in RTL and RTM algorithms at the epicenter of the Noto Hanto Earthquake in 2007 (MJMA6.9).
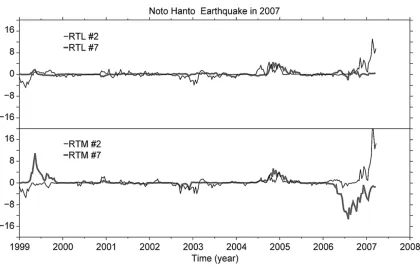
Fig. 4. Time variations of theRTLandRTMunder the parameter sets #2 and #7 at the epicenter (136.69◦E, 37.22◦N) of the Noto Hanto Earthquake in 2007 in central Japan. Upper and lower panels represent the time variation of theRTLandRTMvalues. Thin and thick lines indicate #2 and #7, respectively.
in operation. (Actually, the construction of Hi-net was mo-tivated by this earthquake.) As demonstrated by the shaded values, the RTM algorithm seems to reveal seismic quies-cence more sensitively than the RTL algorithm. Figure 3
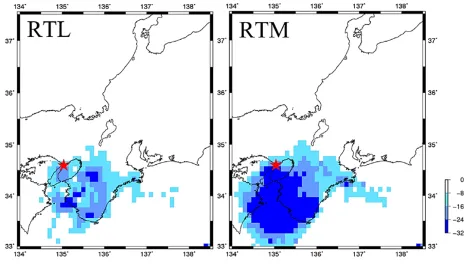
quies-Fig. 5. The seismic quiescence map around the epicenter of the Noto Hanto Earthquake in 2007 (MJMA6.9) in central Japan when the epicenter takes the minimumRTMvalue under the parameter set #7 in Table 2 (July, 2006). Star shows the epicenter.
Table 3. Results of parameter survey in RTL and RTM algorithms at the epicenter of the Iwate-Miyagi Nairiku Earthquake in 2008 (MJMA7.2).
Fig. 7. Time variation ofRTLandRTMunder the parameter sets #2 and #7 at the epicenter (140.88◦E, 39.03◦N) of the Iwate-Miyagi Nairiku Earthquake in 2008 (M7.2) in northeast Japan. Upper and lower panels represent the time variation of theRTLandRTMvalues. Thin and thick lines indicate #2 and #7, respectively.
cence area. Huanget al.(2001) obtained a similar RTL map from the earthquake catalog withMc=3.0.
The Noto Hanto Earthquake in 2007 (MJMA6.9) occurred
off the coast of Noto peninsula in central Japan on March
Fig. 8. The seismic quiescence map around the epicenter of the Iwate-Miyagi Nairiku Earthquake in 2008 (MJMA7.2) in northeast Japan when the epicenter takes the minimumRTMvalue under the parameter set #7 in Table 3 (July, 2007). The star shows the epicenter.
in four parameter sets (darker shading) and seismic quasi-quiescence in two parameter sets (lighter shading); in con-trast, the RTL algorithm indicates no quiescence. Figure 4 shows examples of the time variation of theRTLandRTM
in parameter sets #7 and #2 of Table 2 at the epicenter (136.69◦E, 37.22◦N). The calculation was made in the pe-riod from January 1, 1999 to 1 day before the earthquake occurrence.
Parameter set #2 is representative of ones with the smallerRmaxandTmaxranges, while parameter set #7 is the
most widely used one in early studies with the RTL algo-rithm (e.g., Huanget al., 2001; Huang and Nagao, 2002). In Fig. 4, the RTM algorithm together with parameter set #7 detects the seismic quiescence before the main shock (the best set), while the RTL algorithm does not show such an anomaly. In addition, both the RTL and RTM algorithms with parameter set #2 detect seismic activation before the main shock. This result means that local activation is of-ten reported when there is actually local activation and qui-escence simultaneously (e.g., Wyss and Habermann, 1988; Chenet al., 2005; Matsumura, 2005). Figure 5 shows the quiescence map around the epicenter as of July, 2006, about 8 months prior to the earthquake. This map is obtained from the RTM algorithm applied at each 0.1◦ grid in parameter set #7 in Table 2.
The Iwate-Miyagi Nairiku earthquake in 2008
(MJMA7.2) occurred in northeast Japan on June 14,
2008. There is a clear seismic activity boundary, called an
aseismic front (Yoshii, 1979), lying east of the epicenter, as shown by the thick line in Fig. 6. The seismic activity east of this boundary is due directly to the subduction of
the Pacific plate and is much higher than that of the west region (e.g., Tsuji et al., 2008). The crustal seismicity on the inland side area, in which we are interested, is quite different from that of the subduction-related area. Therefore, we selected earthquakes only in the region west of the aseismic front, as shown in Fig. 6. The reason for this selection is as follows: when theri range (and Rmax)
reaches the high seismic activity region in the east from the lower seismicity region of our interest, a relatively small change of activity in the eastern region leads to a large change on the statistics in the western region. Figure 7 shows examples of the time variation in theRTLandRTM
in parameter sets #2 (the best set) and #7 of Table 3 at the epicenter (140.88◦E, 39.03◦N). The calculation was made in the period from January 1, 2000 to 1 day before the occurrence of the earthquake. Figure 8 shows the quiescence map around the epicenter as of July, 2007, about 1 year before the earthquake. For this earthquake, in parameter set #7, both the RTL and RTM algorithms show that the seismic quiescence stage gradually progresses until the main shock. In conclusion, the RTM algorithm clearly indicates a stronger seismic quiescence before the earthquake. While the RTL algorithm indicates only seismic quasi-quiescence in two parameter sets, the RTM algorithm indicates seismic quiescence in six parameter sets and seismic quasi-quiescence in one parameter set.
5.
Comparison with Other Methods Used for
Seis-micity Diagnosis
respec-tive advantages and disadvantages.
To the best of the authors’ knowledge, there is no pub-lished report on seismic quiescence phenomena before the Noto Hanto Earthquake in 2007. We have now demon-strated that the RTM algorithm is able successfully detect such phenomena.
Using the CFS (Coulomb failure stress) calculation, Kumazawaet al.(2010) reported seismic quiescence phe-nomena preceding the Iwate-Miyagi Nairiku earthquake in 2008 in the regions of the stress shadow area. However, as this algorithm needs data on the focal mechanism of the main shock, it is impossible to obtain the results prior to the occurrence of the main shock. In comparison, the RTL/RTM algorithms are very simple and do not need in-formation on focal mechanism. We believe that this is an advantage of the RTL/RTM algorithms.
The Z-value is one of the well-known methods to eval-uate the seismicity, especially seismic quiescence phenom-ena. This algorithm treats the deviation from the mean seis-micity, therefore the values change smoothly. In contrast, the RTL/RTM algorithms treat the product of three factors that are normalized by the background trend, which means that the RTL/RTM values are zero at the usual time. There-fore, the changes in these values tend to be clearly visible when something unusual happens.
The M8 algorithm treats multiparameters (e.g., the ab-solute seismicity, its deviation, and the spatial concentra-tion of hypocenters, etc.) and routinely cauconcentra-tions “Times of Increased Probability of Strong Earthquakes (TIP)” when some of the parameters exceed their threshold levels. This algorithm focuses not only seismic quiescence phenomena. In this algorithm, if an expected earthquake occurs within 5 years, this caution is judged to be true. However, the pe-riod (5 year) is longer than that in the RTL/RTM algorithms (Tmax).
6.
Discussion and Conclusions
For the 1995 Kobe earthquake, the seismic quiescence does not appear when Mmin ≤ Mc = 2.0 (Table 1). This
absence means that the completeness in the earthquake cat-alog is really important for this kind of analysis.
The best parameter set is different among the three earth-quakes. In the case of the 1995 Kobe earthquake (Table 1), parameter sets with the longer Tmax and the larger Mmin
seem to be better. On the other hand, in the case of the Iwate-Miyagi Nairiku earthquake (Table 3), those param-eter sets with the shorter Tmax and the smaller Mmin seem
to be better. This difference is based on a number of com-plicated factors, such as the seismic event frequency, the degree of declustering, among others.
It is widely known that not all quiescence is followed by the activation of seismicity. We should evaluate the re-sults obtained through multiparameter sets rather than rely on one parameter set as this would help avoid any accep-tance of false seismic quiescence. For the three earthquakes in this study, one distinct quiescence and one major earth-quake appeared during the calculation period. Further study may clarify whether or not the RTM algorithm can con-tribute to the development of this aspect. One possible ap-proach to use when the aim is to clarify the statistical
sig-nificance of the results would be apply calculations using many synthetic catalogs (e.g., Sobolevet al., 2002). How-ever, we have not made this kind of statistical check since the main aim of this paper is to introduce the RTM algo-rithm.
Based on the results of the test applications described above, we consider that the RTM algorithm is preferable to the RTL logarithm for identifying seismic quiescence. Although it is essentially important to check the complete-ness of the seismic catalog (e.g., Nanjoet al., 2010a, b) as mentioned above, the present earthquake catalog in Japan is sufficiently complete to be used for seismicity analysis due to the Hi-net, the new dense seismic station network. However, for a full justification of the present conclusion, further detailed investigations on such issues as the reason-ability of the proposed parameter sets and the declustering process are needed.
At this moment, whole surveyed parameters are empir-ically selected. Therefore, we have to consider the physi-cal meaning of the “best fit” parameter, e.g., the relation to
CFS (e.g., Scholz, 1990), among others, in the future. For instance, the RTL and RTM algorithms use an exponential decay in the factors R andT. Theoretically, seismicity is governed by the re-distribution of tectonic stress. There-fore, the factor Rmay be as a function of 1/r3. This area definitely needs further investigation.
In retrospective studies, we “know” the hypocenter and magnitude of “impending” earthquakes. Consequently, we can perform multiparameter surveys around the known lo-cation and magnitude. What can we do in a preseismic stage when none of this information is known? We would like to propose a study in which RTM calculations are rou-tinely made at every grid-point of a region in order to draw a seismic quiescence map, such as those in Figs. 5 and 8, in a multiparameter survey. Computer capability will allow such a study any time now or in the near future. The experi-ence gained in such a study may lead to a narrowing down of the ranges of parameters and, ultimately, even regional progressive diagnosis of seismic quiescence will be realized in a not so distant future. The authors consider this paper to be the first step in future analyses of seismic quiescence phenomena along the line of the RTL algorithm proposed by Gennady Sobolev in 1997.
Acknowledgments. The earthquake catalog used in this study is from JMA. We would like to thank H. Takayama of JMA for providing a declustering program. We would like to thank also A. Yoshida of JMA for his advice on decluster parameters. Our thanks are extended to S. Uyeda, Q. Huang, G. A. Sobolev, H. Katao, and K. Nanjo who gave us valuable comments and suggestions to improve the manuscript. This research was partially supported by Observation and Research Program for Prediction of Earthquakes and Volcanic Eruptions, the Ministry of Education, Culture, Sports, Science and Technology (MEXT) of Japan.
References
Chen, C.-C., J. B. Rundle, J. R. Holliday, K. Z. Nanjo, D. L. Turcotte, S.-C. Li, and K. F. Tiampo, The 1999 Chi-Chi, Taiwan, earthquake as a typical example of seismic activation and quiescence,Geophys. Res. Lett.,32(22), L22315, doi:10.1029/2005GL023991, 2005.
Frohlich, C. and S. D. Davis, Single-link cluster analysis as a method to evaluate spatial and temporal properties of earthquake catalogues,
Huang, Q., Search for reliable precursors: A case study of the seismic qui-escence of the 2000 western Tottori prefecture earthquake,J. Geophys. Res.,111, B04301, doi: 10.1029/2005JB003982, 2006.
Huang, Q., Seismicity changes prior to the Ms8.0 Wenchuan earth-quake in Sichan, China,Geophys. Res. Lett.,35, L23308, doi:10.1029/ 2008GL036270, 2008.
Huang, Q. and T. Nagao, Seismic quiescence before the 2000 M=7.3 Tottori earthquake, Geophys. Res. Lett.,29(12), doi:10.1029/ 2001GL013835, 2002.
Huang, Q., G. A. Sobolev, and T. Nagao, Characteristics of the seismic quiescence and activation patterns before the M=7.2 Kobe earthquake, January 17, 1995,Tectonophysics,337, 99–116, 2001.
Kasahara, K., Earthquake Mechanics, Cambridge Univ. Press., Cam-bridge, 248 pp, 1981.
Keilis-Borok, V. I. and V. G. Kossobokov, Premonitory activation of earthquake flow: Algorithm M8,Phys. Earth Planet. Inter.,61, 73–83, doi:10.1016/0031-9201(90)90096-G, 1990.
Kisslinger, C., An experiment in earthquake prediction and the 7 May 1986 Andreanof Islands earthquake,Bull. Seismol. Soc. Am.,78, 218–229, 1988.
Kumazawa, T., Y. Ogawa, and S. Toda, Precursory seismic anomalies and transient crustal deformation prior to the 2008 Mw = 6.9 Iwate-Miyagi Nairiku, Japan, earthquake, J. Geophys. Res.,115, B10312, doi:10.1029/2010JB007567, 2010.
Matsumura, S., Why does the precursory change of seismicity rate tend to be quiescence?,Zisin,57, 441–444, 2005 (in Japanese with English Abstract).
Mogi, K., Two kinds of seismic gap,Pure Appl. Geophys,117, 1172–1186, 1979.
Nanjo, K. Z., D. Schorlemmer, J. Woessner, S. Wiemer, and D. Giardini, Earthquake detection capability of the Swiss Seismic Network, Geophys. J. Int., 181(3), 1713–1724, doi:10.1111/j.1365-246X.2010.04593.x, 2010a.
Nanjo, K. Z., T. Ishibe, H. Tsuruoka, D. Schorlemmer, Y. Ishigaki, and N. Hirata, Analysis of the completeness magnitude and seismic net-work coverage of Japan,Bull. Seismol. Soc. Am.,100(6), 3261–3268, doi:10.1785/0120100077, 2010b.
Obara, K., Hi-net: High sensitivity seismograph network, Japan,Lect. Notes Earth Sci.,93, 79–88, doi:10.1007/BFb0117693, 2003. Ogata, Y., Monitoring of anomaly in the aftershock sequence of the
2005 earthquake of M7.0 off coast of the western Fukuoka, Japan, by the ETAS model, Geophys. Res. Lett., 33(1), L01303, doi:10. 1029/2005GL024405, 2006.
Rundle, J. B., K. F. Tiampo, W. Klein, and J. S. Sa Martins. Self-organization in leaky threshold systems: The influence of near-mean field dynamics and its implications for earthquakes, neurobiology, and forecasting,Proc. Natl. Acad. Sci. USA.,99, suppl. 1, 2514–2521, 2002. Scholz, C. H.,The Mechanisms of Earthquakes and Faulting, Cambridge
University Press, 439 pp., 1990.
Shebalin, P., V. Keilis-Borok, I. Zaliapin, S. Uyeda, T. Nagao, and N. Tsybin, Advance short-term prediction of the large Tokachi-oki earth-quake, September 25, 2003, M=8.1 A case history,Earth Planets Space, 56, 715–724, 2004.
Sobolev, G. A. and Y. S. Tyupkin, Low-seismicity precursors of large earthquakes in Kamchatka,Volcanol. Seismol.,18, 433–446, 1997. Sobolev, G. A. and Y. S. Tyupkin, Precursory phases, seismicity
precur-sors, and earthquake prediction in Kamchatka,Volcanol. Seismol.,20, 615–627, 1999.
Sobolev, G., Q. Huang, and T. Nagao, Phases of earthquake’s preparation and by chance test of seismic quiescence anomaly,J. Geodyn.,33, 425– 432, 2002.
Tsuji, Y., J. Nakajima, and A. Hasegawa, Tomographic evidence for hy-drated oceanic crust of the Pacific slab beneath northeastern Japan: Im-plications for water transportation in subduction zones,Geophys. Res. Lett.,35, L14308, doi:10.1029/2008GL034461, 2008.
Wiemer, S. and M. Wyss, Seismic quiescence before the Landers (M=7.5) and Big Bear (M=6.5) 1992 earthquakes,Bull. Seismol. Soc. Am.,84, 900–916, 1994.
Woessner, J. and S. Wiemer, Assessing the quality of earthquake cata-logues: Estimating the magnitude of completeness and its uncertainty,
Bull. Seismol. Soc. Am., 95(2), 684–698, doi:10.1785/0120040007, 2005.
Wyss, M. and R. E. Habermann, Precursory Seismic quiescence,Pure Appl. Geophys.,126, 319–332, 1988.
Wyss, M., F. W. Klein, and A. C. Johnston, Precursor ot the Kalapana M=7.2 earthquake,J. Geophys. Res.,86, 3881–3900, 1981.
Wyss, M., G. Sobolev, and J. D. Clippard, Seismic quiescence precursors to two M7 earthquakes on Sakhalin Island, measured by two methods,
Earth Planets Space,56, 725–740, 2004.
Yoshii, T., A detailed cross-section of the deep seismic zone beneath north-eastern Honshu, Japan,Tectonophysics,55, 349–360, 1979.