The foliage effect on the height time series from permanent GPS stations
Kwan-Dong Park and Jihye Won
Department of Geoinformatic Engineering, Inha University, 253 Yonghyun-dong, Nam-gu, Incheon, 402-751, South Korea
(Received July 20, 2008; Revised August 27, 2010; Accepted October 25, 2010; Online published January 26, 2011)
The effect of deciduous trees growing above antenna height on data collected by permanent Global Positioning System (GPS) stations was investigated. Signal blockage due to foliage and branches was found to have the same effect as an increased elevation cutoff angle, i.e., there was a change in the computed position. Height estimates were affected the most, showing a decrease with tree growth. Empirical Orthogonal Function (EOF) analysis on the height-time series from five test sites and two stations surrounded by trees showed a similar EOF mode of signal. Signal availability, computed as the ratio of the complete to possible set of observations, decreased with increasing tree growth and showed seasonal variation, with the observation ratios being higher during the winter months when the leaves had fallen. A similar seasonal variation was observed in multipath error and signal attenuation due to foliage. The multipath error index MP2 was computed using the TEQC program and found to increase at a significant rate at sites with growing trees. Signal attenuation was analyzed using 1-σ uncertainties from the estimation process of daily GPS data processing. While 1-σ uncertainties did not show any seasonal variations at sites without trees, they were highly dependent on conditions related to the seasonal change of foliage when deciduous trees were near the antenna.
Key words:GPS, multipath, foliage effect, signal attenuation.
1.
Introduction
About 90 permanent Global Positioning System (GPS) stations were operational in South Korea as of July, 2008. These sites are used for various GPS applications, such as real-time navigation, precise surveying, geodesy, and Earth science studies. Since the average operation period of those stations is about 8 years, the site velocities derived from the continuous GPS measurements are an indispensible geode-tic tool for crustal deformation studies of the Korean penin-sula and the surrounding area (Hamdyet al., 2005; Jin and Park, 2006). For example, Jin and Park (2006) processed 4 years of data and computed the horizontal velocities of 45 GPS sites in South Korea and found that the GPS-derived seismic moment accumulation rate is significant and con-sistent with recent historic earthquakes and fault zones in South Korea. However, truly three-dimensional (3-D) tec-tonic studies of the Korean peninsula deformation based on GPS measurements have not yet been conducted.
As a preliminary step for the vertical displacement anal-ysis of the Korean peninsula, we selected 53 GPS stations in Korea and processed 7 years of continuous data. Based on this analysis, we determined that the average uplift rate of the 53 sites is 2 mm/year (Park, 2007). However, two of the sites, INCH and PAJU, located in Incheon and Paju, respectively, in the northwestern part of South Korea show a relatively low vertical velocity, with a rate of almost zero, which is 2–3 mm/year lower than that of nearby sites. As the inter-site distances are at the most several tens of
kilo-Copyright cThe Society of Geomagnetism and Earth, Planetary and Space Sci-ences (SGEPSS); The Seismological Society of Japan; The Volcanological Society of Japan; The Geodetic Society of Japan; The Japanese Society for Planetary Sci-ences; TERRAPUB.
doi:10.5047/eps.2010.10.005
meters, the abnormal rates of vertical velocity at INCH and PAJU must be due to local effects. A visit to the two sites to check the site-specific environments revealed the presence of trees growing nearby that were 2–6 m higher than the antennas. This led to the suspicion that the trees growing above the GPS antenna may be the reason for the appar-ently low uplift rates.
The availability and attenuation of GPS signals due to foliage depends on various parameters, such as tree height, type of tree, thickness of leaves, density of trees, distance from the antenna to the tree, canopy shape, and tree base (Lachapelleet al., 1994; Spilker, 1996). Lachapelleet al.
(1994) investigated the seasonal effect of deciduous tree fo-liage on GPS signal availability and accuracy for vehicular navigation and found that the range availability was supe-rior on the test date psupe-rior to foliage growth. Spilker (1996) characterized foliage attenuation as attenuation in dB/m of foliage penetration for stationary and mobile users. Koh and Sarabandi (2002) investigated the attenuation, depolar-ization, and fluctuation of a microwave signal going through a tree canopy, developing a Monte Carlo coherent scattering model. This model is considered to be particularly effective for analyzing the performance of GPS receivers under tree canopies.
In the study reported here, we performed an in-depth analysis on the signal availability and accuracy deteriora-tion due to foliage and its effect on posideteriora-tion estimates. We focused on permanent GPS stations. First, the height-time series of five permanent GPS sites close to each other were compared and the common-mode signal characteristics ana-lyzed. The effect of foliage on the GPS coordinate estimates was then analyzed, with a special focus on the vertical
Table 1. The locations and GPS equipment of the five GPS stations analyzed in Fig. 1.
Site Location GPS equipment
Latitude (◦N) Longitude (◦E) Receiver Antenna
ICNW 37.4520 126.5921 Ashtech iCGRS ASH701945E M
INCH 37.4199 126.6864 Trimble 4000SSi TRM33429.00+GP
PAJU 37.7464 126.7379 Trimble 4000SSi TRM33429.00+GP
SEOS 36.7764 126.4942 Trimble NetRS TRM29659.00
SUWN 37.2755 127.0542 Trimble NetRS TRM29659.00
ponent, by trying 25 different values of elevation cutoff an-gle to simulate the various conditions of signal blockage by trees. We used the multipath indices computed by the TEQC program to confirm that signal attenuation and the multipath error are induced by the foliage and branches. Fi-nally, the seasonal variation of 1-σ errors was compared among sites with different foliage conditions.
2.
The GPS Height-Time Series Analysis
Among the 53 permanent GPS sites analyzed by Park (2007), two sites, namely, ICNW and PAJU, both near the Seoul metropolitan area, showed abnormally low rates of crustal uplift. This was especially evident for the INCH station, which showed the lowest vertical velocity of all the 53 sites. The initial suspicion was that INCH may actually be subsiding because part of the Incheon area is reclaimed land. Therefore, in our study, we included a second site (ICNW) in the Incheon area as a control to check if subsidence is actually occurring in this region. The ICNW station, which is within 10 km of INCH, is the first permanent GPS site in Korea to be installed right at the tide gauge site so as to be able to monitor the crustal deformation of the tide gauge station. Two additional sites, SUWN and SEOS, were also included in this analysis. The site locations of the GPS stations and the types of GPS receiver and antenna at each station are listed in Table 1.
Of the five sites included in our regional analysis, four stations (excepting ICNW) have been in operation since at least May 2000; ICWN was installed in September 2005. Thus, for an objective comparison, we only processed data from September 2005 through to January 2008. GIPSY-OASIS software (GPS Inferred Positioning System-Orbit Analysis and Simulation Software), developed by the Jet Propulsion Laboratory (JPL), was used to process the GPS data. In particular, the precise point positioning strategy (Zumbergeet al., 1997) was used with earth orientation pa-rameters and GPS satellite orbit and clock solutions pro-vided by JPL. These JPL products are non-fiducial ones (Heflin et al., 1992), and the orbit and clock information are sampled at 300-s intervals. After data processing, we used transformation files (referred to as x-files) to align the site position to the IGS05 frame.
Antenna phase center variations, ocean tidal loading dis-placements, and atmospheric loading effects were corrected as standard procedures of high-precision GIPSY-OASIS data processing. Relative calibration tables published by the National Geodetic Survey of the USA were used in order to consider antenna phase center variations in terms of ele-vation angles (Mader, 1999). The ocean tidal loading
Fig. 1. The height-time series of five GPS stations in the northwestern part of South Korea from September 2005 through to January 2008.
placements were also corrected for on an epoch-by-epoch basis by utilizing 11 major constituents from NAO.99b model (Matsumoto et al., 2000). The atmospheric load-ing effects at 6-h intervals were computed usload-ing the APLO program (Petrov and Boy, 2004), and the daily average dis-placement was derived from these atmospheric loading ef-fects. The daily GPS height-time series was then corrected using the daily atmospheric loading values.
Fig. 2. The inter-site distances and uplift velocities of five GPS stations. The shortest inter-site distance is between ICNW and INCH (9.1 km), and the longest is between PAJU and SEOS (109.8 km).
SEOS). Given the short distance between INCH and ICNW, the velocity difference of approximately 8 mm/year is un-usual. Similar patterns in the time series of a regional net-work have been observed in previous geodesy studies; the repeatability of the time series was reduced by modeling and removing common-mode signals (Wdowinski et al., 1997; Donget al., 2006). Similar trends can be observed in Fig. 1. For example, the dips in early 2006 occur at all sites, and thereafter height estimates rebound by almost the same amount. Even a quick visual inspection reveals that certain common-mode signals exist in the time series and that INCH and PAJU are subsiding with similar patterns.
For a more quantitative analysis, we performed an Empirical Orthogonal Function (EOF) analysis on the times series of Fig. 1. EOF analysis is a powerful tool that is used to assess the degree of correlation among times series of the same physical phenomenon recorded at different places (Eloseguiet al., 1997). It has been successfully used in the areas of GPS geodesy, such as GPS coordinate time series and precipitable water vapor studies (Davis and Elgered, 1998; Aoki and Scholz, 2003). Because EOF analysis does not allow for data gaps, the missing points in Fig. 1 were interpolated by cubic splines (Aoki and Scholz, 2003).
Figure 3 shows the first two primary modes and the corre-sponding eigenvectors. The eigenvectors of the first mode
at each site have similar magnitudes (about−0.5) and di-rection. The linear velocity of the first mode signal is
−8.8 mm/year, and this velocity translates into approxi-mately 4.5 mm/year when it is multiplied by the magnitude
−0.5. From the analysis of the first mode, it can be deduced that there is an uplift velocity of approximately 4.5 mm/year at INCH and PAJU, even though the two sites subside when all modes are combined. The linear velocity of the sec-ond mode signal is 9.9 mm/year; the eigenvectors of INCH and PAJU have similar characteristics, but the eigenvectors of the other three sites have different directions and mag-nitude. The magnitude of the second mode eigenvector is
−0.7 for INCH and −0.5 for PAJU. From this series of analysis, we were able to conclude that the lower vertical velocities observed at INCH and PAJU are indeed unique and that they must have been caused by factors in the local environment.
The next step involved visiting the five sites and check-ing the site environment for any possible problem in mon-ument stability. The GPS antennas at INCH, PAJU, and SEOS are installed at the top of 4-m-high stainless pillars, but both the monument and mount of these stations were found to be stable. SUWN and ICNW also have sturdy mounts and monument structures. The sky visibility at ICNW and SEOS is excellent, with signal reception above the 5◦elevation angle secured in all directions. SUWN, an International GNSS Service (IGS) site, is situated just east (50 m) of a small forest, but the treetops are not much higher than the antenna. Therefore, we concluded that these three sites (SUWN, ICNW, and SEOS) meet IGS Site Guidelines (Dowet al., 2005); in contrast, a number of problems were evident at sites INCH and PAJU.
INCH is surrounded by seven or eight trees in most di-rections, and the treetops are about 2–4 m higher than the antenna (Fig. 4). The trees consist of two types of decidu-ous trees: Prunus yedoensis and Chinese pagoda trees. The distances to the tree trunks range vary from 4 to 6 m, but the antenna is only 2–4 m away from the nearest branches and foliage. At PAJU, vines and a small number of Black locust trees, about 6.5 m in height, grow just south of the station, at a distance of 4 m, although the nearest leaves are only approximately 3 m from the antenna (Fig. 4). Two Metase-quoia trees, between 8 and 10 m high, are located 10 m to the east of the station. There is also a 5.2-m-high Black locus tree right next to the antenna to the west. Visual in-spection suggested that the tree branches and thick foliage at INCH and PAJU would be likely to prevent the GPS sig-nal from reaching the antenna located below the treetops in some low elevation angles. Sky visibility is better at PAJU because the tree density is not as high as at INCH. The ef-fect of signal blockage can be investigated by taking differ-ent elevation cutoff angles in the GPS data processing. The elevation cutoff angle test results and the signal availability analysis are described in the following section.
3.
Signal Availability due to Foliage
an-Fig. 3. The first two primary modes of the Empirical Orthogonal Function analysis of the height time series of an-Fig. 1.
Fig. 4. The site pictures of INCH (upper) and PAJU (lower).
tenna being unable to receive the signal. Signal attenuation occurs when (1) the GPS signal goes through thin foliage and reaches the antenna; (2) the signal reflects or bounces off the foliage. The latter case of signal attenuation can be considered as multipath error. In this section, we introduce signal availability analysis. Signal attenuation, due to fo-liage, is investigated in the next section.
The relation between the height estimates and the ele-vation cutoff angle was modeled by processing 10 days of GPS data with 25 different values of elevation cutoff angle.
The station used for this study, JINJ, is located in south-ern Korea. JINJ has one of the best sky visibilities among permanent GPS sites in Korea—there are no buildings or trees within 100 m. The daily files from 1 to 10 January 2008 were processed and the elevation cutoff angles
incre-mented by 1◦from 5◦to 30◦for each day. Figure 5 displays
the experimental results, with the horizontal axis denoting the elevation cutoff angle and the vertical axis denoting the height difference (in cm) from the height estimate obtained
with a 5◦elevation cutoff angle. On DOYs 006 and 010, the
height estimates differ as much as 10 cm between 5◦ and
30◦. Abrupt height changes were observed in the range of
20–30◦. The averages and standard deviations of the 10-day
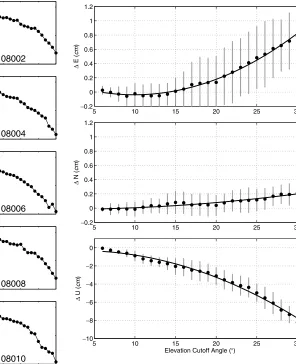
variations were computed for each angle and are depicted in Fig. 6, which also shows the horizontal (north and east) components. Variations in the north and east components
are<1 cm in all cases, with the north component being at
most 0.3 cm. Height differences are up to 8–9 cm.
The second-degree polynomial function, as a function of elevation cutoff angle, was fitted in weighted least-squares to the coordinate differences; this is given as a solid line in Fig. 6. In the case of the vertical coordinate, the fitted
function wasU = −0.4055+0.0630εco−0.0103εco2.
In this equation, U is the height difference in
centime-ters, andεco is the elevation cutoff angle in degrees. This
function was used to determine the height changes at 5◦
in-tervals. The calculated changes were−0.8 cm from 5◦ to
10◦,−1.0 cm from 10◦ to 15◦,−1.5 cm from 15◦to 20◦,
−2.0 cm from 20◦ to 25◦, and−2.5 cm from 25◦ to 30◦.
This result led us to conclude that the decreasing rate in the estimated heights grows rather rapidly with increasing ele-vation cutoff angle. If we assume that the foliage is thick enough to block the GPS signals, its effect will be similar to that of increased elevation cutoff angles, namely, the es-timated height will be lower.
Fig. 5. The height difference from the vertical coordinate of JINJ obtained with an elevation cutoff angle of 5◦ for 10 days during the period 1–10 January, 2008. The elevation cutoff angle was incremented by 1◦between 5◦and 30◦.
the standard Receiver Independent Exchange (RINEX) for-mat, enabling existing RINEX files to be edited, and data to be checked for quality before post-processing (Estey and Meertens, 1999). As one of the quality-checking functions, TEQC can compute the ratio of complete to possible obser-vations as a percentage. We used this observation ratio to determine whether the ratio has a seasonal variation. If the signals are blocked by thick foliage, the observation ratio should be lower in the summer months than in the winter. The INCH site was chosen for this test because it is sur-rounded by trees growing above the antenna and shows the lowest uplift velocity. We ran TEQC on RINEX files for the same data span as in Fig. 1 and computed the daily ob-servation ratios. During this period, no hardware changes or firmware upgrades were conducted at the site, thus the change in the observation ratio should be caused only by the growing trees. The observation ratio was computed for possible measurements above an elevation angle of 10◦. Figure 7 depicts the ratio variations for about 2.5 years.
The observation ratio was found to have a clear seasonal variation, with a value of approximately 90% in the winter
Fig. 6. The 10-day averages and standard deviations of east, north, and height differences from the coordinate of JINJ obtained with a 5◦ elevation cutoff angle. The solid line is the second-degree polynomial function fitted to the data.
2006 2006.5 2007 2007.5 2008 80
85 90 95
Year
Observation Ratio (%)
Fig. 7. The ratio of complete to possible observation for INCH as a percentage.
obser-vation ratio and annual tree growth and the corresponding increase in signal blockage. Figure 7 also clearly shows that the minimum ratio occurs during the months of July and August, which coincide with the period when the leaf area index in Korea is the highest (Kimet al., 2005). The observation ratio also shows a decreasing trend over time during the winter season when all the leaves of deciduous trees fall, with monthly averages for January of 89.2% in 2006, 88.4% in 2007, and 87.8% in 2008. This continuous, gradual reduction is believed to be caused by the growing stems and branches.
4.
Signal Attenuation due to Foliage
This section deals with multipath error and signal atten-uation due to foliage and its seasonal variation. To analyze multipath error, we used multipath indices computed by TEQC. The TEQC multipath indices MP1 and MP2 reflect the multipath error on pseudorange observables on L1 and L2, respectively (Estey and Meertens, 1999). Among the currently available GPS carriers, the signal strength of L2 is weaker than L1 and, therefore, L2 signals are more sus-ceptible to signal attenuation and to multipath. This makes MP2 a better indicator of the foliage effect; as such, we utilized MP2 instead of MP1 in this study. Earlier stud-ies indicated that MP1 and MP2 values are dependent not only on the site environment, but also on the GPS receiver type and firmware version (Parket al., 1998). Thus, for an objective evaluation of the site-specific multipath effect, MP2 values from the same kind of receiver with the same firmware version have to be compared. Of the five stations analyzed in this study, SEOS, INCH, and PAJU have the same kind of receiver (Trimble 4000SSi) with exactly the same firmware version. ICNW and SUWN were excluded from this analysis because both stations are equipped with a unique receiver: an Ashtech iCGRS receiver at ICNW and a Trimble NetRS at SUWN. The MP2 values can be cal-culated at selected measurement intervals, but to simplify the analysis we took daily averages from MP2 values sam-pled at 30-s intervals. The daily average MP2 values at each site were computed for more than 4 years to detect seasonal trends, if any.
Figure 8 depicts the MP2 variations for SEOS, INCH, and PAJU for the period 2000–2007. During this period, some of the data are omitted because there was a receiver change or firmware upgrade. In Fig. 8(a), the MP2 val-ues of SEOS are shown for 6.5 years, with the horizontal axis denoting the year and the vertical axis the MP2 values (in meters). SOES has perfect sky visibility, with no trees and buildings near the antenna, and no signal attenuation or multipath effect is expected in this ideal environment. However, the MP2 values exhibit some annual trends, rep-resented by sinusoidal fluctuations, with the maximum oc-curring in the summer months of June, July, and August and the minimum occurring in the winter months of De-cember, January, and February. To determine the magni-tude and rate of the annual variation, a function in the form ofy=a+bt+Asin(ωt+φ0)was fitted to the computed MP2 values. In the equation, the parametera denotes the intercept,bthe rate, Athe amplitude,t the time in year,ω the circular frequency, andφ0 the initial phase. From the
0.6
2000 2002 2004 2006 2008 0.6
Fig. 8. The growth and seasonal variations of TEQC MP2 values for three sites: SEOS, INCH, and PAJU.
five estimated parameters, we use the growth rateband am-plitudeAas the main indicators for the annual variation of MP2 values. For SEOS, the rate is 0.1 cm/year with an am-plitude of 3.8 cm. As there are no trees at the site, the rate and amplitude are very small. Even though the annual sig-nal is small, its periodicity cannot be ignored. The cause of a small seasonal variation in MP2 values is believed to be a variable thermal effect on the GPS equipment, such as antennas, cables, and receivers (Larson and Levine, 1999).
Fig. 9. The daily 1-σerror in the height estimates for three sites: INCH, PAJU, and DOND.
To investigate the effect of the signal attenuation due to the foliage, we used the daily coordinate uncertainties from the parameter estimation obtained in the GIPSY-OASIS
data processing. The 1-σ uncertainties were computed for
all of the estimated parameters, but we only used 1-σ val-ues for the height component. The 1-σ values are also de-pendent on the receiver type and firmware versions, so for an objective comparison we had to choose sites with the same hardware configuration. INCH and PAJU have the same receiver type and firmware version, but there was a receiver change at SEOS in December 2006. Consequently, we chose the DOND site (and not SEOS), which is only 40 km from PAJU. DOND has the same hardware as INCH and PAJU, and there are no trees around the antenna. When its data were processed for the same period as that shown in Fig. 1, the uplift velocity was 5.4 mm/year, similar to that of ICNW, SEOS, and SUWN. Figure 9 shows the fluctuation
in 1-σ values of INCH, PAJU, and DOND from September
2005 through January 2008.
The height uncertainties are consistent at DOND, staying in the range of 5–5.5 mm regardless of season. However, at INCH and PAJU, there are clear signs of an annual signal, with higher uncertainties in the summer season and lower ones in the winter. Notably, the uncertainties at INCH and PAJU are at the same level during the winter months, even though they are slightly lower at PAJU, while during the
summer months, 1-σ values of INCH are definitely higher.
The larger difference between INCH and PAJU during the summer can be explained by the presence of thicker foliage at INCH. The slightly higher uncertainties at INCH during the winter season are believed to be caused by more stems and branches at the site.
5.
Conclusion
IGS Site Guidelines state that the site location should have a clear horizon with minimal obstruction at
eleva-tions>5◦(Dowet al., 2005). Thus, buildings or structures near the GPS antenna that can block the signal should be avoided. Growing trees are even worse sources of error, not only because of their growth, but also due to seasonal changes of foliage. In our study, we have demonstrated the blockage of GPS signals due to foliage by analyzing sea-sonal changes in the ratio of complete to possible observa-tions for permanent GPS staobserva-tions. As expected, the obser-vation ratio was higher in the winter season, when all of the leaves of deciduous trees have fallen. With the growth of trees grow above the antenna at one of the test sites, in 2007 the observation ratio of the summer season was found to drop from approximately 86% to in 2006 to approximately 84%. This signal blockage due to trees has the same ef-fect as an increased elevation cutoff angle, decreasing the height estimate. The multipath error index MP2 was com-puted for more than 4 years for three permanent GPS sites with different foliage conditions. Seasonal signals in MP2 were observed at all sites, but those sites with thick foliage or higher tree density were found to have higher amplitudes and an increasing trend in annual variation. Signal atten-uation due to foliage and the resulting degradation of ac-curacy were investigated with the coordinate uncertainties in the parameter estimation process. The 1-σ values in the height estimates also showed annual variation; their ampli-tudes were higher for the sites with thick foliage.
Acknowledgments. This work was supported by INHA UNI-VERSITY Research Grant (INHA-36093). We thank Ministry of Land, Transportation, and Maritime Affairs for generously making their GPS data available to the authors.
References
Aoki, Y. and C. H. Scholz, Vertical deformation of the Japanese
is-lands, 1996–1999, J. Geophys. Res., 108(B5), 2257, doi:10.1029/
2002JB002129, 2003.
water-vapor determinations,Phys. Chem. Earth,23, 91–96, 1998.
Dong, D., P. Fang, Y. Bock, F. Webb, L. Prawirodirdjo, S. Kedar, and P. Jamason, Spatiotemporalfiltering using principal component analysis and Karhunen-Loeve expansion approaches for regional GPS network analysis,J. Geophys. Res.,111, B03405, doi:10.1029/2005JB003806, 2006.
Dow, J. M., R. E. Neilan, and G. Gendt, The International GPS Service (IGS): Celebrating the 10th anniversary and looking to the next decade,
Adv. Space Res.,36(3), 320–326, 2005.
Elosegui, P., A. Rius, J. L. Davis, G. Ruffini, and S. Keihm, A regional GPS experiment for estimating the spatial and temporal variations of water vapor, inProceedings of the ION GPS-97 10th International Technical Meeting of the Satellite Division of The Institute of Navigation, 241–
248, Kansas City, Missouri, 1997.
Estey, L. H. and C. M. Meertens, TEQC: The multi-purpose toolkit for GPS/GLONASS data,GPS Sol.,3(1), 42–49, 1999.
Hamdy, A. M., P.-H. Park, and H. C. Lim, Horizontal deformation in South Korea from permanent GPS network data, 2000–2003,Earth Planets Space,57, 77–82, 2005.
Heflin, M. B., W. I. Bertiger, G. Blewitt, A. P. Freedman, K. J. Hurst, S. M. Lichten, U. J. Lindqwister, Y. Vigue, F. H. Webb, T. P. Yunck, and J. F. Zumberge, Global geodesy using GPS withoutfiducial sites,Geophys. Res. Lett.,19(2), 131–134, 1992.
Jin, S. and P.-H. Park, Strain accumulation in South Korea inferred from GPS measurements,Earth Planets Space,58, 529–534, 2006. Kim, S. H., J. H. Park, C. S. Woo, and K. S. Lee, Analysis of temporal
variability of MODIS Leaf Area Index (LAI) product over temperature forest in Korea,IGARSS, 4343–4346, 2005.
Koh, I.-S. and K. Sarabandi, Polarimetric channel characterization of fo-liage for performance assessment of GPS receivers under tree canopies,
IEEE Trans. Antennas and Propagation,50(5), 713–726, 2002. Lachapelle, G., J. Henriksen, and T. Melgard, Seasonal effect of tree
fo-liage on GPS signal availability and accuracy for vehicular navigation, inProceedings of the ION GPS-94 7th International Technical Meeting of the Satellite Division of The Institute of Navigation, Salt Lake City, 1994.
Larson, K. M. and J. Levine, Carrier-phase time transfer,IEEE Trans. Ultrasonics, Ferroelectrics, and Frequency Control,46(4), 1001–1012, 1999.
Mader, G. L., GPS antenna calibration at the National Geodetic Survey,
GPS Sol.,3(1), 50–58, 1999.
Matsumoto, K., T. Sato, T. Takanezawa, and M. Ooe, Ocean tide mod-els developed by assimilating TOPEX/POSEIDON altimeter data into hydrodynamical model: A global model and a regional model around Japan,J. Oceanogr.,56, 567–581, 2000.
Park, K.-D., Vertical deformation rates of the Korean peninsula derived from seven years of data at permanent GPS sites, inProceedings of the 14th GNSS Workshop, Jeju, Korea, 2007 (in Korean).
Park, K.-D., R. S. Nerem, and M. S. Schnewerk, Site-specific multipath characteristics of IGS and CORS GPS stations,Eos Trans., Suppl.,
79(40), F183, 1998.
Petrov, L. and J.-P. Boy, Study of the atmospheric pressure loading signal in very long baseline Interferometry observations,J. Geophys. Res.,109, B03405, doi:10.1029/2003JB002500, 2004.
Spilker, J. J. Jr., Foliage attenuation for land mobile users, inGlobal Po-sitioning System: Theory and Applications, Vol. 1, edited by Parkinson, B. W. and Spilker, J. J. Jr., 569–583, American Institute of Aeronautics and Astronautics, Inc., Washington, D.C., 1996.
Wdowinski, S., Y. Bock, J. Zhang, P. Fang, and J. Genrich, Southern Cal-ifornia permanent GPS geodetic array: Spatialfiltering of daily posi-tions for estimating coseismic and postseismic displacements induced by the 1992 Landers earthquake,J. Geophys. Res.,102(B8), 18057–
18070, 1997.
Zumberge, J. F., M. B. Heflin, D. C. Jefferson, M. M. Watkins, and F. H. Webb, Precise point positioning for the efficient and robust analysis of GPS data from large networks,J. Geophys. Res.,102(B3), 5005–5017, 1997.