© 2014, IJCSMC All Rights Reserved
202
Available Online atwww.ijcsmc.comInternational Journal of Computer Science and Mobile Computing
A Monthly Journal of Computer Science and Information Technology
ISSN 2320–088X
IJCSMC, Vol. 3, Issue. 9, September 2014, pg.202 – 211
RESEARCH ARTICLE
DNS HEALTH VISUALIZATION
C.Yamini, (M.Tech) Dr. R.Balaji Mr. N.Papanna, (Ph.D)
[email protected] [email protected] [email protected]
CSE Department SR.Technical Officer Assistant Professor Sree Vidyanikethan Engg. College C-DAC, Bangalore CSE Department
Sree Vidyanikethan Engg. College
Abstract: The Internet is a highly decentralized and distributed infrastructure, which consists of critical components like IP routing, DNS for ensuring its availability and accessibility. The ever-growing Internet with its phenomenal growth of Websites has led the DNS Extension Working Group (DNSEXT) of the Internet Standards organization – IETF - to identify DNS as the “Critical Infrastructure”. DNS enables naming services used by every internet user, networked application and networked critical infrastructure. Without the availability of DNS, it will be extremely difficult for users to access websites and emails and such other important functions. One of the key challenges in ensuring the availability of DNS is to periodically monitor the global DNS health, which requires resolving challenges such as defining the parameters of DNS health, collecting and collating summarized data from various sources and perform the visualization activity within a short-period of time, so that any counter-measures to protect the DNS health can be taken at the earliest. Visualizing the DNS health requires dealing with different kinds of nodes, analyzing their typical response patterns, their current loads etc., and provides intuitive visualizations for the decision makers - especially the DNS operators at various levels to deal with any threats to the security and stability of the DNS. In this paper, DNS health visualization has been attempted, using commonly available tools, and evaluated for its usefulness and usability.
1. Introduction
DNS is a distributed and decentralized system comprising of several root servers distributed geographically across
the World.TLD, ccTLD‟s and gTLD‟s located across each country of the World, and the authoritative DNS servers
spread across the Internet. The DNS, as part of the Internet infrastructure, is a critical component for internet access
across the world. A widely used analogy is that DNS compared to a telephone book for the Internet. In 2007, the
Internet Engineering Task Force‟s (IETF‟s) DNS Extensions Working Group (DNSEXT) identified the DNS as “a critical Internet infrastructure” because it resolves billions of queries per day in support of global communications
and commerce.
DNS-OARC, the Domain Name System Operation Analysis and Research Center, is a non-profit membership
© 2014, IJCSMC All Rights Reserved
203
In 2010 the concept of DNS health was proposed as a way of defining the stability of the DNS system. The concept
of DNS health was proposed around five main indicators: availability, coherency, integrity, resiliency, and speed. A
system cannot be described as “healthy” if it is not stable and can become unhealthy quickly if it is not secure.
Visualization of the DNS health will help the DNS administrators to understand the patterns and behaviors of the
various nodes of the DNS networks which can facilitate them to take appropriate measures when required. In this
paper, we aim to visualize the global DNS network by monitoring and visualizing nodes at multiple levels of
granularity - from independent authoritative DNS servers to root name servers, including critical nodes – nodes that
either have large number of nodes below it or have large number of users depending on it. The DNS administrators
will then be able to find the details of the nodes, including their geographical locations, their current response times
through passive probes and the deviation from the historical response times, which will help to determine whether a
node is working normally or indicates an abnormal condition.
The challenges involved in visualizing a global distributed system, such as DNS are:
Provide a snapshot of the entire system in a single instance/screen.
Visualize traffic patterns and differentiate regular and abnormal behavior of each node and segments of the
network
Draw attention of the user to the nodes that may indicate abnormal behaviors
Provide the ability to drill-down and introspect nodes that are of concern to the administrator Visualization data should reflect the live or near-real-time data
Visualize common attacks, attack strategies in order to aid the user
2. Related Work
2.1 DNS Health Definition
The term „DNS health‟ refers to how well the DNS is functioning at any given moment. However, defining what
constitutes a „healthy condition‟ depends largely on the context, or the perspective of the viewer or analyzer
. I
norder to arrive at the status of the global DNS health, we need to monitor and visualize the entire DNS hierarchy
system.
There have been a couple of initiatives that have attempted to define and measure DNS health primarily
from a local perspective. The DNS community needs to develop a high-level list of parameters that can define the
„DNS Vital Signs‟ and can be used as part of the health assessment of the system. The five vital signs of DNS health
so far identified and proposed are:
1. Coherency
2. Integrity
© 2014, IJCSMC All Rights Reserved
204
4. Availability5. Resiliency
The Measuring the Naming System (MeNSa) [2] project proposes a formal and structured methodology and a set of
metrics for the evaluation of the DNS health and security levels. The scope of the MeNSa project was to define a
methodology and a set of metrics to quantify the global health level of the DNS.
2.2 DNS Visualization tools
A number of recent tools and systems have been built to visualize DNS node status, traffic etc. and also to help limit
the use of names used for malicious purposes. Few of the prominent tools are listed below:
2.2.1 DNSTOP
DNSTOP [8] is an application that helps the network or DNS administrators to find how the DNS queries are routed
through in a network. They aggregate and display the statistics including top-level domains, and secondary level
domains accessed by capturing the IP packets from the user networks. However the tool does not provide graphical
visualization.
2.2.2 DSC – DNS Statistics Collector
DSC stands for DNS statistics collector. It has to be run on busy DNS nodes which will then collects statistics and
provides time series graphs useful for long term trending of general status and health. DSC captures statistics such
as: query types, response codes, most-queried TLDs, popular names, IPv6 root abusers, query name lengths, reply
lengths etc. to aid administrators to discover problems like excessive queries, misconfigured systems, routing
problems etc. It uses a CGI (Common Gateway Interface) script to display data in a web browser.
2.2.3 DNSViz
DNSViz is a DNS visualization tool. DNSViz is a tool for visualizing the status of a DNS zone. It was designed as a
resource for understanding and troubleshooting deployment of the DNS Security Extensions (DNSSEC). It provides
a visual analysis of the DNSSEC authentication chain for a domain name and its resolution path in the DNS
namespace, and it lists configuration errors detected by the tool [7].
2.3 DNS Visualization Metaphors
Flying term is a motivated visual metaphor (pictorial metaphor) for visualizing the dynamic nature of the DNS
queries. It provides enhanced monitoring capability and situational awareness for visualizing the DNS queries. A
metaphor is a figure to speech that compares one thing to another. A visual metaphor uses an image rather than
© 2014, IJCSMC All Rights Reserved
205
The addition of visual metaphors [8] such as Stacking Graphs, Two Tone Pseudo Color, and Chernoff Face
Glyph within the same application framework provides enhanced monitoring capability and situational awareness
for visualizing DNS queries.
3. Implementation
The tools discussed so far are installed either in the DNS nodes directly or in the devices of the user networks. This
restricts and provides only the view of the DNS networks under the administration of a network, in addition to the
privacy restrictions.
We propose a simple but a global DNS network visualization mechanism, by conducting passive probes
and determining the status based on historical behaviors.
3.1 Google Maps
Google Maps is a Web-based service that provides detailed information about geographical regions and sites around
the world. In addition to conventional road maps, Google Maps offers aerial and satellite views of many places.
The Google Maps application program interface (API) makes it possible for Web site administrators to
embed Google Maps into a proprietary site such as a real estate guide or community service page.
3.1.1 Google Maps API
Google launched Google maps API in June 2005 to allow developers to integrate Google maps into their websites.
By using the Google maps API, it is possible to embed Google Maps site into an external websites. It is free for
commercial use, provided that the site on which it is being used is publicly accessible and doesn‟t charge for access
and it is not generating more than 25,000 map accesses a day.
Google Maps APIs lets developers embed Google Maps on webpage‟s using a JavaScript or Flash
interface. The Google Maps API is designed to work on mobile devices and desktop browsers.
The Google map API is used to
View and monitor the Root Name Servers, Replications of Root Name Servers, ccTLD‟s, gTLD‟s and
Critical Nodes in the world.
Highlighting the Criticalness, Warnings and Liveliness of a node. Facilitate Probing of a node.
3.2 Root Name Servers
A root name server is a name server for the root zone of the Domain Name System of the Internet. It directly
answers requests for records in the root zone and answers other requests by returning a list of the authoritative name
© 2014, IJCSMC All Rights Reserved
206
infrastructure because they are the first step in translating (resolving) human readable host names into IP
addresses that are used in communication between Internet hosts.
As of February 2013, there are 13 root name servers specified, with names in the form letter
.root-servers.net, where letter ranges from A to M. Ten servers were originally in the United States; some are now
operated using anycast addressing. Three servers were originally located in Stockholm (I), Amsterdam (K), and
Tokyo (M).
Locations Root Servers
Chennai, Tamil Nadu, India [f]
Mumbai, Maharashtra, India [i]
New Delhi, India [k]
Table 1: List of Root Servers and their Replications in India
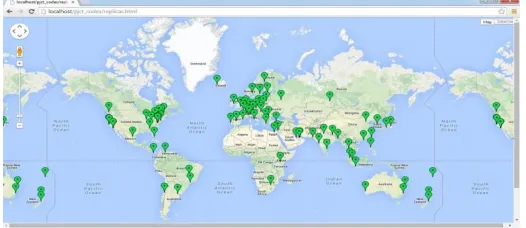
Fig. 1. Root Name Servers in the world
© 2014, IJCSMC All Rights Reserved
207
3.3 TLDA top-level domain (tld) is one of the domains at the highest level in the hierarchical domain name system of
the internet. The top-level domain names are installed in the root zone of the name space. For all domains in lower
levels, it is the last part of the domain name, that is, the last label of a fully qualified domain name. For example, in
the domain name www.example.com, the top-level domain is com (the "dot" and the word that follows it).
Responsibility of management of most top-level domains is delegated to specific organizations by the internet
corporation for assigned names and numbers (icann), which operates the internet assigned numbers authority (iana),
and is in charge of maintaining the dns root zone.
Types of TLD:
1. ccTLD‟s
2. gTLD‟s
3. sTLD‟s
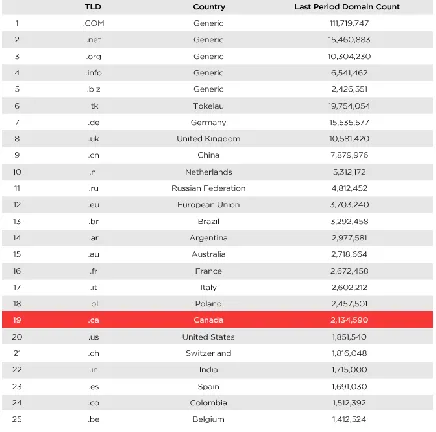
Table : 2 List of Top 25 TLD‟s
3.3.1 ccTLD’s
Country Code Top-Level Domains that were created specifically for a single country‟s use. That country can put any
sort of restrictions on it that they choose. Some countries only allow citizens to register domains under their ccTLD.
Other countries „rent‟ their TLD out for use by the global public, as in the case with .cc, the official ccTLD for the
Cocos Islands, .ws, the official ccTLD for Western Samoa, and .tv, the official ccTLD for Tuvalu. Two letter
domains established for countries or territories. Internationalized country code top-level domains (IDN ccTLD):
© 2014, IJCSMC All Rights Reserved
208
Fig. 3. ccTLD‟s in the world3.3.2 gTLD’s
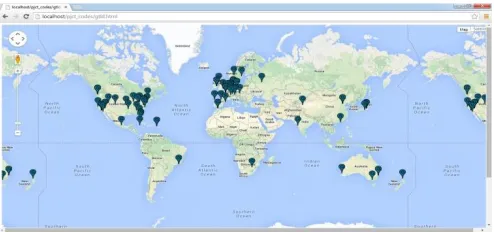
Generic Top-Level Domains are the most common names. These include .com, .net, .org, .biz, .info, and several
others. Top-level domains with three or more characters are called gTLD‟s. These top level domains are meant to be
"general purpose domains" and are not generally associated with a particular country. Typically these domains can
be registered by anyone, however a few extensions are considered "restricted" which means that a specific group of
people are eligible to register then, but are not directly tied to a specific country.
3.3.3 sTLD’s
Sponsored Top level Domain (sTLD) is a special category of the top level domains (TLD) in the Domain Name
System (DNS) maintained by the Internet Assigned Numbers Authority (IANA). It is actually a subdivision of
gTLD‟s. These names are controlled by specific agencies within an industry. For example, .museum is a sTLD‟s
regulated by the Museum Domain Management Association. They reserve the TLD for museum websites.These are
overseen by private organizations.
Fig. 4. gTLD‟s and sTLD‟s in the world
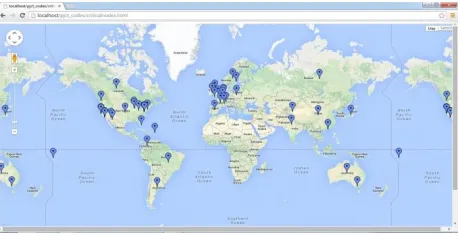
3.4 Critical Nodes
We define a critical node as a node in a DNS network which has either a lot of nodes beneth it on or a large number
© 2014, IJCSMC All Rights Reserved
209
The rootservers, major ccTLD‟s, major gTLD‟s, major Domain names are considerd as a critical nodes. These
critical nodes have to be periodically monitored for their activeness and response times.
The Following visualization depects these identified critical nodes and also provides mechanisms to conduct
probes and visualize their status over a time period.
Fig .5. Critical nodes in the world
3.5 Probing and Statistics of DNS health
Fig. 6. Marker Information
© 2014, IJCSMC All Rights Reserved
210
4. Analysis
Monitoring thousands of nodes by conducting probes manually is a near impossible task to determine the health of
the DNS. We had proposed a mechanism to visualize the health of the nodes, through the maps and graphs as
illustrated in the previous section. Here we evaluate the usefulness and usability of the visualization for a DNS
network.
We setup couple of DNS nodes, wherein few of them were classified as critical, and probes were conducted, and
statistics generated for a short period of time, and the visualization was observed.
Next, a DoS attack was emulated on two of the identified critical DNS nodes and the visualization patterns were
observed for the cues. It emerged that the visualization tool provisioned, provided a quick and easy way to recognize
the problematic nodes in a group of nodes, as well as was able to conduct probes by the administrator to identify the
problem with the node and take action accordingly.
5. Conclusion
Domain Name System (DNS) is therefore one of the critical infrastructure components of the Internet. The Security,
Stability and Resiliency of the DNS are essential, for users to access and use Internet. This SSR factor critically
determines the health of the DNS. The health of the DNS, is the health of the whole distributed system, including
root name servers, TLDs, and authoritative servers.
The goal of DNS health visualization is to assist the user/administrator visualize the health of the DNS and
serve as a warning or precautionary system – by displaying the problem / concerns areas, visualizing DNS attacks,
visualizing anomalous traffic patterns, with abilities to drill-down to the level of detail required. The Benefits in UI
are as follows
By clicking the probing and statistics it will display all the information.
Root name servers, ccTLD‟s, gTLD‟s and sTLD‟s, critical nodes it can be displayed in Google maps by
clicking the options in a dropdown menu.
We can able to zoom in, zoom out the Google map.
References
[1]
ICANN, “Measuring the Health of the Domain Name System,” Report of the 2nd Annual Symp. DNSSecurity, Stability & Resiliency, Kyoto, Japan, 2010.
[2] E. Casalicchio, Univ. of Rome Tor Vergata, M. Caselli and A. Coletta, Global Cyber Security Center (GCSEC),
“Measuring the Global Domain Name System”, IEEE Network, January/February 2013.
© 2014, IJCSMC All Rights Reserved
211
[4] http://www.iana.org/domains/root/servers.[5] http://www.iana.org/domains/root/db.
[6] http://newgtlds.icann.org/en/.
[7] http://dnsviz.net/
[8] ACM, “Visualizing DNS Traffic”, Pin Ren, John Kristoff, Bruce Gooch, VizSEC‟06, November 3, 2006,
Alexandria, Virginia, USA. Copyright 2006 ACM 1595935495/06/0011