Modeling of the Stepping Process of Negative
Lightning Stepped Leaders
Vernon Cooray * and Liliana Arevalo
Department of Engineering Sciences, Uppsala University Uppsala, Sweden
Abstract— A physical model based on the mechanism observed in experimental investigations is introduced to describe the formation of negative leader steps. Starting with a small length of a space leader located at the periphery of the negative streamer system of the stepped leader the model simulates the growth and the subsequent formation of the leader step. Based on the model, the average step length, the average step forming time and the average stepped leader propagation speed is estimated as a function of prospective return stroke peak current. The results show that the average step length and the average leader speed increases with increasing prospective return stroke current. The results also show that the speed of the stepped leader increases as it approaches the ground. For a 30 kA prospective return stroke current the average leader speed obtained is about 5 x 10⁵ m/s and the average step length was about 10 m. The results obtained are in reasonable agreement with the experimental observations.
Keywords: Lightning, Stepped leader, Space leader, Space stem
1. INTRODUCTION
About 90% of lightning ground flashes transport negative charge to Earth and they are called negative ground flashes. Return strokes of negative ground flashes are initiated by stepped leaders that travel from cloud to ground. Photographic evidence show that these leaders travel towards ground in intermittent steps and experimental data on the time intervals between the steps and the lengths of the individual steps are available in the literature [1,2]. The available information show that the time interval between steps span from 10 μs to 100 μs and the lengths of the steps span from 5 m to about 200 m [1,2,3,4]. More recently, detailed development of the stepping process in negative lightning leaders has been observed using high speed photography [4].
The first detailed information concerning the development of negative leaders in laboratory sparks were obtained by the group of scientists working at Renadieres [5]. More details concerning the development of negative leaders were obtained in experiments conducted by Castellani et al. [6] where the bi-directional development of the leader steps were identified. Based on the experimental data obtained at Renadieres [5], Bacchiega [7] developed the first theoretical model of the stepped leader in long air gaps. The first application of the available experimental data to develop a negative lightning stepped leader model was conducted by Lalande et al. [8]. In that study the negative stepped leader model was used to simulate the properties of the negative counterpart of a bidirectional leader in an altitude triggered lightning. Based on the work of Bacchiega [7] and Lalande et al. [8], Mazur [9] developed a stepped leader model to study the attachment of negative ground flashes to grounded structures. However, in that study no information concerning the step lengths and time interval between steps is not presented. The theory developed by Lalande et al. [8] was used by Arevalo and Cooray [10] to develop a models for negative leaders in laboratory sparks. In this model a novel procedure was used to calculate the charge in the negative streamer region of the negative stepped leader. Another study to simulate the negative lightning leader was introduced by Beroual et al. [11]. In this study, the stepped leader was simulated by an electrical network, the parameters of which were extracted from electromagnetic wave propagation and experimentally observed properties of the negative leaders.
There are several leader progression models that have been developed to analyse the attachment of stepped leaders to grounded structures. These models treat the stepped leader as a charged channel that propagates continuously from cloud to ground [12,13,14]. Development of these models further requires more detailed representation of the stepped leader including its stepping process.
The paper is organized as follows. First a description of the mechanism of laboratory and lightning stepped leaders observed experimentally is provided. This section is followed by a detailed description of the model to be used in extracting lightning leader parameters. In the third section the model is exercised to generate parameters pertinent to stepped leaders and a comparison of these parameters with experimental observations is provided. This section is followed by a conclusion.
2. Mechanism of the stepping process of the stepped leader
Information gathered from long sparks show that the stepping process in negative leaders is mediated by space stems and space leaders that do not exist in the positive breakdown [5]. The mechanism is the following. Together with the formation of a negative leader step a burst of negative streamer discharges extend from the tip of the newly created leader step. Close to the extremity of the streamer region a bright spot appears and it is called a space stem. From this space stem streamers of both polarities develop in opposite directions. The positive streamers propagate towards the tip of the negative leader and the negative streamers in the opposite direction. The positive streamers from the space stem are actually propagating through the negative streamer region generated during the formation of the last step of the stepped leader. These streamer discharges converts the space stem to a space leader. The space leader elongates in both direction with one end travelling towards the tip of the negative stepped leader (i.e. tip of the last step) and the other end away from it. As the space leader approaches the tip of the negative leader its speed increases exponentially. The connection of the space leader with the tip of the stepped leader is accompanied by a simultaneous illumination of the whole space leader channel starting from the meeting point. This illumination is associated with a process that transforms the space leader into a part of the stepped leader channel. As a result the negative leader length increases by an amount equal to the length of the space leader. During this conversion process a burst of negative corona emanates from the new tip of the negative leader (i.e. the rear end of the space leader that travelled away from the stepped leader). At the extremity of this streamer region a new space stem is created and the process is repeated. Recently, the stepping process in negative stepped leaders in laboratory were studied with extremely high resolution in a study conducted by Kochkin et al. [15]. This study confirms the bidirectional nature of the discharge. Moreover, the study shows that fully extended negative streamers leave behind luminous regions (called beads in that study) on their path and some of these beads give rise to the space stems.
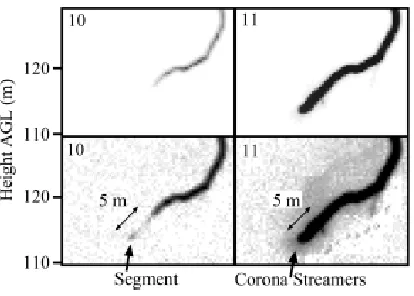
in Figure 1 which was adapted from reference [4]. This photograph shows clearly the development of the space leader and the subsequent development of the step.
Figure 1: The formation of a leader step as observed in the negative leader of an altitude triggered lightning. The lower set of diagrams show the contrast enhanced picture of the upper set. Observe the high luminosity region located ahead of the leader tip in the lower left diagram which is probably the space leader. The lower right diagram shows the newly formed leader step together with the streamers that emanated from the tip of the leader. Adapted from [4].
3. THE MODEL
As observed in the experiments and described in the last section, the stepping process of the negative stepped leader starts with the creation of a space stem and a space leader (called a pilot system) and the stepping process will be completed when the space leader reaches the tip of the negative stepped leader. To the best of our knowledge the exact mechanism that gives rise to the space stem and the subsequent space leader is not known. Moreover, sufficient experimental data that can be used to create and test a model for the space stem and its subsequent conversion to the space leader is not available. For this reason in the model the presence of a short length space leader is assumed a priori.
The simulation starts when the down coming stepped leader has extended to a given length, say Ll, below the negative charge centre. The various steps of the simulation are the following:
linear charge density along the channel of a stepped leader with a given prospective return stroke current. Using this charge distribution the electric field ahead of the stepped leader channel is estimated.
2) The experimental data show that negative streamers require a background electric field of about 1 – 2 x 10⁶ V/m for stable propagation [5]. In the simulations this field is assumed to be 1.5 x 10⁶ V/m. From the calculated electric field distribution ahead of the leader tip the point where the electric field decreases beyond the value 1.5 x 10⁶ V/m is obtained. It is assumed that this point defines the boundary of the negative streamer region. Let us represent the distance from the tip of the leader to this point by
Ls.
3) The negative streamers emanating from the negative leader tip maintains a constant potential gradient in the negative streamer region. Experimental data show that this potential gradient is also equal to about 1 – 2 x 10⁶ V/m [5,17]. Based on this, in the simulation we assume that in the negative streamer region (marked in Figure 2) the potential gradient has a value equal to 1.5 x 10⁶ V/m. In the analysis it is assumed that the electron avalanche will be converted to a streamer when the number of positive ions at the head of the avalanche exceeds about 108[17]. The simulation continues using the time varying electric field of the stepped leader until the streamer inception criterion is satisfied.
4) The charge in the negative streamer burst generated from the space leader is calculated following the procedure outlined in references [14]. The charge associated with these streamer bursts are calculated using a distance-voltage diagram with the origin at the tip of the grounded conductor as follows. The procedure is illustrated in Figure 3. The streamer zone is assumed to maintain a constant potential gradientEstr. In the distance-voltage diagram this is represented by a straight line. On the same diagram the
background potential produced by the thundercloud and the down-coming stepped leader at the current time is depicted. If the area between the two curves up to the point where they cross is
A
(see Figure 3), the charge in the streamer zone is given byns Q
Q ≈K A (1)
whereKQ is a geometrical factor. Becerra and Cooray [14] estimated its value to be about 3.5 x 10⁻¹¹ C/V.m.
leave behind positive charge that is being utilized in the creation of positive streamers. The charging of the space leader due to the removal of negative charge from the negative streamer burst will give rise to a burst of positive streamers. Assuming net zero charge on the space leader the charge associated with the positive streamer burst, Qps , assumed to be equal to Qns .
Figure 2: Distance-Voltage diagram that illustrates how the charge associated with a streamer burst is obtained. The area between the two curves representing the background potential and the streamer potential is marked A.
6) The currents associated with the streamer bursts convert their stems into hot channels and they become part of the space leader. This leads to the elongation of the space leader. Following the procedure introduced in reference [17], the extension of the
negative and positive tips of the space leader is assumed to be
Q
ns/
q
l whereq
l is the charge necessary to thermalize a unit length of the leader channel. Based on the theory of Gallimberty [17] it is assumed to be equal to 60 μC/m. This completes one cycle of the numerical simulation. The time taken for this cycle is estimated by taking into consideration the length of the negative and positive streamer bursts from the space leader and dividing these distances by the speed of negative streamers. The experimental data obtained with high speed cameras shows that fully developed positive streamers can propagate at speeds close to about 4 x 10⁶ m/s and the speed of negative streamers is about 25% lower than the speed of positive streamers [18]. Since the streamers in streamer bursts associated with lightning are rather long in the simulation we assume the positive and negative streamer speeds to be 106 m/s and 4 x 10⁶ m/s. Observe that positive streamers are propagating in over-voltage condition because they are moving in a region where the electric field is larger than the electric field necessary for stable positive streamerDistance from the tip of the conductor. Voltage
Background potential
propagation. Their propagation is limited only by the charge made available to it by the negative streamers. Thus the length of the positive streamer is estimated again from a curve similar to that in Figure 3 but from the known value of the area. The time necessary for this cycle of physical process i.e. from one inception of negative corona from the negative tip of the space leader to the next streamer inception is given by
/
/
c ns ns ps ps
t
=
l
v
+
l
v
(2)
Figure 3: Intermediate stage of the numerical simulation of the negative leader propagation.
The cycle is repeated again using the new space leader length as the initial value. The procedure continues until the space leader meets the tip of the negative stepped leader. When this happens the stepped leader is assumed to extend to a distance equal to the length of the space leader. The time necessary for the development of the step once the space leader meets the stepped leader tip is neglected in calculating the speed of stepped leaders. The total time necessary for the initiation of the step is given by
1 m n
step cm
m
T
=t
=
=
In the above n is the total number of cycles necessary for the space leader to reach the tip of the stepped leader and
t
cmis the time as defined by Equation 2 to complete the mth cycle.Already developed stepped leader
Streamer region of the stepped leader Positive streamer region of
the space leader
Negative Streamer region of the space
Once the new step is formed, the streamer length associated with the new extension of the stepped leader is estimated as before and the procedure is repeated again. It is important to mention here that in the simulation the space leader is assumed to have a rather high conductivity so that it can be considered as a good conductor in estimating the electric fields at its tips which are necessary in calculating the length of streamer regions and the electric field through which the negative streamers from the space stem are propagating.
4.RESULTS
The stepped leader charge distribution model as developed by Cooray et al. [16] gives the distribution of the stepped leader charge as a function of the height of the stepped leader tip above ground. Thus the electric field in front of the stepped leader channel when its tip is at a given height from ground level, a parameter necessary as an input to the stepped leader model, is evaluated using this model. Combining this with the stepped leader model the step length, the step forming time and the average stepped leader speed was calculated as a function of the height of the stepped leader tip for several prospective return stroke currents. Before presenting these results, let us consider first the available information concerning the stepped leaders.
The results are obtained for four prospective return stroke currents with peaks 15 kA, 30 kA, 45 kA and 60 kA. In the simulation step lengths are calculated for step leader lengths from 2500 km to 4750 km. The total length of the channel selected in the calculation is 5 km. Moreover, the calculations were conducted for three values of negative streamer speeds, namely, 0.5 x 10⁶ m/s, 106 m/s and 2 x 10⁶ m/s. Furthermore, two sets of calculations were conducted one for the negative streamer potential gradient of 106 V/m and the other for 2x10⁶ V/m. Let us consider the results obtained for leader step length, stepping time and the speed of the leader separately.
4.1 Step length
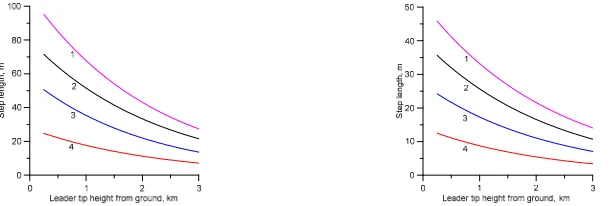
The results of the calculation show that the step length is independent of the speed of negative streamers. It is only controlled by the streamer potential gradient. This is understood because the streamer gradient decides the length of the streamer region and this is directly related to the step length. On the other hand the streamer speed controls the time necessary for the formation of the step. The average step length as a function of peak current is shown in Figure 4a for Estr = 106 V/m and Figure 4a for Estr = 2 x 10⁶ V/m. First observe that the step length increases with increasing peak current. The reason for increasing step length with
S
tep length, m
Figure 4: Step length as a function of the height of the leader tip for four different current peaks. (1) 60 kA, (2) 45 kA, (3) 30 kA and (4) 15 kA. Calculated assuming (a) Estr = 106 V/m and (b) Estr = 2 x 10⁶ V/m.
4.2 Step forming time
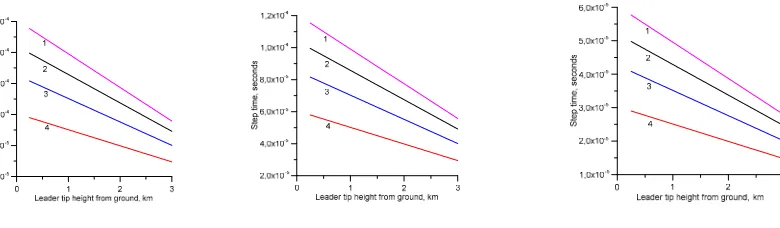
Results show that the step forming time is affected both by the prospective peak current, speed of negative streamer and the potential gradient of the streamer. For this reason in addition to the calculations conducted with two streamer potential gradients calculations are conducted also for three negative streamer speeds. The results are presented in Figure 5 and Figure 6. Observe
St
ep t
ime,
seconds
Figure 5: Step forming time as a function of leader tip height from ground level for four different prospective return stroke currents. (1) 60 kA, (2) 45 kA, (3) 30 kA and (4) 15 kA. Results are shown for three different negative streamer speeds, namely, (a) 0.5 x 10⁶ m/s, (b) 1.0 x 10⁶ m/s and (c) 2.0 x 10⁶ m/s. Calculations are for E
str = 106 V/m.
with decreasing potential gradient. This time decreases with increasing streamer speed because this will reduce the travel time of the streamers.
S
tep t
im
e,
s
ec
onds
Figure 6: Step forming time as a function of leader tip height from ground level for four different prospective return stroke currents. (1) 60 kA, (2) 45 kA, (3) 30 kA and (4) 15 kA. Results are shown for three different negative streamer speeds, namely, (a) 0.5 x 10⁶ m/s, (b) 1.0 x 10⁶ m/s and (c) 2.0 x 10⁶ m/s. Calculations are for E
str = 2 x 10⁶ V/m
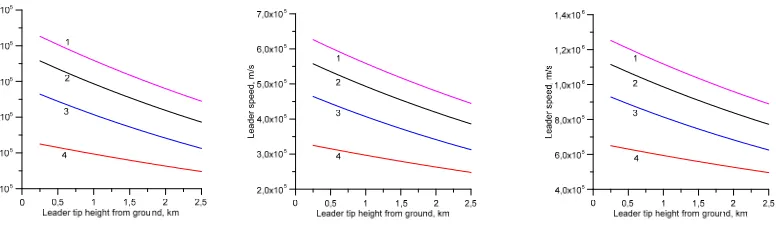
4.3 Leader speed
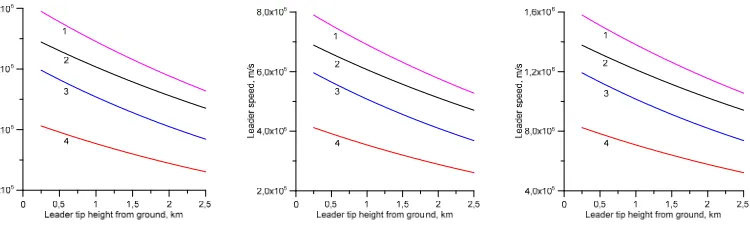
The speed of propagation of the leaders as a function of the height of the stepped leader tip from ground level for four different prospective return stroke currents and for different streamer parameters are shown in Figures 7 and 8. First observe that the leader
Figure 7: Leader speed as a function of leader tip height from ground level for four different prospective return stroke currents. (1) 60 kA, (2) 45 kA, (3) 30 kA and (4) 15 kA. Results are shown for three different negative streamer speeds, namely, (a) 0.5 x 10⁶ m/s, (b) 1.0 x 10⁶ m/s and (c) 2.0 x 10⁶ m/s. Calculations are for E
Leader
speed,
m
/s
Figure 8: Leader speed as a function of leader tip height from ground level for four different prospective return stroke currents. (1) 60 kA, (2) 45 kA, (3) 30 kA and (4) 15 kA. Results are shown for three different negative streamer speeds, namely, (a) 0.5 x 10⁶ m/s, (b) 1.0 x 10⁶ m/s and (c) 2.0 x 10⁶ m/s. Calculations are for E
str = 2 x 10⁶ V/m.
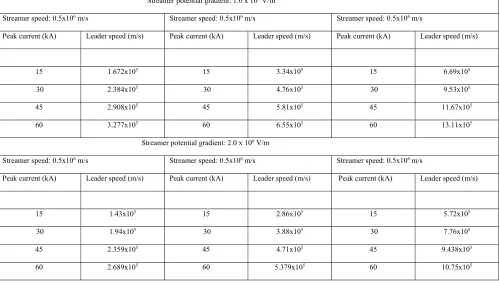
speed increases as the stepped leader nears the ground. For a given height the leader speed increases with increasing peak current, increasing streamer speed and with decreasing streamer potential gradient. The leader speed is controlled both by the step length and the time necessary for the formation of the step. It increases with increasing streamer speed because the latter will reduce the time of formation for a given step length. However, it is the change in step length that influence the leader speed more than the time of formation. This is the reason why the parameters that increase the step length, i.e. larger peak current and lower potential gradient, lead to larger leader speeds. The data presented above gives the instantaneous speed at a given level. What is being measured usually is the average speed. In order to generate data that can be compared directly with experimental data the average speed over the last two kilometres is estimated and its value is tabulated in Table 1. Observe again that the average speed increases with increasing peak current, increasing streamer speed and decreasing potential gradient.
5.DISCUSSION
for this discrepancy is the following. In the calculations we assume that the leader charge increases continuously as the stepped
Table 1: Average speed of the stepped leader over the last 2 km for different values of prospective peak current, streamer speed and streamer potential gradient.
Streamer potential gradient: 1.0 x 10⁶ V/m
Streamer speed: 0.5x10⁶ m/s Streamer speed: 0.5x10⁶ m/s Streamer speed: 0.5x10⁶ m/s
Peak current (kA) Leader speed (m/s) Peak current (kA) Leader speed (m/s) Peak current (kA) Leader speed (m/s)
15 1.672x10⁵ 15 3.34x10⁵ 15 6.69x10⁵
30 2.384x10⁵ 30 4.76x10⁵ 30 9.53x10⁵
45 2.908x10⁵ 45 5.81x10⁵ 45 11.67x10⁵
60 3.277x10⁵ 60 6.55x10⁵ 60 13.11x10⁵
Streamer potential gradient: 2.0 x 10⁶ V/m
Streamer speed: 0.5x10⁶ m/s Streamer speed: 0.5x10⁶ m/s Streamer speed: 0.5x10⁶ m/s
Peak current (kA) Leader speed (m/s) Peak current (kA) Leader speed (m/s) Peak current (kA) Leader speed (m/s)
15 1.43x10⁵ 15 2.86x10⁵ 15 5.72x10⁵
30 1.94x10⁵ 30 3.88x10⁵ 30 7.76x10⁵
45 2.359x10⁵ 45 4.71x10⁵ 45 9.438x10⁵
60 2.689x10⁵ 60 5.379x10⁵ 60 10.75x10⁵
of about 10 m and this agrees to some extent with the results presented by Berger [2]. For the parameters mentioned earlier the stepping time close to ground is about 20 μs and it decreases with increasing height. This value too is in reasonable agreement with the experimental data of Berger [2]. Unfortunately, almost all the studies do not give the prospective peak current and for this reason a direct comparison is impossible in the present study. The study also shows that the leader speed increases with increasing peak current and this tendency is also observed in the experimental data of Campos et al. [24].
created before the streamers reaches their outer extremes it will speed up the process and these two assumptions may compensate each other.
6. CONCLUSIONS
A model developed based on the mechanism observed for the formation of steps in the laboratory and in the field is shown to be capable of generating the lengths of the steps, the speed of the leader and the spatial variation of the leader as a function of prospective return stroke current. Both the step length and the average speed increases with increasing prospective return stroke current. The model also predict that the stepped leader speed will increase as it approaches the ground. The results depends on the streamer speeds and streamer potential gradients assumed in the model. The best results are obtained when the streamer gradient is 2 x 10⁶ V/m and the streamer speed is about 106 m/s. Under these assumptions the model predicts that a stepped leader with a 30 kA prospective return stroke current may produce steps of about 15 m in length close to ground and the average speed of propagation of about 5 x 10⁵ m/s. The ranges of step lengths, step times and leader speeds obtained from the stepped leader model developed in this paper agree reasonably well the average speed and the step length observed in experimental investigations.
7. REFERENCES
[1] Schonland, B. F. J., D. J. Malan, and H. Collens (1935), Progressive lightning II, Proc. R. Soc. London, Ser. A, 152, 595–625,
doi:10.1098/ rspa.1935.0210.
[2] Berger, I. (1967), Novel observations on lightning discharges: Results of research on Mount San Salvatore, J. Franklin
Inst., 283, 478–525, doi:10.1016/0016-0032(67)90598-4.
[3] Biagi, C. J., M. A. Uman, J. D. Hill, D. M. Jordan, V. A. Rakov, and J. Dwyer (2010), Observations of stepping mechanisms in
a rocketand‐ wire triggered lightning flash, J. Geophys. Res., 115, D23215, doi:10.1029/2010JD014616.
[4] Hill, J.. D., M.. A. UMAN, and D.. M. JORDAN, High-speed video observations of a lightning stepped leader", Journal of
Geophysical Research-atmospheres, vol. 116, pp. D16117, aug, 2011.
[5] Les Renardières Group 1978 Negative discharges in long air gaps at les Renardieres. Electra WG N 33.01.
[6] Castellani A., Bondiou A, Lalande P, Bonamy A and Gallimberti I, 1998, Laboratory study of the bi-leader process from
[7] Bacchiega G, Gazzani A, Bernardi M, Gallimberti I and Bondiou A 1994 Theoretical modelling of the laboratory negative
stepped leader, Proceedings of the 1994 International Aerospace and Ground Conference on Lightning and Static
Electricity, Mannheim, Germany.
[8] Lalande P, Bondiou-Clergerie A, Bacchiega G and Gallimberti I. 2002 Observations and modeling of lightning leaders. C
R Physique 3 1375 - 92.
[9] Mazur V, Ruhnke L, Boundiou-Clergerie and Lalande P, 2000, Computer simulation of a downward negative stepped
leader and its interaction with ground structures. Journal of Geophysical Research, Vol 105, No. D17, page 361 – 369.
September.
[10] Arevalo, L. and V. Cooray, Preliminary study on the modelling of negative leader discharges, J. of Physics D: Applied
Physics, 44(31, pp. 315204, 2011.
[11] Beroual A, Rakotonandrasana J, Fofana I 2010 Predictive dynamic model of the negative lightning discharge based on
the similarity with long laboratory sparks. Part 1: physical process and modeling. IEEE Transactions on Dielectrics and
Electrical Insulation Vol 17, N 5, 1551 – 1561, October.
[12] Dellera, L and Garbagnati, E, 1990, Lightning stroke simulation by means of the leader progression model. Part I:
Description of the model and evaluation of free-standing structures, IEEE Transaction on Power Delivery, PWRD-5. Issue 4
pp. 2009-22.
[13] Rizk F, 1994, Modeling of lightning incidence to tall structures. Part I: Theory, IEEE Trans. Power Delivery, PWRD-9,
Number 1 pp. 162–171.
[14] Becerra, M. and V. Cooray, 2006, A self consistent upward leader propagation model, J. Phys.D: Appl. Phys. 39, pp.
3708-3715.
[15] Kochkin, P., N. Lehtinen, A. P. J. van Deursen and N. Østgaard, Pilot system development in metre-scale laboratory
discharge, J. Phys. D: Appl. Phys. 49 (2016) 425203 (10pp)
[16] Cooray, V., V. Rakov, N. Theethayi, The lightning striking distance –revisited, J. Electrostatics, Vol. 65, 5-6, pp. 296–
306, 2007.
[17] Gallimberti I 1979 The mechanism of long spark formation, Journal de Physique Colloque C7, Suppl. 7, Volume 40, pp.
193-249.
[19] Chen, M., N. Takagi, T. Watanabe, D. Wang, Z.‐I. Kawasaki, and X. Liu (1999), Spatial and temporal properties of
optical radiation produced by stepped leaders, J. Geophys. Res., 104, 27,573–27,584, doi:10.1029/ 1999JD900846.
[20] Krider, E. P. (1974), The relative light intensity produced by a lightning stepped leader, J. Geophys. Res., 79, 4542–
4544, doi:10.1029/ JC079i030p04542.
[21] Lu, W., D. Wang, N. Takagi, V. Rakov, M. Uman, and M. Miki (2008), Characteristics of the optical pulses associated
with a downward branched stepped leader, J. Geophys. Res., 113, D21206, doi:10.1029/ 2008JD010231.
[22] Orville, R. E., and V. P. Idone (1982), Lightning leader characteristics in the Thunderstorm Research International
Program (TRIP), J. Geophys. Res., 87, 11,177–11,192, doi:10.1029/JC087iC13p11177.
[23] Cooray, V., and S. Lundquist (1985), Characteristics of the radiation fields from lightning in Sri Lanka in the tropics, J.
Geophys. Res., 90, 6099–6109, doi:10.1029/JD090iD04p06099.
[24] Leandro Z. S. Campos, L. Z. S., M. M. F. Saba, T. A. Warner, O. Pinto Jr., E. P. Krider, and R. E. Orville, High speed video
observations of natural cloud to-ground lightning leaders-A statistical analysis, Atmospheric Research, 135-136, 285-305,
2014.