Concentration Effects of Silver Ions on Ionic Conductivities of Molten
Silver Halides
S. Tahara1, 2, S. Ohno1, T. Okada3, Y. Kawakita4, and S. Takeda2
1Faculty of Pharmacy, Niigata University of Pharmacy and Applied Life Sciences, 265-1 Higashijima, Akiha-ku, Niigata 956-8603, Japan
2Department of Physics, Faculty of Sciences, Kyushu University, 6-10-1 Hakozaki, Higashi-ku, Fukuoka 812-8581, Japan 3Niigata College of Technology, Kamishin’ei-cho, Nishi-ku, Niigata 950-2076, Japan
4Japan Atomic Energy Agency, 2-4 Shirakata Shirane, Tokai-mura, Naka-gun, Ibaraki 319-1195, Japan
Abstract.Ionic conductivities of molten (RbX)c(AgX)1-c (X = Cl and I) mixtures were measured to clarify the
concentration effects of silver ions on ionic conductivities of molten silver halides. It is found that the addition of RbX to molten AgX rapidly reduces the ionic conductivity with 0 ≤ c≤ 0.4. It suggests that strong Ag-Ag correlation is necessary to fast conduction of Ag ions in molten state. The absolute values of ionic conductivity for (RbCl)c(AgCl)1-c are larger than those for (RbI)c(AgI)1-c mixtures at all compositions. These differences
might relate to difference of diffusion constant between Cl- and I- and difference of effective charge carried by
an ion between molten AgCl and AgI.
1 Introduction
Ionic conductivities, σ, of silver halides at solid and molten phases have been reported by many earlier works [1-11]. It is well known that σ of superionic α-AgI (high temperature solid phase of AgI) is as large as that of molten salts, while σ of crystal AgBr and AgCl under the atmospheric pressure are small even at high temperature [10, 11]. Above the melting point, these silver halides show larger σ than typical alkali halides [12]. Taking into account of the fact that Ag diffusion constants are more than twice as large as those of anions, fast diffusion of Ag ions even in molten phase causes high ionic conductivity [13-15]. Such a feature is very interesting, because Ag is heavy compared with alkali metals.
In our previous papers on structure of molten silver halides by high-energy x-ray diffraction, neutron diffraction and structural modelling by Reverse Monte Calro modelling [16-18], revealed that Ag distribution of molten AgI has large fluctuations where one-dimensional streams consisting of several Ag ions are formed. These results correspond to Ag-Ag partial pair distribution functions (pdf). The first peak of Ag-Ag pdf of molten AgI shows penetration into the first coordination shell of Ag-I pdf, and a similar penetration is also reported by results of ab-initio molecular dynamics (MD) simulation [19]. It might suggest collective motions of Ag ions. On the other hand, Ag distribution of molten AgCl shows relatively a uniform-like feature [16-17]. However, it is still quite different from cation distribution of molten
alkali halides in an extremely flat structure of the Ag-Ag pdf [20]. An empirical MD simulation using the polarizable ion model based on Vashishta-Rahman potential reasonably reproduced the flat structure of Ag-Ag pdf [13]. This structure-less of Ag-Ag-Ag-Ag pdf implies that correlations between Ag ions in molten AgCl might be weak like gas. The differences in Ag distribution between AgI and AgCl originate from effective charge carried by an ion and covalency of bonding between Ag and halogens. Much drastic changes of structure and transport properties are expected by varying Ag concentration. It is consider that Ag concentration variation is virtually possible by mixing Ag halides with alkali halides.
In this study, ionic conductivity of molten (RbI)c(AgI)1-c and (RbCl)c(AgCl)1-c mixtures which have eutectic concentration at c = 0.3 and 0.4 [21-23], respectively, were measured. The (RbI)c(AgI)1-c mixtures has stoichiometric compound RbAg4I5 which shows the superionic phase even at room temperature [23-27], and its structure factor at molten phase has the largest scale of medium-range order in the molten (RbI)c(AgI)1-c system [28]. We have two motivations in this study. First, whether dose the weakening of the strong Ag-Ag correlation of molten AgI with decreasing Ag concentration affect ionic transport, or not? Second, are there differences between molten (RbI)c(AgI)1-c and (RbCl)c(AgCl)1-c mixtures according to the difference in Ag distribution between AgI and AgCl?
© Owned by the authors, published by EDP Sciences, 2011
2 Experimental procedure
Samples of (RbI)c(AgI)1-c(c = 0, 0.1, 0.2, 0.3, 0.4, 0.667, 1) and (RbCl)c(AgCl)1-c (c = 0, 0.1, 0.2, 0.4, 0.667, 1) mixtures were prepared by mixing powder materials of AgI and RbI, or AgCl and RbCl in sealed quartz tube. Ionic conductivity measurements were performed by four-probes method using 3532-80 Chemical Impedance Meter (HIOKI E. E. Corporation) under a cooling process. A sample was put into quartz cell with 4 mm inner diameter where four small tapered holes are located with each 28 mm interval to insert carbon electrodes [29]. The carbon electrodes were fastened by nickel bands to prevent a leak of liquid sample. Each nickel band has a lead wire made of molybdenum to connect each electrode to 3532-80 Chemical Impedance Meter (HIOKI E. E. Corporation). Current was supplied to outside two electrodes, and voltage was measured at inside two electrodes. Cell constant was determined by using a standard aqueous solution of potassium chloride (76.5829 g-KCl/kg-H2O). The measurements were carried out under an argon atmosphere to prevent oxidation of molybdenum wires and vaporization of samples. Bubbles forming in a liquid sample during the measurements were removed as possible as we can by stirring it with a silica rod. The temperature was measured by using four chromel-alumel thermocouples immediately above the electrodes.
3
Experimental results
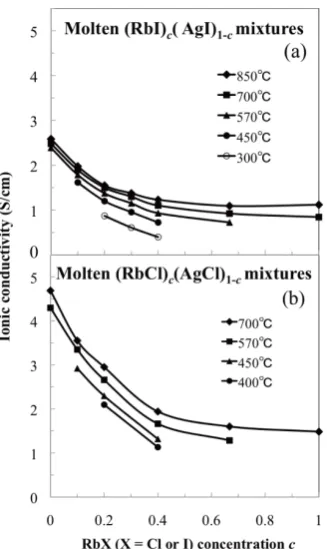
Figure 1 shows temperature dependences of σ of molten (a) (RbI)c(AgI)1-c and (b) (RbCl)c(AgCl)1-c mixtures, respectively. We confirmed that the present ionic conductivities of molten AgCl, AgI, RbCl and RbI are in good agreement with those of earlier works [1-9, 30-31]. The increase of σ of AgI at a phase transition from molten phase to the superionic α-phase, is also reported by earlier works [3-5, 7]. This increase of σ relates to higher Ag conductivities in the superionic phase than those in molten phase at immediately around Tm. From experimental and theoretical studies on a self-diffusion constant of Ag, DAg, of AgI beyond the transition point from α-phase to molten phase, DAg in molten phase shows smaller value than that in superionic phase at around Tm [32-34]. The addition of RbI into molten AgI reduces σ in the RbI concentration region less than 0.667. The σ of molten (RbI)0.667(AgI)0.333 described by open squares in figure 1(a) follows the same line of σ of molten RbI described by open circles. Temperature coefficients of ionic conductivity, dσ/dT, are positive at all compositions of molten (RbI)c(AgI)1-c. The slope of σ becomes gradually large with increasing RbI concentration. Focusing on near the eutectic composition, the slope varies with temperatures. The dσ/dT of molten (RbI)0.3(AgI)0.7 is comparatively large at a low temperature and becomes small in a high-temperature region.
Fig. 1. Temperature dependences of ionic conductivity, σ, of molten (a) (RbI)c(AgI)1-c and (b) (RbCl)c(AgCl)1-c mixtures, respectively. Arrows exhibit melting points of these materials reported by thermodynamic investigations [21-23].
Fig. 2. Concentration dependence of ionic conductivity of molten (a) (RbI)c(AgI)1-c and (b) (RbI)c(AgI)1-c mixtures,
The σ of RbI-AgI mixtures below Tm might receive some influence of Ag conduction of α-RbAg4I5 and α -AgI. σ of molten (RbCl)c(AgCl)1-c shows similar temperature and concentration dependence as molten (RbI)c(AgI)1-c except of a little higher conductivity of
AgCl and rapidly decrease of σ by solidification. Although a gradual increase of the slope by adding RbCl is not observed, the ratio of temperature coefficient to the |σ| of molten AgCl is still smaller than that of molten RbCl.
The concentration dependence of σ of molten (RbI)c(AgI)1-c and (RbCl)c(AgCl)1-c mixtures are shown
in Figs. 2(a) and 2(b), respectively. The σ rapidly decreases with increasing concentration of RbX from c = 0 to 0.4, and then the σ becomes almost constant at 0.4 ≤
c ≤ 1. These features are reported for molten KI-AgI, KCl-AgCl systems, and so on [6]. The decrease of σ with increasing concentration of AgX, becomes more rapid as temperature decrease for molten (RbI)c(AgI)1-c, which is associated with small temperature dependence of σ for molten AgI.
4 Discussion
The ionic conductivity is generally written by an Arrhenius expression
σT = Aexp(-Ea / kBT) (1) where Ea, A, and kB are the activation energy, the pre-exponential factor, and the Boltzmann constant, respectively [35-37]. In general, Ea is estimated by fitting a linear function to the Arrhenius plot (ln[σT] vs. 1/T). The Arrhenius plot of molten (RbI)c(AgI)1-c mixtures is
shown in figure 3.
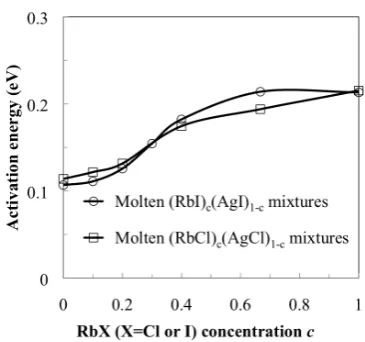
Figure 4 shows the concentration dependence of activation energy, Ea, which is estimated by fitting a linear function to Arrhenius plot within the measured temperature region of each composition. The estimated Ea of molten AgI, AgCl, RbI, and RbCl are 0.107, 0.114,
0.213, and 0.215 eV, respectively. Ea of molten AgX are smaller than that of molten RbX, which is consistent with the fact that the diffusion constant of Ag ions in molten AgX is higher than that of Rb in molten RbX[13, 15, 38]. TheEa increases in the concentration region from c = 0.2 to 0.4 where the melting point exhibits minimum. The Ea of molten AgI is slightly small compared with that of molten AgCl. It is in good agreement with earlier work [8].
To compare the ionic transport properties between (RbI)c(AgI)1-c and (RbCl)c(AgCl)1-c precisely, the
conductance per 1 mole-cubic which includes 1 mole molecules, σmol, was deduced to normalize by carrier density. σmol was estimated by
σmol = σ · (S/L) = σ·V 1/3 =
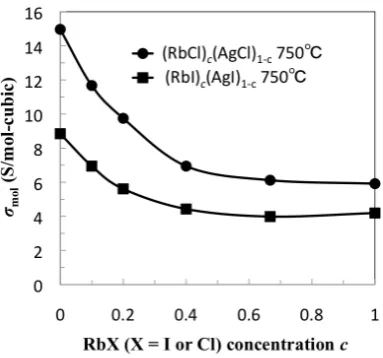
σ· (NA /ρ)1/3 (2) where V is the molar volume of materials. L and S are the side length of the 1 mole-cubic (L = V1/3) and the side area of the cubic (S = L2 = V2/3), respectively. NA and ρ are the Avogadro constant and the number density of molecules, respectively. Estimated σmol for molten (RbX)c(AgX)1-c mixtures at 750ºC are shown in the figure
5. ρ of molten (RbX)c(AgX)1-c (c = 0.1 ~ 0.667) mixtures
was estimated from linear combination of molar volume between AgXand RbX [12].
The σmol for molten (RbI)c(AgI)1-c mixtures decreases rapidly with increasing RbI with 0 ≤ c ≤ 0.4, and then settles to be almost constant with 0.4 ≤c≤ 1. Taking into account of the fast collective migrations of Ag in molten AgI, the collective motion of Ag rapidly decreases with increasing RbI concentration. Since such collective dynamics is ruled by the second power of the number density or higher order of the power, the rapid decrease of σmol by adding RbI supports reasonably this dynamical model suggested from the static structural model. On the other hand, it is surprising that the concentration dependence for molten (RbCl)c(AgCl)1-c shows a similar
tendency with that for molten (RbI)c(AgI)1-c. It suggests
that the diffusion of Ag ions in molten AgCl is also
Fig. 3. Arrhenius plot of molten (RbI)c(AgI)1-c mixtures. Fig. 4. Concentration dependence of activation energy for
molten (RbI)c(AgI)1-c and (RbI)c(AgI)1-c mixtures obtained by
regulated by many-body effect, inspite of flat and therefore weak correlations of Ag-Ag partial pdf.
The absolute values of σmol for molten (RbCl)c(AgCl)1-c
mixtures are higher than that for molten (RbI)c(AgI)1-c
mixtures at all compositions.
€
σmol RbCl /
€
σmol
RbI is 1.41. Taking
into account of fully ionic properties for RbCl and RbI and almost the same activation energies of σ of RbCl and RbI, the difference in σmol between molten RbCl and molten RbI may originate from the difference in diffusion constant between Cl- and I- ions. In fact MD predicts that the diffusion of Cl- ion in molten RbCl is much higher than that of I- ion in molten RbI (5.2 x 10⁻⁵ cm2/s for Cl -and 3.5 x 10⁻⁵ cm2/s for I-) [38]. In Ag-rich concentration region, one can recognize an additional increase of σmol for molten (RbCl)c(AgCl)1-c system. This may be
attributed by difference in an effective charge carried by an ion between AgCl and AgI. MD simulations predict the effective charges as 0.68 and 0.58 for molten AgCl and AgI, respectively [13,15]. Many-body effect of molten AgCl might be related to a mechanism to reduce carrying charge from ±1 to ±0.68. To avoid repulsive interactions by high density of Ag ions, carrying charge may be reduced through a covalent property of Ag-Cl bonding character which may also cause polarizable property of Cl ions. Structural investigation of molten (RbCl)c(AgCl)1-c and (RbI)c(AgI)1-c mixtures, especially
reduction of Ag-Ag partial correlations is indispensable to complete full discussion on transport properties in relation with unusual flat Ag-Ag pdf of molten AgCl and anomalous Ag migration in molten AgI. We have already measured the structure of molten (RbI)c(AgI)1-c mixtures
[28] and we plan to measure the structure of molten (RbCl)c(AgCl)1-c mixtures. We will discuss the relation
between transport properties and the partial structures in a near future.
5 Conclusion
The σ for molten (RbX)c(AgX)1-c (X = Cl and I) mixtures were measured as a function of temperature and
concentration. The addition of RbI into molten AgI reduces σ in the RbI concentration region less than 0.667. This tendency suggests that the weakening of strong Ag-Ag correlation of molten Ag-AgI affects ionic transport with 0 ≤ c ≤ 0.4. It is interesting that similar tendency of concentration dependence was also seen for (RbCl)c(AgCl)1-c mixtures. It suggests that the diffusion of Ag ions in molten AgCl is also regulated by many-body effect, inspite of weak Ag-Ag partial correlations. The concentration dependence of σmol which was normalized by carrier density for molten (RbCl)c(AgCl)1-c was larger than that of (RbI)c(AgI)1- c at all compositions. One origin of differences of σmol between (RbCl)c(AgCl)1-c and (RbI)c(AgI)1- c would be differences of diffusion constants between Cl- and I- ions. In addition, differences of an effective charge carried by an Ag ion in molten AgCl and AgI also may contribute to the differences of σmol between (RbCl)c(AgCl)1-c and (RbI)c(AgI)1- c.
Acknowledgement
The authors thank to the students (Mr. Y. Yamamoto, Ms. M. Kondo, Mr. Y. Seno, and Mr. K. Musha) of the laboratory of Physics in Niigata University of Pharmacy and Applied Life Sciences for supports of the experiment.
References
1. H. Bloom and E. Heymann, Proc. R. Soc. Lond. A11 392 (1947)
2. M. C. Bell and S. N. Flengas, J. Electrochemical soc. 111 575 (1964)
3. A. Kvist and A. M. Josefson Z. Naturforsch. 23a 625 (1968)
4. H. G. Damle and S. S. Katti Indian, J. Chem. 16A 679 (1978)
5. H. G. Damle and S. S. Katti Indian, J. Chem. 19A 896 (1980)
6. H. P. Boßmann, A. Hildebrandt, and J. Richter, Z. Naturforsch. 41a 1129 (1986)
7. A. Wojakowska, E. Kundys, J. Josiak, J. Materials science 31 2425 (1996)
8. K. Ishida, S. Ohno, T. Okada, J. Non-Crystaline solids, 250-252 488 (1999)
9. A. Chandra, A. Spangenberg, and J. Maier, J. Electroceramics 3 47 (1999)
10. K. Shahi, and J. B. Wagner Jr., J. Phys. and Chem. of Solids 43 713 (1982)
11. M. E. V. Hulle, W. M.-V. D. Vorst, Physica status solidi (a) 40 K173 (2004)
12. G. J. Janz, Molten salts handbook (Academic Press in New York, NY 1967)
13. J. Trullàs, O. Alcaraz, L. E. González, and M. Silbert, J. Phys. Chem. B 107 282 (2003)
14. V. Bitrian, J. Trullàs, J. Phys. Chem. B 110 7490 (2006)
15. V. Bitrian, J. Trullàs, J. Phys. Chem. B 112 1718 (2008)
Fig. 5. Concentration dependence of σmol for molten
(RbX)c(AgX)1-c (X = Cl or I) mixtures. σmol was estimated by
16. S. Tahara, H. Fujii, Y. Kawakita, S. Kohara, Y. Yokota, and S. Takeda, J. Non-cryst. Solids 353 1994 (2007)
17. Y. Kawakita, S. Tahara, H. Fujii, S. Kohara, and S. Takeda, J. Phys. :Condens. Matter 19 335201 (2007) 18. H. Ueno, S. Tahara, Y. Kawakita, S. Kohara, and S.
Takeda, Neuclear Instruments and Methods in Physics Research A 600 322 (2009)
19. F. Shimojo, T. Inoue, M. Aniya, T. Sugahara, and Y. Miyata, J Phys. Soc. Jpn 75 114602 (2006)
20. P. Ballone, G. Pastore, and M. P. Tosi, J. Phys. C : Solid State Phys. 17 L333 (1984)
21. R. Baboian and S. N. Flengas Canadian J. Chem. 45 813 (1967)
22. C. Sandonini and P. C. Aureggi Atti Accad. Nazl. Lincei, II 20 588 (1911)
23. J. N. Bradley and P. D. Greene: Transactions of the Faraday Society. 63 424 (1967)
24. B. B. Owens and G. R. Argue: Science 157 308 (1967)
25. S. Geller: Science 157 310 (1967)
26. T. Sakuma, T. Aoyama and H. Takahashi: Solid State Ionics 79 71 (1995)
27. S. Hull, D. A. Keen, D. S. Sivia and P. Berastegui: J. Solid State Chem. 165 363 (2002)
28. S. Tahara, H. Ueno, K. Ohara, Y. Kawakita, S. Takeda, S. Kohara, and S. Ohno, J. Phys. Soc. Jpn 79 Suppl. A 133 (2010)
29. S.Ohno, A. C. Barnes, J. E. Enderby, J. Phys.: Condens. Matter 8 3785 (1996)
30. W. Biltz and W. Klemm, Z. Physik. Chem. 110 318 (1924)
31. I. S. Yaffe and E. R. V. Artsdalen, J. Phys. Chem. 60 1125 (1956)
32. C. Tubandt and E. Lorentz: Z. Phys. Chem. 87 513 (1914)
33. H. Arai, T. Koishi and S. Tamaki J. Phys. Soc. Jpn 68 134 (1999)
34. S. Tamaki, T. Koishi and Y. Arai: High Temp. Mater. & Process 18 55 (1999)
35. M. Kobayashi, Physics of Solid State Ionics 2006 1-15
36. Y-W. Hu, I. D. Roistrick, and R. A. Fuggins, Electrochem. Soc. 124 1240 (1977)
37. A. Wojakowska, E. Krzyzak Solid State Ionics 176
2711 (2005)