Available Online at www.ijcsmc.com
International Journal of Computer Science and Mobile Computing
A Monthly Journal of Computer Science and Information Technology
ISSN 2320–088X
IJCSMC, Vol. 3, Issue. 2, February 2014, pg.606 – 616
RESEARCH ARTICLE
APPLICATION OF STATISTICAL
MODELS TO THE COLLABORATIVE
PUBLICATIONS IN BIOINFORMATICS
Dr. N. Amsaveni,
Assistant Professor, Dept. of Library and information Science, Bharathidasan University, Trichirappalli – 24. [email protected]M. Manjula
, Research Scholar, Dept. of Library and information Science, Bharathidasan University, Trichirappalli – 24. [email protected]ABSTRACT
This article deals with the growth and proportion of different types of co-authored publications in Bioinformatics. This study also explores the applicability of appropriate statistical model to the deterioration in the proportion of single-authored publication with during sample periods. Also studies the applicability of selected statistical models to the distribution of authorship in publications of bioinformatics during 1999 to 2013.
Keywords: Collaboration; Publications; Statistical models; Bioinformatics, authorship pattern
1. INTRODUCTION
growth rate of collaborative publications observed in subject disciplines are probably related to changes in the acknowledgement of teamwork, as an accepted practice in collaboration that simultaneously effect changes in the support of S&T.
2. OBJECTIVES
The main objectives of this study are:
(a) To study the growth in the number and proportion of collaborative publications in the field of Bioinformatics research with time;
(b) To study the applicability of a suitable mathematical model in the decline of the proportion of single-authored publications with time; and
(c) To study the applicability of selected probability distributions to the distribution of authorship with time for publications in the field of Bioinformatics.
3. DATABASE AND METHODOLOGY
The present study covers publication from 1999 to 2013. For studying the growth in the number and proportion of multi-authored publications in the field of theoretical population genetics, the entire data from the bibliography was used. This consists of 17318 publications, of which 15716 (90.23 %) of articles were produced by multi-authored. Bioinformatics research articles were downloaded from the database of Web of Science during the period 1999 to 2013, it includes the databases of SCI (Science Citation Index), SSCI (Social Science Citation Index) and AHCI (Arts and Humanities Citation Index)). The search key term has „bioinformatics‟ has been used for the purpose of collection of data, required for the study. It covers different types of publications in the discipline of Bioinformatics during the sample periods. Further, the data was tabulated using by the software‟s of Histcite, VOS viewer and MS-Excel and further analyzed for the purpose of interpretation and discussion.
4. DISCUSSION AND RESULTS
4.1 Overall Collaboration Profile in Theoretical Population Genetics
(a) Proportion of Collaborated Publications
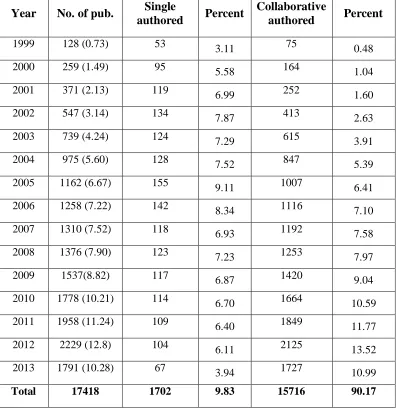
The growth in the number of total publications and collaborative publications have considered shown a consistent increasing trend with time since 1999. However, the proportion of collaborative publications in total publications has shown a reliable growth with slight fluctuations in certain periods.
(b) The proportion of multi-authored publications has increased from 0.48 percent during 1999 to 13.52 percent during 2012. Multi-authored contribution shows in continuous increasing trend.
Table 1: Total Publications and Collaborative Publications between 1999-2013
Year No. of pub. Single
authored Percent
Collaborative
authored Percent
1999 128 (0.73) 53 3.11 75 0.48
2000 259 (1.49) 95 5.58 164 1.04
2001 371 (2.13) 119 6.99 252 1.60
2002 547 (3.14) 134 7.87 413 2.63
2003 739 (4.24) 124 7.29 615 3.91
2004 975 (5.60) 128 7.52 847 5.39
2005 1162 (6.67) 155 9.11 1007 6.41
2006 1258 (7.22) 142 8.34 1116 7.10
2007 1310 (7.52) 118 6.93 1192 7.58
2008 1376 (7.90) 123 7.23 1253 7.97
2009 1537(8.82) 117 6.87 1420 9.04
2010 1778 (10.21) 114 6.70 1664 10.59
2011 1958 (11.24) 109 6.40 1849 11.77
2012 2229 (12.8) 104 6.11 2125 13.52
2013 1791 (10.28) 67 3.94 1727 10.99
Total 17418 1702 9.83 15716 90.17
4.2 Quantification of Publications by Number of Authors
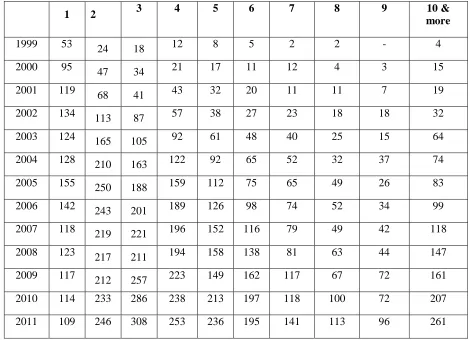
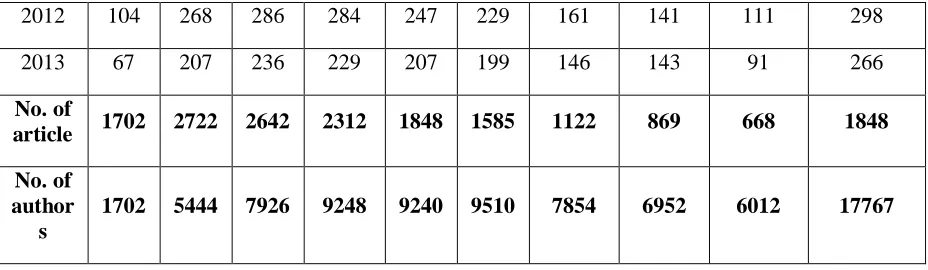
systematic increase is observed in all the categories of co-authored publications, although with different growth rates as described below:
5444 two-authored publications were 2722; followed by 7926 three authors team has published at 2642 articles; 9248 four authors team has published at 2312 articles; 9240 five authors team has published at 1848 articles; 9510 six authors team has published at 1585 articles; 7854 seven authors team has published at 1122 articles; 6952 eight authors team has published at 869 articles; 6012 nine authors team has published at 668 articles; 4640 ten authors team has published at 464 articles and 23127 more than ten authors team has published at 1384 articles for the entire period respectively. The below table 2 reveals that the maximum number of papers was two authored (15.72 %) when compared to three authored (15.26 %.); four authored (13.35 %); five authored (10.67 %); single authored (9.83 %); six authored (9.15 %) respectively. Followed by seven authored (6.48 %) and eight authored to more than ten authored teams‟ contributions are below 5 percent. Six authors team has been in highest number of contributors. Thus, this analysis indicating that very clearly the increased trend towards on multi-authored productivity in the field of Bioinformatics.
Table 2: Publications classified by number of authors in Bioinformatics research during 1999 – 2013
1 2 3 4 5 6 7 8 9 10 &
more
1999 53 24 18 12 8 5 2 2 - 4
2000 95 47 34 21 17 11 12 4 3 15
2001 119 68 41 43 32 20 11 11 7 19
2002 134 113 87 57 38 27 23 18 18 32
2003 124 165 105 92 61 48 40 25 15 64
2004 128 210 163 122 92 65 52 32 37 74
2005 155 250 188 159 112 75 65 49 26 83
2006 142 243 201 189 126 98 74 52 34 99
2007 118 219 221 196 152 116 79 49 42 118
2008 123 217 211 194 158 138 81 63 44 147
2009 117 212 257 223 149 162 117 67 72 161
2010 114 233 286 238 213 197 118 100 72 207
2012 104 268 286 284 247 229 161 141 111 298
2013 67 207 236 229 207 199 146 143 91 266
No. of
article 1702 2722 2642 2312 1848 1585 1122 869 668 1848
No. of author
s
1702 5444 7926 9248 9240 9510 7854 6952 6012 17767
To obtain a representation of the relative growth of single-authored and multi-authored publications, data on co-authored publications was analyzed in terms of the relative frequency of publications by number of authors for different years. The relative frequency of individual types of coauthored publications by number of authors is calculated. The analysis indicates that the growth in the frequency of all types of co-authored publications by the number of authors increased in different proportion, as we move from single-authored to multi-authored publications. In single-authored publications the relative frequency has increased from 0.031 during 1999 to 0.061 during 2012, while in different types of multi-authored publications, it has increased from: 0.005 during 1999 to 0.135 during 2013 publications.
Table 3: Relative Frequency of Publications by Number of Authors during 1999 - 2013
Year
Relative frequency of publication by number of authors
Single authored
Multi
authored 2 3 4 5 6 7 8 9
10 & above
1999 0.031 0.005 0.01 0.01 0.01 0.00 0.00 0.00 0.00 0.00 0.00
2000 0.056 0.010 0.02 0.01 0.01 0.01 0.01 0.01 0.00 0.00 0.01
2001 0.069 0.016 0.02 0.02 0.02 0.02 0.01 0.01 0.01 0.01 0.01
2002 0.080 0.026 0.04 0.03 0.02 0.02 0.02 0.02 0.02 0.03 0.02
2003 0.073 0.039 0.06 0.04 0.04 0.03 0.03 0.04 0.03 0.02 0.03
2004 0.075 0.054 0.08 0.06 0.05 0.05 0.04 0.05 0.04 0.06 0.04
2005 0.091 0.064 0.09 0.07 0.07 0.06 0.05 0.06 0.06 0.04 0.04
2006 0.083 0.071 0.09 0.08 0.08 0.07 0.06 0.07 0.06 0.05 0.05
2007 0.069 0.076 0.08 0.08 0.08 0.08 0.07 0.07 0.06 0.06 0.06
2008 0.072 0.080 0.08 0.08 0.08 0.09 0.09 0.07 0.07 0.07 0.08
2010 0.067 0.160 0.09 0.11 0.10 0.12 0.12 0.11 0.12 0.11 0.11
2011 0.064 0.118 0.09 0.12 0.11 0.13 0.12 0.13 0.13 0.14 0.14
2012 0.061 0.135 0.10 0.11 0.12 0.13 0.14 0.14 0.16 0.17 0.16
2013 0.039 0.110 0.08 0.09 0.10 0.11 0.13 0.13 0.16 0.14 0.14
Total 1702 15716 2722 2642 2312 1848 1585 1122 869 668 1848
4.3 Indices of Collaboration
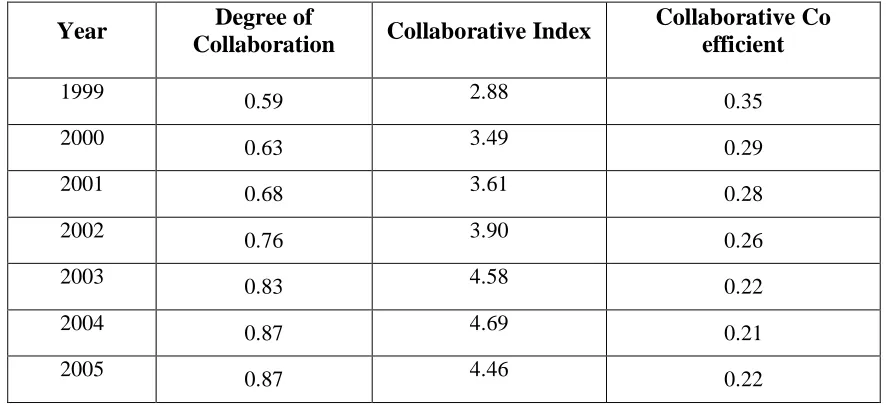
Some mathematical measures have been proposed by scholars in the past to study the extent and size of co-authorship, as reflected in publications. These measures are Degree of Collaboration (DC) first suggested by Subramanyam (1983), which takes the proportion of co-authored publications in total publications, Collaboration Index (CI), which takes the mean number of authors per publication, and Collaboration Coefficient (CC) first suggested by Ajiferuke, Burrell, and Tague (1988) that takes the proportional mean of the sum of publications and number of authors, and set the values between 0 and 1. In order to study the extent of collaboration in different period in Bioinformatics, the values of DC, CI, and CC were computed for publications and the results obtained are presented in Table 5.
As can be seen from Table 5, the mean number of authors per publication (as reflected in the value of CI) increased from 2.88 during 1999 to 6.37 during 2013. The growth in the proportion of collaborated publications and the proportional mean of the sum of the publications with each number of authors is clearly reflected in the decreasing value of CC (0.35 at 1999, while 0.16 at 2013) and the increasing value of DC (0.59 at 1999, while 0.96 at 2013)..
Table 5: Indices of Collaboration Obtained from Publications in during 1999-2013
Year Degree of
Collaboration Collaborative Index
Collaborative Co efficient
1999 0.59 2.88 0.35
2000 0.63 3.49 0.29
2001 0.68 3.61 0.28
2002 0.76 3.90 0.26
2003 0.83 4.58 0.22
2004 0.87 4.69 0.21
2006 0.89 4.61 0.22
2007 0.91 5.06 0.20
2008 0.91 5.31 0.19
2009 0.92 5.33 0.19
2010 0.94 5.56 0.18
2011 0.94 5.79 0.17
2012 0.95 5.71 0.18
2013 0.96 6.37 0.16
The trend in the computed values of CI, DC, and CC of different period blocks is almost consistent, reflecting the growing collaboration and pointing towards increasing professionalization in Bioinformatics with time.
4.4 Prolific authors
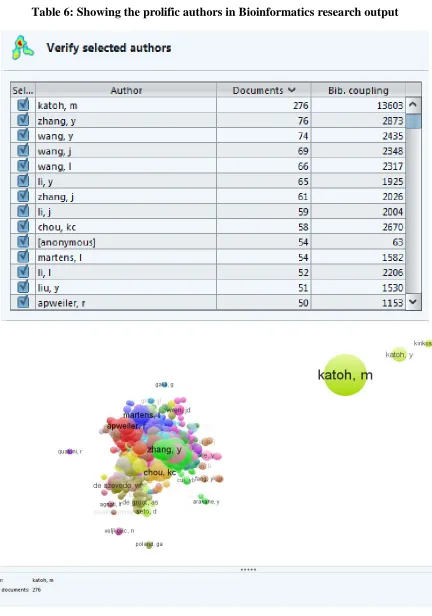
Table 6: Showing the prolific authors in Bioinformatics research output
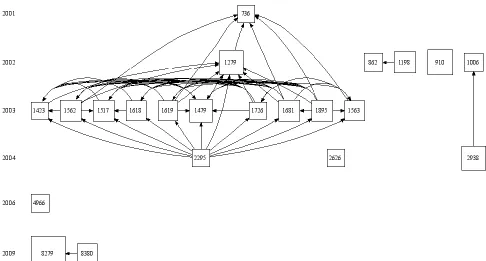
4.5 Historiography Analysis
The sample records were exported to HistCite software for data extracting to acquire a large list of 17418 articles written by 91,655 authors along with 761,464 times cited references during 1999 to 2013, and their local and global citation scores (LCS and GCS). It is found from this historiography map analysis 70 authors were contributed the selected 30 nodes out of 70 authors, only one author (Katoh, M) has contributed 24 times, four authors were participated only two times and remaining 65 authors were contributed each once in the research of bioinformatics. Totally 14 journals were been in the selected 30 nodes, among these the journal of „International Journal of Molecular Medicine‟ has mapped in nine times, followed by the journals of „International journal of oncology‟ and „Nucleic acids research‟ were produced each 4 articles; the journals of „Bioinformatics‟ and „Proceedings of the National Academy of Sciences of the united States of America‟ were produced each two articles; and the remaining nine journals were produced each one articles. The highest values of the selected 30 nodes, the Local cited reference is 40; the cited reference is 89; The Total Local Citation Scores is 281 and the Total Global Citation Scores is 5938 has measured from this analysis.
The article number of 1895th has written by the authors of “Katoh M, Katoh M” has published in the journal of “International Journal of Molecular Medicine” at the year of 2003 with 85 times cited references; 69 LCS and 110 GCS scaled and it having six links of quoted and cited. This article dominated in the value of LCR.
The article number of 1279th has written by the authors of “Katoh M” has published in the journal of “International Journal of Molecular Medicine” at the year of 2002 with 89 times cited references; 135 LCS and 146 GCS scaled and it having nine links of quoted and cited. This article dominated the highest CR value. The article number of 121st has written by the authors of “Perkins DN, Pappin DJC, Creasy DM, Cottrell JS” has published in the journal of “Electrophoresis” at the year of 99 with 33 times cited references; 281 LCS and 3978 GCS scaled and it does not have any kind of links. This article dominated the highest LCS and GCS values. The article number of 2295th has written by the authors of “Katoh M, Katoh M” has published in the journal of “International Journal of Molecular Medicine” at the year of 2004 with 48 times cited references; 71 LCS and 77 GCS scaled and it having eleven links of quoted. This article dominated in the highest number of links in whole 63.
5. CONCLUSION
The article mainly dealt with the authorship pattern and collaborations in the area of Bioinformatics research output. In the field of science and technology, the studies have conventional the increased growth of multiple authorship and collaborative research. The following facts are derived from this analysis; Katoh, M has identified most productive author; The journal of „bmc Bioinformatics‟ has highest publications; 2012 having highest publications; the form of journal type doucment produced more number of articles and 90 percent of authors were contributed at collaborative produced. The proportion and extent of collaborative publications have shown a systematic increase with time along with the growth of total number of publications in the discipline of Bioinformatics. Of the total publications, 1702 articles were appeared as single-authored publications, 2722 articles were as two-authored publications, 2642 articles were as three-authored publications, 1848 articles were as four authored publication, 1585 articles were as five authored publication and so on respectively. The single-authored publications decreased from 1999 onwards and multi-authored publications increased gradually from 1999. Two authored articles were highest compared to other types of team work, but 9510 contributors were highest among the team work author wise, they published in six authored team.
REFERENCES
1. Amsaveni, N & Vasanthi, R (2012). Mapping of Green Biotechnology Research: A Scientometric Analysis, Journal of Advances in Library and Information Science, Vol. 1. No.4. 2012. pp. 181-185.
2. Ajiferuke, I., Q. Burell and J. Tague. 1988. Collaboration coefficient: A single measure of the degree of collaboration in research. Scientometrics, Vol.14: 421-433.
3. Amsaveni. N & Vasanthi. R. (2013). Authorship Pattern and Collaborative Research in the Field of Network Security. Indian Journal of Applied Research..3 (1): 52-54.
4. Beaver, D. De B. and R. Rosen. 1979. Studies in scientific collaboration 3.Professionalisation and the natural history of co-authorship. Scientometrics,Vol.1: 231-245.
5. Clark, B. 1964. Multiple authorship trends in scientific papers. Science, Vol.143:820-824. 6. Gupta, B.M., S. Kumar, S. and R. Rousseau. 1998. Applicability of selected probability distributions to the number of authors per article in theoretical population genetics. Scientometrics, Vol. 42: 325-333.