Constraining Dark Matter and Ultra-High Energy Cosmic Ray
Sources with Fermi-LAT Diffuse Gamma Ray Background
OlegKalashev1,
1Institute for Nuclear Research of the Russian Academy of Sciences, Moscow 117312, Russia
Abstract.We use the recent measurement of the isotropicγ–ray background (IGRB) by
Fermi LAT and analysis of the contribution of unresolved pointγ–ray sources to IGRB
to build constraints on the models of ultra-high cosmic rays (UHECR) origin. We also
calculate the minimal expected diffuseγ–ray flux produced by UHECR interactions with
an interstellar photon background. Finally, for the subclass of dark matter (DM) models with decaying weakly interacting massive particles (WIMP), we build constraints on the particle decay time using minimal expected contributions to the IGRB from unresolved
pointγ–ray sources and UHECR.
1 Introduction
The Fermi LAT Collaboration [1] has presented their measurement of the IGRB within an unprece-dentedly wide energy range up to 820 GeV based on 50 months of observations at Galactic latitude (b)|b| > 20. The IGRB spectrum can be well described over nearly four decades in energy by a power law with exponential cut-off, having a spectral index of 2.3 and a break energy of about 0.3 TeV. The origin of IGRB is not fully understood. However, it has been demonstrated recently [2] that unresolved pointγ–ray sources, such as Active Galactic Nuclei or Star Forming Galaxies may account for up to 100% of IGRB flux and at least 86% of integral isotropic flux above 50 GeV. This leaves little space for other possible contributions, such as the electromagnetic cascades produced by UHECR interactions and products of Dark Matter (DM) decay (or annihilation). UHECR existence has been confirmed experimentally and therefore the guaranteed minimal contribution to the IGRB from UHECR must exist. On the contrary, the DM-originated flux ofγ–rays is strongly model depen-dent and not limited from below. In this work, we discuss both mechanisms in detail. We start from building constraints imposed by the IGRB measurement on UHECR source models in section 2 and calculate minimal expected cascadeγ–ray flux, originated from UHECR interactions with the inter-stellar photon background. In section 3, we consider decaying WIMP DM models and use the IGRB spectrum along with minimal contributions to isotropicγ–ray flux from UHECR and unresolved point sources to build conservative constraints on WIMP decay time, assuming various decay channels. In-direct DM detection methods and their connection to the IGRB have been studied in a number of works (for recent review see [3]), as well as constraints on UHECR origin models (see e.g. [4] and references therein). To our knowledge however, no study of DM models has been performed taking into account all guaranteed contributions to the IGRB.
2 UHECR and diffuse
γ
–ray background
Despite the impressive progress in the UHECR experimental study, the chemical composition of cos-mic rays at highest energy is still a subject of debate. All modern coscos-mic ray experiments extract information on the UHECR spectrum and composition from observations of extensive air showers (EAS), initiated by cosmic ray particles. The method involves simulation of EAS development and suffers from unavoidable systematic uncertainties of primary particle energy determination at a level of 15−20% and even larger uncertainties in UHECR composition, since showers initiated by pro-tons and compound nuclei are quite similar. Pierre Auger Observatory (PAO) [5], Telescope Array (TA) [6] and HiRes [7] observe light element composition in the energy range 1−4EeV, however PAO reports transfer to heavier composition at higher energies, while TA and HiRes data is compatible with pure proton composition above 1EeV. Observation of accompanying flux of secondary particles from UHECR interactions in intergalactic space can serve as an independent method of the UHECR com-position study. In this paper, we focus on the secondary diffuseγ–ray flux. Protons and heavier nuclei producee+e−pairs on the Cosmic Microwave Background (CMB) and infrared-ultraviolet extragalac-tic background light (EBL)
N+γcmb,ebl →e++e−+N. (1)
e±then initiate electromagnetic (EM) cascades driven by the chain of inverse Compton scattering of electrons
e±+γcmb→e±+γ, (2)
and pair production by high energy photons on the CMB and EBL
γ+γcmb,ebl→e++e− (3)
Relatively fast EM cascade development leading to energy loss and exponential growth of the num-ber of particles proceeds until photons reach the threshold energy fore+e−–pair production on EBL
Eth,γ TeV. The universe becomes essentially transparent for photons withEγ 0.1TeV. For this reason, the energy injected to the EM cascade by UHECR interactions, or by any other mechanisms is accumulated in the form of diffuseγ-radiation.
The threshold nucleus energy for the process (1) on a background photon with energyε
Eth=
me(mN+me)
ε 0.5×A ε
10−3eV −1
EeV, (4)
is roughly proportional to nucleus mass numberA. For this reason, compound nuclei are less efficient
ine±pair production. Therefore, below we focus on the UHECR source models assuming pure proton composition. We shall see below that IGRB data imposes strict constraints on this class of models.
Also, UHE protons and light nuclei may contribute to the EM cascade through the GZK mecha-nism [?]
N+γcmb→π±,0+N, (5)
via products ofπ±,0 decay, however since the GZK energy threshold for protons is about 50 times higher thane±–pair production threshold energy (4), its contribution to cascade radiation is subdomi-nant unless a very hard primary proton energy spectrum is assumed.
2.1 Conservative constraints on proton UHECR sources models
Below we use a simple phenomenological model for the UHECR source. We assume homogeneously distributed sources, emitting protons with power-law generation spectra
Qp(E,z)∝(1+z)3H(z)
E E0
−p
whereE0is an arbitrary normalization energy. Below, unless we state explicitly, we cut the injection spectrum belowEmin =0.1 EeV and aboveEmax =102.5EeV without loss of generality. Indeed the main contribution to the EM cascade comes from protons with energies in the interval from 1 EeV to a few EeV unless the injection spectrum is too flat (γg ≤2) which is forbidden anyway as it will be demonstrated below. Also note, that models withEmax >102.5 EeV don’t substantially improve UHECR fit but may overproduce secondaryν-flux. We also introduce the evolution of source lumi-nosity density with redshiftzgiven by the termH(z) in comoving volume, assuming that the source spectrum shape does not depend onz. For the evolution term we use general form
H(z)=H(0)(1+z)m for 0≤z≤zmax. (7)
We also consider two specific cases of source density proportional to the star formation rate (SFR) [8]
HSFR(z)∝ ⎧⎪⎪ ⎪⎨ ⎪⎪⎪⎩
(1+z)3.4, z≤1 (1+z)−0.3, 1<z≤4 (1+z)−3.5, z>4.
(8)
and evolution of BL Lac/FR I sources [9]. For the latter, we derived the following analytical parametri-sation
HBLLac(z)∝ (a+z)l
(b+z)kexp(−z/zc), z<6 (9)
a=0.000283;l=0.850383;b=0.7662;k=6;zc=10.006
0.1 1 10 100
1010 1012 1014 1016 1018 1020
jE
2, eV/cm 2/s/sr
E, eV
γ
p unres.γ
total γ
(a)p=2.6, BL Lac/FR I sources
0.1 1 10 100
1010 1012 1014 1016 1018 1020
jE
2, eV/cm 2/s/sr
E, eV
γ
p unres.γ
total γ
(b)p=2.44, SFR evolution
Figure 1: The energy spectra of protons (blue curve) and cascade photons (red curve) from sources emitting protons normalized on the TA spectrum [10]. Also, the Fermi IGRB measurements [1] are shown assuming minimal galactic foreground allowed by systematic uncertainty, and minimal contribution to IGRB from unresolvedγ–ray sources [2] (green curve). Total cascade+minimal unresolved source flux is shown by the black solid curve.
UHECR and electromagnetic cascade interactions with CMB and EBL (for the latter, we use the re-cent estimate [12]). Following Ref. [4], to derive conservative constraints on proton source models, we don’t require a perfect UHECR spectrum fit in terms ofχ2. Such a requirement would lead to preference for strong evolving models with a relatively hard injection spectrum. These models are strongly constrained by Fermi IGRB and by Ice Cube UHECRνflux limit [13]. Instead, for every
min the physically motivated range−1 ≤ m ≤ 7 and several values ofzmaxwe find optimal value of spectrum power indexp, providing a reasonable fit. We can do this safely for the following rea-sons. First of all, the systematic uncertainty of energy spectrum measurement is much higher than the statistical uncertainty in all present experiments. Secondly, the toy effective spectrum model (6) that we use may not precisely describe the actual picture, e.g. the actual spectrum may be different from power law or may be distorted by local sources, etc.
In Fig. 1 we show sample calculations of proton and secondary cascadeγmade assuming SFR and BL Lac/FR I evolution. One can see (Fig. 1b) that cascadeγflux, when added to the minimal expected contribution from unresolved sources, may easily exceed the IGRB flux measured by Fermi LAT.
To define the formal conservative criterion of model consistency, we use maximal true isotropic flux
Φiso
max(Eγ)≡ΦIGRBmax (Eγ)−Φastromin(Eγ),
which is calculated by subtraction of minimal unresolved source flux [2] from the maximal IGRB flux allowed by systematic galactic foreground uncertainty. We compare it with the cascadeγfluxΦcas(Ei)
in each IGRB energy biniwith statistical errorσiby constructingχ2cas:
χ2 cas≡
Φcas(Ei)>Φisomax(Ei)
(Φcas(Ei)−Φisomax(Ei))2
σ2
i
(10)
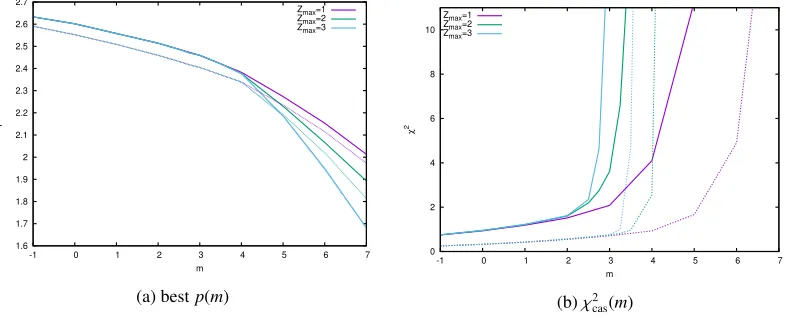
and requireχ2cas <4 orχ2cas <9 to obtain an approximate estimate of 2-σor 3-σconstraint respec-tively. The dependence ofχ2cason generic model parametersmandzmaxfor models roughly fitting TA
1.6 1.7 1.8 1.9 2 2.1 2.2 2.3 2.4 2.5 2.6 2.7
-1 0 1 2 3 4 5 6 7
p
m
Zmax=1
Zmax=2
Zmax=3
(a) bestp(m)
0 2 4 6 8 10
-1 0 1 2 3 4 5 6 7
χ
2
m Zmax=1
Zmax=2
Zmax=3
(b)χ2
cas(m)
Figure 2: Optimal model parameterp(m) (Fig. a) andχ2
cas(m) (Fig. b) obtained for models fitting unshifted (solid lines) and shifted (δE/E =−20%, dotted lines) TA energy spectrum for 3 values of
energy spectrum is illustrated by Fig. 2b. One can see that depending on the assumedzzmaxmodels withm2.5−4 tend to overproduce diffuseγ. The constraint weakens if we shift the TA energy scale by 20% towards lower energies. In this case, models withm6 are rejected forzmax ≥1. Models with stronger evolution would require even smallerzmax.
2.2 Minimal diffuseγ–ray flux from UHECR sources
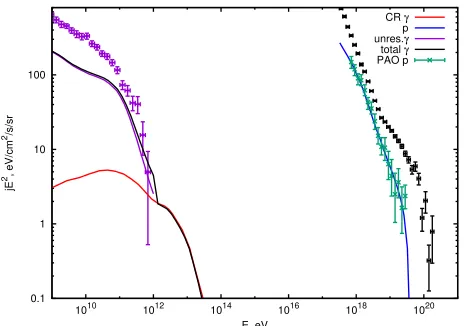
As mentioned above, PAO UHECR composition analysis indicates that at least part of UHECR events is caused by compound nuclei. In Ref. [5] the fraction of protons was estimated in the total UHECR flux measured by PAO at various energies. To make a realistic estimate of the minimal UHECR contri-bution to the diffuseγ–ray flux, we perform the fit of the proton only component of the PAO UHECR spectrum and calculate the secondaryγflux disregarding possible contribution of the heavier nuclei. Also, to minimize the cascadeγ–ray flux, we assume negative though realistic source luminosity den-sity evolution (9). The result of this calculation is presented in Fig. 3. In this case the cascadeγflux is
0.1 1 10 100
1010 1012 1014 1016 1018 1020
jE
2, eV/cm 2/s/sr
E, eV
CR γ p unres.γ total γ PAO p
Figure 3: Energy spectra of protons (blue curve) and cascade photons (red curve) from BL Lac/FR I sources emitting protons with spectrumE−2.79,E<4EeV normalized on PAO proton spectrum.
well below the IGRB level everywhere except the last energy bin, where it becomes compatible with the flux of unresolvedγsources. This result is used in the next section.
3 WIMP Dark Matter decay and diffuse
γ
–ray background
In this section, we obtain conservative constraints on WIMP dark matter decay time, based on the observations of the IGRB, taking into account the minimal contribution to the IGRB from unresolved γsources and from UHECR. We use the same method as in the previous section to derive the conser-vative constraints. Namely, we construct the quantity
χ2 DM≡
ΦDM
γ (Ei)>ΦDM
max(Ei)
(ΦDM
γ (Ei)−ΦDMmax(Ei))2
σ2
i
where the termΦDMmax(Eγ) stands for the maximal isotropic γ–ray flux, which could be attributed to dark matter:
ΦDM
max(Eγ)≡ΦIGRBmax (Eγ)−Φastromin (Eγ)−Φcasmin(Eγ)
In fact, the signal from WIMP dark matter is not expected to be isotropic since the DM particles
0.1 1 10 100 1000
1x10⁹ 1x10¹⁰ 1x10¹¹ 1x10¹²
E
2J, eV/cm 2/s/sr
E, eV
total DM extragalactic galactic ICS + bremstr prompt total
(a)μ+μ−:τ=9×1026s,M
DM=800GeV
0.1 1 10 100 1000
1x10⁹ 1x10¹⁰ 1x10¹¹ 1x10¹²
E
2J, eV/cm 2/s/sr
E, eV
total DM extragalactic galactic ICS + bremstr prompt total
(b) u¯u :τ=3×1027s,M
DM =5T eV
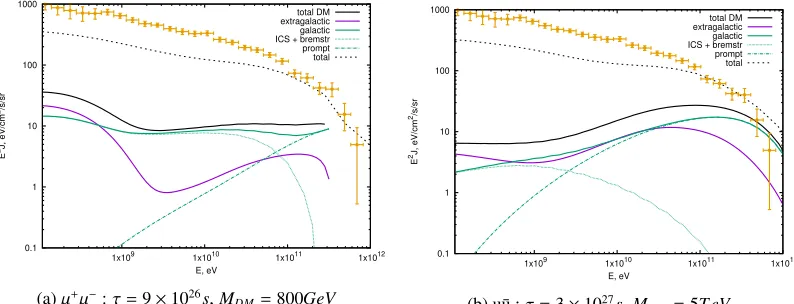
Figure 4: Sample spectra ofγ–rays from DM decay.
should be concentrated in halos. In our analysis we therefore use the minimal flux, which comes from the direction to the Milky Way anti-centre. We consider decay channels throughe, μ, τ,u,b,Wwithγ ande±final states and calculate fluxes of prompt and secondaryγfrome±interactions. It is produced by the DM in the Milky Way (MW) halo and remote galaxies (EG)
Φγ= ΦMW
γ + ΦEGγ (12)
The prompt galacticγ–ray flux from the anti-centre direction in the decay channel f with rateΓf is
given by
dΦγ
dEdΩ =
Γf
4πMDMτDM
dNγf
dE
∞
r
ρ(r)dr, (13)
whereMDMandτDMare DM particle mass and decay time andρ(r) is the DM energy density profile, for which we use the Navarro, Frenk and White parametrisation [14]. We calculate the injection spec-tradNγ,fe/dEand the flux of secondaryγ–rays from bremsstrahlung and inverse Compton scattering of electrons in halo using the public PPPC 4 DM code [15]. Note that secondaryγflux frome± inter-actions in halo has some uncertainty related to insufficient knowledge of galactic media and magnetic field. We use the ”medium” interaction model implemented in [15].
To calculate the second term in (12) we approximate the extragalactic sources by continuous distribution and simulate the EM cascade propagation taking into account interactions ofe± andγ with the CMB and EBL using numerical code [11] with the source density
dQe,γ
dE =
¯ ρ0
MDMτDM
(1+z)3Γf
dNef,γ
dE , (14)
In Fig. 4 we show the example of these calculations for the decay channels,MDMandτDM indi-cated in captions. Extragalactic and Milky Way halo contributions are shown separately to illustrate that the fluxes are comparable. Note that model shown in Fig. 4a also provides a good fit for AMS-02 positron-electron data [16].
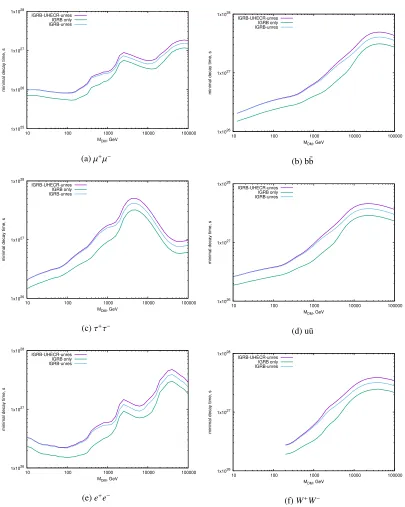
By imposing requirement χ2
DM ≤ 9 we constrain the minimal decay time of DM particles in particular channels. These constraints are presented in Fig. 5. For comparison, we also show the limits obtained disregarding minimal contribution of UHECR interaction products and unresolvedγ– ray sources (green curves) or disregarding just UHECR products (blue curves). The limits onτDM for MDM few TeV obtained in this work are on average 3-5 times stronger than the conservative constraints presented in the most recent analysis [16] due to more precise calculation of extragalactic contribution and account for unresolved astrophysical source and UHECR cascadeγ.
Acknowledgments
Section 2 is a continuation of the original work [4] initiated in collaboration with V. Berezinsky and A. Gazizov. The author thanks M. Cirelli for help with the PPPC 4 DM package. The work was supported by the Russian Science Foundation, grant 14-12-01430.
References
[1] M. Ackermann et al. (Fermi-LAT), Astrophys. J.799, 86 (2015),1410.3696
[2] M. Di Mauro (Fermi-LAT), The origin of the Fermi-LAT γ-ray
back-ground, in 14th Marcel Grossmann Meeting on Recent Developments in
The-oretical and Experimental General Relativity, Astrophysics, and Relativistic
Field Theories (MG14) Rome, Italy, July 12-18, 2015 (2016), 1601.04323,
http://inspirehep.net/record/1415711/files/arXiv:1601.04323.pdf
[3] J.M. Gaskins (2016),1604.00014
[4] V. Berezinsky, A. Gazizov, O. Kalashev (2016),1606.09293
[5] A. Aab et al. (Pierre Auger), Phys. Rev.D90, 122006 (2014),1409.5083
[6] R.U. Abbasi et al., Astropart. Phys.64, 49 (2015),1408.1726
[7] Y. Fedorova (HiRes), HiRes Stereo Cosmic Rays Composition Measurements, in
Proceed-ings, 30th International Cosmic Ray Conference (ICRC 2007) (2007), Vol. 4, pp. 463–466,
http://indico.nucleares.unam.mx/contributionDisplay.py?contribId=1236&confId=4
[8] H. Yuksel, M.D. Kistler, J.F. Beacom, A.M. Hopkins, Astrophys. J.683, L5 (2008),0804.4008
[9] G. Giacinti, M. Kachelrieß, O. Kalashev, A. Neronov, D.V. Semikoz, Phys. Rev.D92, 083016 (2015),1507.07534
[10] R.U. Abbasi et al. (Telescope Array), Astropart. Phys.80, 131 (2016),1511.07510
[11] O.E. Kalashev, E. Kido, J. Exp. Theor. Phys.120, 790 (2015),1406.0735
[12] Y. Inoue, S. Inoue, M.A.R. Kobayashi, R. Makiya, Y. Niino, T. Totani, Astrophys. J.768, 197 (2013),1212.1683
[13] J. Heinze, D. Boncioli, M. Bustamante, W. Winter (2015),1512.05988
[14] J.F. Navarro, C.S. Frenk, S.D.M. White, Astrophys. J.462, 563 (1996),astro-ph/9508025
[15] M. Cirelli, G. Corcella, A. Hektor, G. Hutsi, M. Kadastik, P. Panci, M. Raidal, F. Sala, A. Stru-mia, JCAP1103, 051 (2011), [Erratum: JCAP1210,E01(2012)],1012.4515
1x1025
1x1026 1x1027
1x1028
10 100 1000 10000 100000
minimal decay time, s
MDM, GeV
IGRB-UHECR-unres IGRB only IGRB-unres
(a)μ+μ−
1x1026 1x1027 1x1028
10 100 1000 10000 100000
minimal decay time, s
MDM, GeV
IGRB-UHECR-unres IGRB only IGRB-unres
(b) b¯b
1x1026 1x1027 1x1028
10 100 1000 10000 100000
minimal decay time, s
MDM, GeV
IGRB-UHECR-unres IGRB only IGRB-unres
(c)τ+τ−
1x1026
1x1027
1x1028
10 100 1000 10000 100000
minimal decay time, s
MDM, GeV
IGRB-UHECR-unres IGRB only IGRB-unres
(d) u¯u
1x1026
1x1027
1x1028
10 100 1000 10000 100000
minimal decay time, s
MDM, GeV
IGRB-UHECR-unres IGRB only IGRB-unres
(e)e+e−
1x1026 1x1027
1x1028
10 100 1000 10000 100000
minimal decay time, s
MDM, GeV
IGRB-UHECR-unres IGRB only IGRB-unres
(f)W+W−
![Figure 1: The energy spectra of protons (blue curve) and cascade photons (red curve) from sourcesemitting protons normalized on the TA spectrum [10]](https://thumb-us.123doks.com/thumbv2/123dok_us/8155643.1360341/3.482.47.437.353.523/figure-spectra-protons-cascade-photons-sourcesemitting-normalized-spectrum.webp)