* Corresponding author: [email protected]
Experimental study of the flow field disturbance in the vicinity
of single sensor hot-wire anemometer
Jacek Sobczyk1,*
1Strata Mechanics Research Institute of the Polish Academy of Sciences, Reymonta 27, 30-059 Krakow, Poland
Abstract. Preliminary experimental study of the flow field disturbance in the vicinity of single sensor normal hot-wire anemometer (SN) probe was carried out. Regular 2D particle image velocimetry (PIV) setup equipped with micro lens and distance rings was applied to measurements of macroscopic flow around microscopic elements. Experimental results revealed complexity of the flow around the wire and its strong dependence on both – the velocity magnitude and the probe orientation in relation to freestream direction. Examination of the velocity fields in the vicinity of SN probe suggests that it may not be such a "point" measurement method as it is commonly assumed to be.
1 Introduction
Metrology of flows (MOF) is a well-developed field of science in the present day [1-3]. What is more, continuous technological progress and growing industry demands are the main stimuli forcing this field to develop accordingly [4]. Nowadays measurements of flows make use of more and more sophisticated equipment. Regardless of the main working principle modern sensors, transducers as well as complex measurement systems are able to supply us with more and more accurate measurement results in a blink of an eye. New frontiers are being reached especially in the field of non-intrusive, optical measurements [5-10].
It is really true, that we are able to measure so complex phenomena in a so challenging conditions that a few decades ago it would simply seem a science-fiction. On the other hand, frequently, when using an expensive and sophisticated equipment or, just the opposite, “well-known” and “easy-to-use” one we are losing healthy criticism, believing in almost every result we get. This approach seems natural, as we want to believe that such equipment should serve us with only good results that we could rely on. Especially when we are sure that it is working properly and the phenomena we are measuring lays within limits covered by the device measuring range.
Implications of such an approach may be quite significant especially when high accuracy is indispensable and ambient conditions are variable in a range much wider than the device was designed for [1-3]. A simple example is the use of hot-wire anemometer (HWA) in the flow with variable temperature and/or absolute humidity, pressure and especially variable gas mixture composition. Even though velocity of the flow
lays within HWA calibration limits, relatively small parallel change of one or more of the mentioned parameters adds unexpected shifts to the measurement results, which are not always easy to compensate. What is more, single sensor normal HWA (SN) probe is usually regarded as a point measurement device/method, that virtually does not disturb the flow under investigation.
To avoid the former issue knowledge of the device constrains and the details of measurement conditions is indispensible. To understand the simplification of the latter one non-intrusive, optical measurement method such as particle image velocimetry (PIV) [2-6, 8-10] can be of a help. In fact, it is relatively easy to demonstrate by means of PIV that this common believe is not correct, especially in the case of low velocities.
There is a significant amount of comprehensive studies of various types of HWA probes aerodynamics. They were conducted with use of various techniques, predominantly pointwise, such as another HWA probe or laser Doppler anemometry [11-12]. There is only a few attempts of using PIV technique to analyze flow around HWA probe of any type present in the literature [13-14]. Those known to the author of the present study are very incomprehensive. Therefore the subject under investigation is original and – in the light of what was written above – important.
2 Measurements
2.1 Measurement stand
All measurements were carried out in the new, closed-circuit, low speed wind tunnel (fig. 1) belonged to the Laboratory of Optical Measurements Methods (LOMM) of the Strata Mechanics Research Institute of the Polish Academy of sciences (SMRI PAS) [15]. Basic parameters of the air stream potential core in the 0.5 m x 0.5 m x 1.5 m measurement chamber are: velocity in the range of 0.1÷60.0 m/s, level of turbulences (square root of the mean variance of the velocity components referred to the mean velocity) not higher than 0.5%, controlled temperature and relative humidity, full optical access to enable measurements by means of all optical techniques available on the market.
Fig. 1. Visualization of the wind tunnel.
The wind tunnel measurement stand is equipped with the set for stereo particle image velocimetry (SPIV) method. This measuring set is based on two sCMOS, 5.5 Mpx cameras, Nd:YaG, double impulse, 200 mJ per impulse, green laser and seeding generator filled with Di-Ethyl-Hexyl-Sebacate (DEHS). For the purpose of carrying out the planned measurements only one camera (PIV not SPIV configuration) was used together with 180 mm micro 1:1 lens and 2 sets of distance rings (fig. 2). This allowed to achieve projection of area c.a. 6.1 mm x 7.2 mm onto 2160 px x 2560 px sCMOS sensor. 150 pairs of images were taken at the maximum rate of the system i.e. 15 Hz in every single measurement. More than 3000 in total. This amount was suitable for the described research problem, however it is usually not sufficient for statistical considerations.
Fig. 2. The sCMOS camera used in measurements connected to two sets of distance rings and 180 mm 1:1 micro lens.
For the research a regular type of SN probe was chosen (made in the SMRI PAS): 5 microns in diameter, 1.35 mm long, tungsten wire welded to two straight, conical, 20 mm long prongs. Stem short, 5 mm in diameter, fixing to the
prongs covered by means of a convex droplet of glue (fig. 3). The probe was located close to the measuring chamber inlet and close to its axis.
Fig. 3. The SWHWA under investigation. Picture taken during the calibration procedure. The head of the Schmidt type anemometer visible in the bottom right corner.
2.2 Measurement conditions
Four different orientations of the SN probe with regard to the air freestream direction (fig. 4) and four different freestream velocities (0.16, 0.56, 2.0 and 8.5 m/s) were chosen for analysis. The orientations do not exhaust all the possibilities, but give a good introduction to the problem itself. Reynolds numbers calculated for the wire and prongs are gathered in table 1.
Fig. 4. Sketches presenting four different orientations of the SWHWA probe applied during measurements.
Table 1. Re values calculated for the wire and prongs.
Diameter* [m] Velocity [m/s] Re**
Wire 5.0E-06
0.16 0.05 0.56 0.18 2.00 0.66 8.55 2.82
Prongs 2.0E-04
0.16 2.11 0.56 7.38 2.00 26.4 8.55 112.8
*) The diameter of the wire is 5 um. However due to presence of the submicronic seeding particles which condensate on its surface, the diameter may increase in an uncontrolled way depending on the wire orientation. Diameter of the visible parts of prongs on PIV images varies in 0.1-0.3 range. Mean value of 0.2 was chosen as a representative. DEHS condensation on the prongs leads to appearing of droplets which slowly grow and flow down additionally disturbing the flow.
**) Re values were calculated for air properties resulting from microclimatic conditions. Presence of the DEHS suspension, slightly increasing the apparent density of air, was not taken into account.
2.3 Results
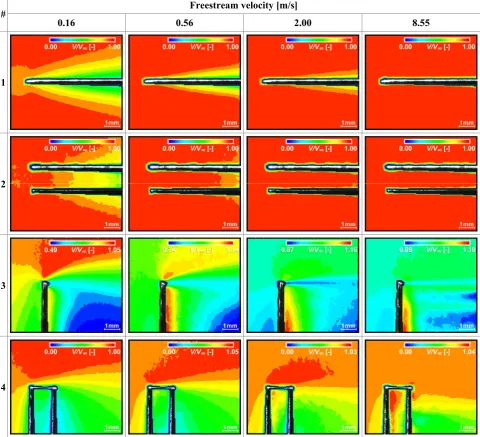
Full comparison of the achieved results in the form of velocity magnitude scalar maps is presented in fig. 5. The first 8 maps has a constant 0.0÷1.0 relative velocity scale to enable comparison of the type of flow. Whereas on another 8 maps velocity scales were adjusted so as to expose complexity of the flow field in every single case. Due to strong reflections, which obstruct estimation of vectors, contour maps were cleared in the close vicinity of prongs and wire. The laser light sheet was directed perpendicularly to the camera and set in the plane going:
a) through the middle of the wire in case of orientations #1 and #3 (see fig. 4),
# Freestream velocity [m/s]
0.16 0.56 2.00 8.55
1
2
3
4
b) immediately behind the prongs in case of orientation #2 and
c) along the prongs in case of orientation #4.
Contour plots presented in fig. 5 depicture the SN probe influence on air stream in close vicinity of the wire and the tips of prongs. This influence strongly depends on both – velocity magnitude and the probe orientation in relation to freestream direction.
For orientation #1 one can easily see increasing area of the field of lowered velocity progressing in the upstream direction as the velocity decreases. This phenomena may explain for example the voltage-velocity dependence deviation from the King’s equation for low velocities [18]. In case of orientation #2 this effect is slightly less visible only due to measurement plane shift off the plane in which the wire and the prongs lie.
The SN probe orientations perpendicular to the stream introduce much more disturbance and therefore observed velocity fields are more diversified. Again, complex flow patterns created in low velocities are being deformed and then almost blown off in higher velocities. An interesting observation is a relatively strong wake behind the wire in orientation #3. This phenomena was raised for example in paper [14], where also the difference between heated and cold wire wakes by means of PIV measurements was qualitatively expressed. More detailed and quantitative analysis one may find in the monograph [19], author of which measured velocity profiles in the wakes behind 30 mm long and 5÷10 um thick tungsten wires (heated and unheated) by means of another SN. It was found, that
minimal velocity in these Gaussian-shaped wake profiles exhibit lower values and their full widths at half maxima (FWHM) are bigger behind heated wire than behind a cold one. No significant differences for wires of various diameters were observed.
All the PIV measurements described here were conducted for heated wire only, with the overheat ratio
a = 0.8. At this stage of the research it is impossible to univocally state that there was no DEHS film covering the wire as it is the case for a cold one. Heating the wire may prevent DEHS from condensing and/or promote its efficient evaporation as the DEHS boiling point, depending on its chemical purity, lays within the range of 232-256°C [20-21]. Further detailed research is required to ascertain what is the most suitable temperature of the wire for PIV measurements, as too low may allow DEHS film growing and too high may provoke violent vaporisation. The influence of orientation in respect to the gravity direction also needs to be examined.
On the other hand calibration procedure repeated during and after PIV measurements revealed the deviation of calibration curve of less than 5% and 1%, respectively, in comparison to one made prior to experiments. This suggests that the wire at a = 0.8 was relatively resistant to DEHS condensation and not too hot at the same time. Therefore the results of the present study (fig. 6a-c) were compared to those from [19] (fig. 6d-f) in a quantitative manner.
During analysis of the fig. 6 it is important to bear in mind, that the SN probe used in the present study had 22 times shorter wire comparing to one used in [19]. Small
a) b) c)
d) e) f)
space between prongs resulted in the velocity field alternation in this area and above (vide fig. 5 #3). This in turn was responsible for braking the symmetry of velocity profiles in fig. 6a-c.
Graphs presented in fig. 6a-c were prepared in coordinate systems corresponding to those from [19]. The origin of abscissa overlap with the centre of the wire and spreads 1 mm above and 1 mm below it. Ordinate, regardless of the velocity mean value, covers the range of 80 cm/s.
The first two couples under comparison (fig. 6a,d and fig. 6b,e) have very similar mean velocities. The third couple (fig. 6c,f) differs in terms of the mean velocity by the factor 2, as the author of [19] conducted all measurements at low velocities only. Still, this couple can be easily compared qualitatively.
Simple, visual comparison of graphs presented in fig. 6 leads to three basic observations:
it is clear that both series of experiments recorded very similar wakes, also in terms of quantity,
discrepancies result from the difference in distance between prongs,
the disturbing behaviour of prongs expresses stronger and closer to the wire as the velocity increases.
3 Conclusions
A series of PIV measurements made in the new facility belonging to SMRI PAN revealed interesting properties of flows around wire of the SN probe. Four different flow patterns related to probe orientations in space were recorded and presented. They depict very complex 3D velocity fields, also in the close vicinity of the wire, especially for the transverse orientation of probe. This leads to the conclusion, that even simple SN probe is by no means a real pointwise measuring device. This also explains why measurements in the close proximity of any other body such as surface or even another probe require probes of a special design and dedicated corrections of the results.
Another conclusion is that flow pattern change in correlation with the probe orientation is responsible for its directional response. It means, that even if during measurements the probe is oriented exactly this same way as it was during calibration the results cannot be accurate if the flow is highly disturbed/turbulent or its main direction significantly deviates in time. This is one of a well-known restriction of the HWA technique and SN in particular [11, 13, 18, 22-25].
Flow pattern change in correlation with the free-stream velocity was also revealed. Most of all, it illustrates change of the disturbing character of prongs. This phenomena contributes i.a. to the calibration curve parameters – unnoticeable in higher velocities (small or similar to King’s equation type of dependence) and more explicitly in the lower ones (as it was already mentioned above).
Knowledge about velocity field in the vicinity of SN probe, and especially close to its wire may be very useful as it allows for quick estimation of the probe interaction with the flow itself as well as with adjacent objects.
Similar research conducted for all other types of HWA probes would create a valuable database.
Acknowledgment
This publication presents results of the work supported by the Statutory Research of IMG-PAN.
References
1. M. Kochsiek, M. Gläser, Handbook of Metrology
(John Wiley & Sons, 2010)
2. R.W. Miller, Flow Measurement Engineering Handbook (McGraw-Hill Inc., New York, 1996). 3. C. Tropea, A.L. Yarin, Springer Handbook of
Experimental Fluid Mechanics (Springer Science & Business Media, 2007)
4. S. Discetti, A. Ianiro, Experimental Aerodynamics
(CRC Press, 2017)
5. T. Yoshizawa, Handbook of Optical Metrology: Principles and Applications (CRC Press, 2017) 6. C. Mercer, Optical Metrology for Fluids,
Combustion and Solids (Springer Science & Business Media, 2013)
7. A. Boutier, Laser Metrology in Fluid Mechanics: Granulometry, Temperature and Concentration Measurements (John Wiley & Sons, 2013)
8. M. Raffel, Ch.E. Willert, S. Wereley, J. Kompenhans, Particle Image Velocimetry: A Practical Guide (Springer Science & Business Media, 2007)
9. A. Schröder, Ch.E. Willert, Particle Image Velocimetry: New Developments and Recent Applications (Springer Science & Business Media, 2008)
10. R.J. Adrian, J. Westerweel, Particle Image Velocimetry (Cambridge University Press, 2011) 11. R.J. Adrian, R.E. Johnson, B.G. Jones, P. Merati,
A.T.C. Tung, J. Phys. E 17, 1 (1984)
12. G. Comte-Bellot, A. Strohl, E. Alcaraz, J. Appl. Mech 38, 4 (1971)
13. L.J.W., Graham, J. Soria, K. Bremhorst, Exp. Fluids
19, 379-382 (1995)
14. J. Sobczyk, M. Gawor, Przegląd Górniczy, 11/2015, 117-123 (2015), (in Polish)
15. M. Bujalski, M. Gawor, J. Sobczyk, Transactions Of The Strata Mechanics Research Institute, 15, 1-2 (2013), (in Polish)
16. J. Sobczyk, M. Gawor, Intensity of turbulence in the potential core of the SMRI PAS new wind tunnel, SMRI PAS Internal Reporting Conference, 2016, (in Polish)
17. J. Sobczyk, M. Gawor, Transactions Of The Strata Mechanics Research Institute, 18, 4 (2016), (in Polish)
19. E. Poleszczyk, Transactions of the Strata Mechanics Research Institute, Series: Dissertations, Monographs, 1 (Krakow, 2002), (in Polish)
20. https://pubchem.ncbi.nlm.nih.gov/compound/bis_2-ethylhexyl__sebacate, (retrieved 19.09.2017) 21. DEHS exemplary datasheets:
https://www.topas-gmbh.de/dateien/prospekt/dehs_prspe.pdf;
https://www.ila.de/fileadmin/documents/en/datashee ts/piv/seeds/ILA_data_DEHS.pdf;
https://www.palas.de/en/product/download/dehs/dat asheet/pdf, (retrieved 19.09.2017)
22. J.W. Elsner, Regeneracja sond Termoanemo-metrycznych, Cieplne maszyny przepływowe, 68-69, (1968), (in Polish)
23. F.E. Jorgensen, DISA Information, 11, 31-37, (1971)
24. O.O. Mojola, DISA Information, 23, 24-27 (1978) 25. L. di Mare, T.O. Jelly, I.J. Day, Meas. Sci. Technol.

![Fig. 6. Transverse velocity profiles of the wake behind the heated wire (a = 0.8). Results achieved by the author of the present paper – upper row, and by the author of [19] – bottom row](https://thumb-us.123doks.com/thumbv2/123dok_us/8046553.1340251/4.595.54.542.444.737/transverse-velocity-profiles-heated-results-achieved-author-present.webp)
