Western University Western University
Scholarship@Western
Scholarship@Western
Electronic Thesis and Dissertation Repository
7-14-2014 12:00 AM
Human Metaphase Chromosome Analysis using Image
Human Metaphase Chromosome Analysis using Image
Processing
Processing
Akila M.S Subasinghe Arachchige
The University of Western Ontario
Supervisor
Dr. Jagath Samarabandu
The University of Western Ontario
Graduate Program in Electrical and Computer Engineering
A thesis submitted in partial fulfillment of the requirements for the degree in Doctor of Philosophy
© Akila M.S Subasinghe Arachchige 2014
Follow this and additional works at: https://ir.lib.uwo.ca/etd
Part of the Biomedical Commons, Genetics Commons, Other Biomedical Engineering and Bioengineering Commons, and the Signal Processing Commons
Recommended Citation Recommended Citation
Subasinghe Arachchige, Akila M.S, "Human Metaphase Chromosome Analysis using Image Processing" (2014). Electronic Thesis and Dissertation Repository. 2178.
https://ir.lib.uwo.ca/etd/2178
This Dissertation/Thesis is brought to you for free and open access by Scholarship@Western. It has been accepted for inclusion in Electronic Thesis and Dissertation Repository by an authorized administrator of
Human Metaphase Chromosome Analysis
using Image Processing
(Thesis format: Monograph)
by
Akila Subasinghe Arachchige
Graduate Program in
Engineering Science
Electrical and Computer Engineering
A thesis submitted in partial fulfillment of the requirements for the degree of
Doctorate of Philosophy
School of Graduate and Postdoctoral Studies The University of Western Ontario
London, Ontario, Canada
c
Abstract
Development of an effective human metaphase chromosome analysis algorithm can
optimize expert time usage by increasing the efficiency of many clinical diagnosis
processes. Although many methods exist in the literature, they are only applicable
for limited morphological variations and are specific to the staining method used
during cell preparation. They are also highly influenced by irregular chromosome boundaries as well as the presence of artifacts such as premature sister chromatid
separation.
Therefore an algorithm is proposed in this research which can operate with
any morphological variation of the chromosome across images from multiple staining
methods. The proposed algorithm is capable of calculating the segmentation outline,
the centerline (which gives the chromosome length), partitioning of the telomere
re-gions and the centromere location of a given chromosome. The algorithm also detects
and corrects for the sister chromatid separation artifact in metaphase cell images. A
measure termed the Candidate Based Centromere Confidence (CBCC) is proposed to accompany each centromere detection result of the proposed method, giving an
indication of the confidence the algorithm has on a given localization.
The proposed method was first tested for the ability of calculating an accurate
width profile against a centerline based method [1] using 226 chromosomes. A
statisti-cal analysis of the centromere detection error values proved that the proposed method
can accurately locate centromere locations with statistical significance. Furthermore,
the proposed method performed more consistently across different staining methods
in comparison to the centerline based approach. When tested with a larger data set of
1400 chromosomes collected from a set of DAPI (4’,6-diamidino-2-phenylindole) and
Giemsa stained cell images, the proposed candidate based centromere detection algo-rithm was able to accurately localize 1220 centromere locations yielding a detection
accuracy of 87%.
Acknowledgements
First and foremost, I would like to thank my main supervisor, Dr. Jagath Samara-bandu for all the invaluable guidance and advice given to me throughout my PhD, both academically and personally. He has truly been a big influence and a role model for my academic career as well as for my personal life. I would like to thank my co-supervisor Dr. Peter Rogan as well as Dr. Joan Knoll for all their guidance and knowledge shared with me during my research. A great deal of appreciation needs to be shown to my course instructors, Dr. Ladak, Dr. Olga Veksler, Dr. Yuri Boykov and Dr. John Barron for their innovative and attractive ways of teaching and mo-tivating my work. I would also like the thank Dr. Quazi Rahman for guiding me through my TA duties during this period.
Mr. Wahab Khan, Ms. Natasha Caminsky, Ms. Heather Tarnowski, Dr. Ruth Wilkins and Ms. Farrah Flegal were instrumental in collecting data required for the research and requires special acknowledgement. Contributions of my research col-leagues Mr. Yanxin Li and Mr. Asanka Wickramasinghe are also mentioning with a thankful note for their efforts in converting the proposed work to C++ code. I would also like to thank Dr. Jacques for the valuable discussion we have had both on research matters as well as on photography.
I am extremely thankful for the financial support provided by the Western Innovation Fund (University of Western Ontario), Natural Sciences and Engineering Research Council of Canada and the DART-DOSE CMCR (5U01AI091173-02 from the NI-AID/US Public Health Service).
I would also like to thank my mother and my late father, who passed away during the first year of my masters research. I would not be here if not for the courage, guidance and support given by my parents who idolize and cherish all my achievements. The small Sri Lankan community in London needs to be acknowledged for caring for me throughout these past two years. I would also like to acknowledge my 2 year old son who brings a lot of love and joy into my life. Last, but definitely not least, I would like to thank my beloved wife whom I draw a lot of energy and courage from in times of need. She is also my first proof reader, who in many ways was actively involved in finishing this dissertation.
Akila Mike, June - 2014, London ON.
Table of Contents
Abstract . . . ii
Acknowledgements . . . iii
List of tables . . . vi
List of figures . . . viii
Acronyms and Symbols . . . xii
1 Introduction . . . 1
1.1 Contributions . . . 5
1.2 Thesis organization . . . 8
2 Background . . . 9
2.1 Introduction to human chromosomes . . . 9
2.1.1 The centromere . . . 10
2.1.2 The telomere . . . 14
2.1.3 The centromere index (CI) . . . 14
2.2 Review of existing algorithms . . . 16
2.2.1 Segmentation methods . . . 16
2.2.2 Centromere detection methods . . . 19
2.3 Background methods . . . 22
3 Proposed algorithm . . . 24
3.1 The data set . . . 25
3.2 Pre processing and segmentation . . . 28
3.3 Finding the centerline . . . 33
3.3.1 Centerline based Centromere identification . . . 40
3.4 Contour partitioning & correcting for sister chromatid separation . . 41
3.4.1 Contour partitioning for isolating the telomere . . . 43
3.4.2 Shape information extraction . . . 49
3.5 Laplacian based thickness measurement . . . 53
3.5.1 Intensity integrated Laplacian based thickness measurement . 54 3.6 Candidate point generation & metaphase centromere detection . . . . 61
3.6.1 Principal component analysis (PCA) of features . . . 65
3.6.2 Candidate based centromere confidence (CBCC) . . . 66
Table of Contents
4 Results . . . 73
4.1 Preliminary testing . . . 73
4.1.1 Statistical analysis . . . 75
4.2 Candidate based method performance . . . 84
5 Conclusions & Future work . . . 91
5.1 Summary of the proposed method . . . 91
5.2 Conclusive remarks . . . 93
5.3 Future work . . . 94
Appendices . . . 96
A Background methods . . . 97
A.1 GVF snakes . . . 97
A.1.1 Parametric snakes or active contours . . . 97
A.1.2 Gradient vector flow as an external energy . . . 101
A.1.3 GVF snakes vs DT snakes . . . 102
A.2 Discrete curve evolution (DCE) . . . 104
A.2.1 Definitions . . . 105
A.2.2 The relevance function . . . 108
A.2.3 Advantages & disadvantages of DCE . . . 110
A.3 Support Vector Machines (SVM) . . . 112
A.3.1 Deriving the SVM framework . . . 114
Bibliography . . . 116
Curriculum Vitae . . . 125
List of Tables
2.1 Typical range of centromere index (CI) for each human chromosome [2] 15
3.1 A kernel that represents the Laplacian equation on a digital image . . 57 3.2 The kernel that integrates intensity information into the Laplacian
calculation for location (x, y) in a 3x3 local neighborhood. . . 59 3.3 The percentage contribution of each feature to the variance of the whole
data set in the descending order. . . 66 3.4 The mean and the standard deviation of the CBCC values in cases with
accurate centromere detection as well as inaccurate centromere detec-tion. The table also includes cases where non of the candidates were not found to be viable candidates (a subset of inaccurate centromere detection) for the centromere location. . . 67 3.5 The mean and the standard deviation of the percentile confidence
val-ues in cases with accurate centromere detection as well as inaccurate centromere detection. The table also includes cases where none of the candidates were not found to be viable candidates (a subset of inaccu-rate centromere detection) for the centromere location. . . 69
4.1 Breakdown of chromosome cell images and chromosomes based on the staining method and the sister chromatid separation (SC Sep.) . . . . 74 4.2 The Kolmogorov-Smirnova normality test results for the data set. . . 78 4.3 Descriptive values for the detection error data set when analyzed with
proposed Laplacian based method (EL) and Centerline based method (EC) [1]. . . 78 4.4 Levene’s test for testing equal variance of detection error within image
groups (given in table 4.1) for each algorithm. . . 78 4.5 The Wilcoxon signed test rank analysis results. . . 79 4.6 The Wilcoxon signed test significance analysis results. . . 79 4.7 Descriptive values for the detection error for the proposed Laplacian
method (EL) and the centerline based method (EC) with respect to the image groups stated in table 4.1. . . 80 4.8 ANOVA test for significance within image groups. . . 81 4.9 Games-Howell post-hoc test results for analyzing significance of
vari-ance between image groups where the groups Group 1,2,3 were D-NSC (DAPI without SC Sep.),D-WSC (DAPI with SC Sep.) and G-WSC (Giemsa with SC Sep.) respectively. . . 81
List of Tables
4.10 Non-parametric correlation test for significance (Sig.) using Spearman coefficient for detection error between the proposed algorithm and the centerline based method whereρ(X,Y) denotes the correlation between two random variabels. . . 83 4.11 Breakdown of chromosome cell images and chromosomes used for the
larger data set based on the staining method and the sister chromatid separation (SC Sep.) . . . 84 4.12 The detection accuracy values for chromosomes used for the larger data
set based on the staining method and the sister chromatid separation (SC Sep.) . . . 87 4.13 The results of the preliminary analysis in studying the feasibility of
extending the proposed method for dicentric detection is presented by indicating the number of times different ranked candidates were able to encompass the second centromere. . . 90
List of Figures
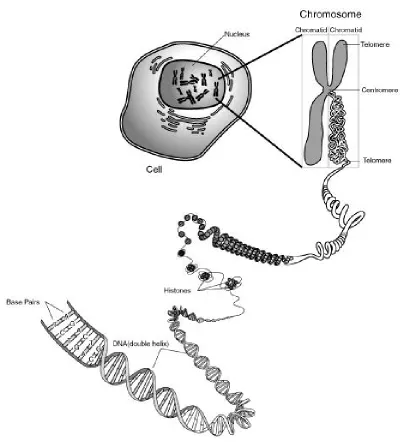
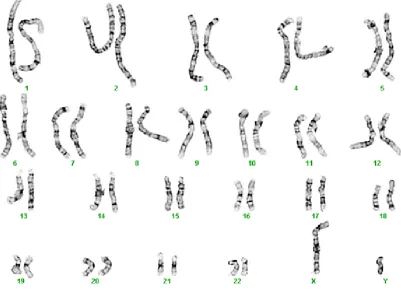
2.1 An illustration of the structure of a chromosome in context of the cell (Source- http://commons.wikimedia.org/wiki/File:Chromosome.gif). . 11 2.2 A karyotype analysis end result with all 46 chromosomes organized
according to their chromosome groups and types (Reproduced with permission from Dr. Joan Knoll and Dr. Peter Rogan). . . 12 2.3 The structural components of metaphase chromosomes of all three
cat-egories : the metacentric, sub-metacentric and acrocentric . . . 13 2.4 The lengths used for calculating the centromere index of a given
chro-mosome. . . 14
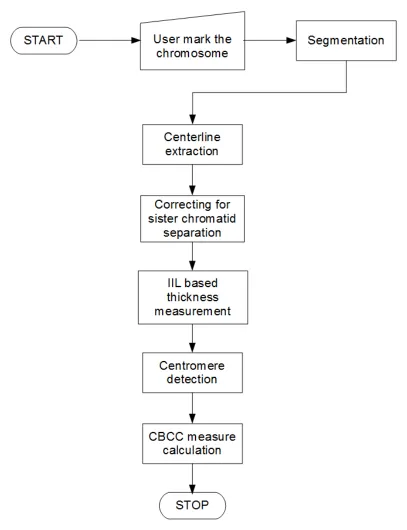
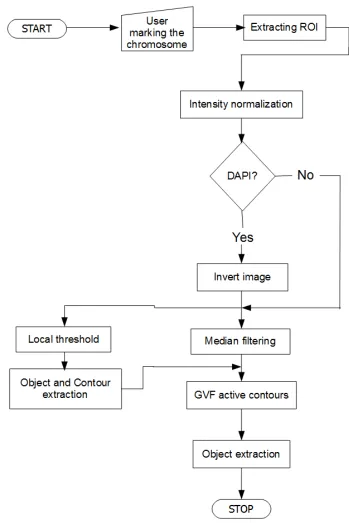
3.1 The flow diagram of the proposed method. . . 26 3.2 Shows two cell images with different staining methods. Figure 3.2(a)
contains a cell image with DAPI staining while figure 3.2(b) is a Giemsa stained image. . . 27 3.3 The flow diagram of the preprocessing and segmentation stage of the
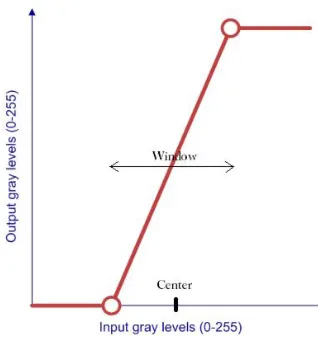
proposed method. . . 29 3.4 The window-center intensity mapping scheme which was used to map
a certain intensity range (defined by the window and the center) to the full range (intensity levels 0 - 255). . . 30 3.5 Depicts an example of the effect of intensity normalization on a DAPI
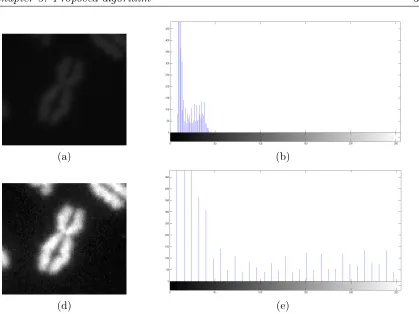
stained image window. Figure 3.5(a) & (b) depicts the original image window and the corresponding histogram. Similarly the figures 3.5(c) & (d) depicts the intensity normalized image window and the corre-sponding histogram. . . 31 3.6 Depicts the resulting image window at different stages of the
segmenta-tion algorithm where figure 3.6 (a) gives the original window containing the chromosome prior to segmentation. Figures 3.6 (b) and (c) con-tain the threshold output and the extracted binary object. The GVF outcome is given in figure 3.6 (d) . . . 34 3.7 Two chromosomes and their skeletonization [3] and morphological
thin-ning results [4] showing some resulting spurious branches. These op-erations were performed on the binary object obtained through Otsu’s method. Figure 3.7 (b) and (e) are the skeletonization results while figure 3.7 (c) and (f) are the morphological thinning results. . . 36
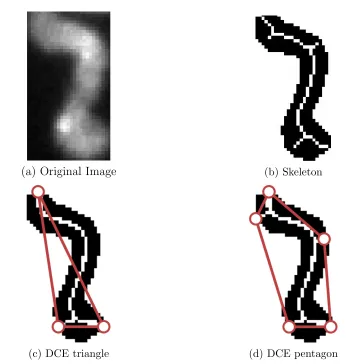
List of Tables
3.8 Comparison between standard skeleton with DCE based skeletal prun-ing results where (c) and (d) are the skeletons resultprun-ing from the DCE triangle and the DCE pentagon results. . . 38 3.9 The eight masks used for the hit and miss algorithm where ’+1’ and
’-1’ elements search for matching foreground and background pixels respectively, while the ’0’ ignores the value at that position. . . 39 3.10 Depicts the trellis structure created for calculating the width profile of
a chromosome. . . 40 3.11 (a) and (b) depict two instances where the centerline based centromere
detection was adversely affected by sister chromatid separation. . . . 41 3.12 The flow diagram of the correction for sister chromatid separation stage
of the proposed method. . . 42 3.13 Depicts the effects on the chromosome morphology introduced by sister
chromatid separation. (a) and (b) depict two straight chromosomes without and with sister chromatid separation respectively both with DAPI staining. . . 43 3.14 Figure demonstrates one possible combination for contour partitioning
where the anchor point (red ’+’ sign) P1E is connected with the can-didate point P4S while the other anchor point P2E is connected with candidate pointP1S which captures the telomere regions. The blue line connects the set of points constituting the considered combination in this instance. . . 47 3.15 The flow diagram of the Intensity integrated Laplacian algorithm of
the proposed method. . . 55 3.16 Depicts the uniform sampling of the width profile using the proposed
method in figure 3.16 (c) & (d) as opposed to the trellis structure mea-surements through the centerline based approaches given by figure 3.16 (a) & (b). . . 69 3.17 Demonstrates the difference between the kernel of the proposed method
in comparison to the standard Laplacian kernel. Figure 3.17(b) is an enlarged view of the 3x3 neighborhood of the pixel location marked by yellow on figure 3.17(a). Figure 3.17(c) & (d) represents the stan-dard Laplacian and intensity biased Laplacian kernels calculated for the neighborhood of interest. . . 70 3.18 The steps of tracing the thickness (yellow stars) at one contour location
of the chromosome where the arrows indicate the Laplacian vector field. The black square indicates the end point on the contour of the object. The final thickness value is calculated by getting the sum of all the lengths of these small steps. . . 70 3.19 An example where the contour C is split into two approximately
sym-metric segments C1 and C2. The red width trace line connects the pointsCλ1 and Cλ2 of the two contour segments. . . 71
List of Tables
3.20 Shows the expected scenario for candidate based centromere detection where the blue square represents the optimal candidate while the other five candidates are given by the red squares in the feature space. . . . 71 3.21 A collection of possible cumulative distributive functions (of
Gaus-sian distributions) where the (µ, σ) values are set at (0.5, 0.5) for figure 3.21(a) , at (0.5, 0.1) for figure 3.21(b), at (0.75, 0.5) for fig-ure 3.21(b) and finally at (0.75, 0.1) for figfig-ure 3.21(d). . . 72
4.1 Demonstrates some sample results of the algorithm where the detected centromere location is depicted in red color circle against the centerline based approach [1] in blue color star while the ground truth centromere line is depicted in white. Figure 4.1 (a)&(b) are results of DAPI (4’,6-Diamidino-2-Phenylindole) stained chromosomes while figure 4.1 (c)-(f) are results of Giemsa stained chromosomes. Figure 4.1(e) is an instance in which the proposed algorithm has outperformed the state of the centerline method significantly while figure 4.1 (f) is an instance in which the proposed algorithm has failed to yield the accurate cen-tromere location due to high degree of sister chromatid separation. . . 76 4.2 Depicts an example of the correction for the sister chromatid
separa-tion artifact and the impact of that correcsepara-tion on the width profile measurement in the proposed method. The right hand side telomere region was corrected for sister chromatid separation in figure 4.2 (c) where the resulting uniform sampling of the width profile from the Laplacian based method is given in figure 4.2 (d) as opposed to the centerline based method in figure 4.2 (b). . . 77 4.3 The scatter plots for demonstrating the correlation between the two
detection error distributions in which the ’x’ axis is the detection error of the proposed Laplacian based method (EL) and the ’y’ axis is the centerline based method (EC). . . 82 4.4 Demonstrates an example where 5 candidates were created for the
chro-mosome in figure 4.4 (a) using the width profile in figure 4.4 (b). The figure 4.4 (c) shows the signed distance values for each candidate cal-culated from the separating hyperplane while the selected candidate is depicted in blue. . . 86 4.5 Demonstrates some sample results of the algorithm where the
accu-rately detected centromere location (selected candidate) is depicted by a yellow dot while the segmented outline is drawn in blue. Figure 4.5 (a) is a result of DAPI stained chromosomes while figure 4.5 (b)-(f) are results of Giemsa stained chromosomes. These results reported CBCC measures of (a) 1.000, (b) 1.000, (c) 1.000, (d) 0.995, (e) 1.000, (f) 0.661 respectively. . . 88
List of Figures
4.6 Demonstrates some sample results where algorithm failed to yield an accurate centromere location. The detected centromere location (se-lected candidate) is depicted by a yellow dot while the segmented out-line is drawn in blue. These results reported CBCC measures of (a) 0.368, (b) 0.066, (c) 0.655 respectively. . . 89
A.1 Comparison between Distance Potential (DT Based) model (top) and the GVF model (bottom). Each model depicts the initialization of the contour and convergence with each iteration (on left) followed by the final contour result after 100 iterations(on right) [5]. (Reproduced with permission from Prof. Jerry L Prince) . . . 104 A.2 Comparison between Distance Potential (DT Based) vector field (left)
and the GVF vector field (right) [5]. (Reproduced with permission from Prof. Jerry L Prince) . . . 105 A.3 above: Steps of the DCE process of shape simplification, below: the
same steps when initiated by adding boundary noise to the same im-age [6]. (Reproduced with permission from Prof. Longin Jan Latecki) 107 A.4 A representation of two line segments and the used angle measurements
in the DCE process, which can be used to explain the rationale behind the used ’relevance measure’. . . 108 A.5 Shape variations of polygon partitions and the effects of turn angle and
arc length to the relevance measure. . . 109 A.6 Two different separating hyperplanes derived for the same training
data points. Figure A.6(a) contains the separating hyperplane with the optimal margin. The new data point given by the yellow square will be classified differently in these two cases. . . 113 A.7 The framework for deriving the geometric margin of a support vector
machine classifier. . . 114
Acronyms and Symbols
1D, 2D 1 Dimensional, 2 Dimensional
A Adenine
ADCI Automated Dicentric Chromosome Identifier
ANN Artificial Neural Networks
ANOVA Analysis of Variance
C Cytosine
CBCC Candidate Based Centromere Confidence
CI Centromere Index
DAPI 4’,6-diamidino-2-phenylindole
DCE Discrete Curve Evolution
DNA DeoxyriboNucleic Acid
DT Distance Transform
FISH Fluorescence In Situ Hybridization
FITC Fluorescein Isothiocyanate
G Guanine
GF Goodness of Fit
GVF Gradient Vector Flow
KKT Karush Kuhn Tucker
MAT Medial Axis Transform
PC Parametric Curve
PCA Principal Component Analysis
RGB Red, Green and Blue
ROI Region of Interest
SLT Statistical Learning Theory
SVM Support Vector Machines
T Thymine
1
Chapter 1 Introduction
The development of image processing techniques for analyzing human metaphase
chromosomes can be seen as the key in speeding up many cytogenetical diagnosis
processes while optimizing the use of the scarce resource, expert time.
A human chromosome is comprised of DeoxyriboNucleic Acid (DNA) along with
protein. The DNA is primarily responsible for genetic inheritance and behavioral pat-terns of a human being. The genetic makeup and the familiar physical resemblance of
a human chromosome is achieved due to the genetic condensation during cell division
(mitosis). Therefore by studying the chromosome structure during mitosis,
cyto-geneticists can identify genetic disorders caused by genetic translocation, deletion,
trisomy, monosomy and radiation exposure etc. Many chronic diseases are caused
by these genetic deformations and can be diagnosed by analyzing chromosome cell
images. Therefore the study of human chromosomes and their structure is of
ut-most importance in clinical diagnosis. Although cell preparatory techniques such as
non radioactive Fluorescence In Situ Hybridization (FISH) have been used to assist this diagnosis process by providing the cytogeneticist with information regarding the
present location of a known DNA sequence in a selected chromosome, the diagnosis
process can still be tedious and time consuming [7]. A typical lymphocyte slide of a
given patient on average can yield up to 500 cell images when imaged through a light
microscope. Perusing through hundreds of cell images for one patient even at triage
stage can be tiresome and can lead to operator fatigue. Therefore, manual analysis
and diagnostic processes are tedious and tiresome for experts and also are limited by
the the number of experts available.
With increasing use of digital microscopy for cytogenetical diagnosis, high
res-olution digital images are becoming readily available for the diagnosis process. With the adaptation of various staining methods and cell preparation technologies, the list
of diseases that can be diagnosed also increases. One such technique is termed
Flu-orescence In Situ Hybridization (FISH), which places probes as markers for certain
genetic sequences within the chromosome body. In Karyotype analysis, the expert
Chapter 1: Introduction 2
for chromosome abnormalities. Similarly in radiation dosimetry, the number of di-centrics (radiation dosage) needs to be counted accurately in order for the medical
expert to prescribe a chain of remedies for the patient. This can grow into an even
severe issue during the aftermath of a nuclear event where millions of patients would
need these services from a handful of experts within a small window of time. Therefore
with increasing capabilities of computer systems, developing a set of image analysis
algorithms for analyzing chromosomes and aiding in diagnosing is a tempting task.
This can certainly increase the efficiency of the diagnosis process while optimizing
expert time usages. The research reported in this dissertation is part of a combined
effort in developing a set of algorithms for detecting dicentric chromosomes for radi-ation biodosimetry.
Many methods have been tried over decades in order to fill this void for a set of
algorithms to analyze human metaphase chromosomes. However, coming up with a
set of algorithms to reliably detect salient features of human chromosomes remains a
challenge to date due the morphological variations of the chromosome structure. The
morphology and length of chromosomes within diploid human cells can vary between
cytogenetic preparations depending upon the methodology used to grow and analyze
the cells. The clinical reasons mostly governs the methodology or steps taken during
cell preparation. If subtle structural chromosome abnormalities involving a single chromosome band are suspected as in certain inherited genetic disorders then
meth-ods (such as addition of DNA intercalating agents, reduced colcemid time, cell cycle
synchronization, 3-4 day lymphocyte culture) that reduce chromosome condensation
or arrest chromosomes in an earlier stage of metaphase are utilized (referred to as
prometaphase or high resolution cytogenetic analysis). If numerical chromosome
ab-normalities or low frequency large structural acquired abab-normalities such as dicentric
chromosomes are suspected as in certain cancer specimens or biodosimetry samples
then methods (such as prolonged colcemid time and concentration; 2 day cell culture)
that increase the number of cells in metaphase at the cost of chromosome length are used. Aside from the obvious differences in chromosome length between the two types
of methods, shorter more condensed chromosomes often have separated or distinct
sis-ter chromatids on each arm and fewer chromosomal bands are evident. Furthermore,
the cell preparatory method and steps also depends on the type of laboratory which
is utilized for the test. For an instance, cells prepared at a cytogenetic laboratory (for
Chapter 1: Introduction 3
to ones prepared at a biodosimetry laboratory (to calculate the radiation exposure dose of victims of a mass radiation event). Even environmental factors such as
am-bient temperature and humidity influences the shape variations in human metaphase
chromosomes and a minute change in anyone of these factors can be represented in
the shape of the chromosomes on the slides.
Despite these differences however, the primary constriction or centromere, which
is the most constricted region of a chromosome, to which the spindle fiber is attached
during mitosis (cell division) [8] remains evident on the chromosomes. Detection of
the centromere involves in segmentation of the chromosome as well as identifying
salient points such as the chromosome end points. Furthermore the accurate cen-tromere localization can be used to directly identify the chromosome type and with
additional information can lead to identifying the chromosome number in the cell as
well. Therefore, accurate detection of the centromere location can be considered as a
key element in a reliable chromosome analysis algorithm. However, detecting the
cen-tromere can be a challenging task even to the trained human eye. Irregular boundary
conditions (especially in Giemsa stained chromosomes) as well as bent chromosomes
can make the detection algorithm miss the constriction.
The ability to detect centromere locations can be extended into the field of
radi-ation dosimetry that is required to detect dicentric chromosomes which are metaphase chromosomes with an additional centromere location as a bi product of radiation
ex-posure. Since both centromere locations share similar characteristics, a set of features
designed to detect the primary centromere in principle should be applicable to
de-tect the secondary centromere as well. Once a set of suspected centromere locations
are established, machine learning techniques can be used to reject dicentric false
positives using features that captures the similarity between the two detected
cen-tromere locations and physical constraints such as the minimal distance between the
two centromeres. Therefore the development of an algorithm for accurate centromere
detection which is compatible with high morphological variations of chromosomes from multiple staining methods provides a good foundation for detecting dicentric
chromosomes.
The majority of existing methods for chromosome analysis and centromere
lo-calization involve first calculating the chromosome centerline which is then used as
a basis of measurement for calculating the thickness of the chromosome in order to
Chapter 1: Introduction 4
not utilize the centerline require some special cell preparation techniques for them to operate properly. Although centerline based methods do perform better than other
methods, all existing methods manifest one or more of the following shortcomings.
• Suited to work with only a given type of staining / cell preparation method. The algorithms are designed to utilize some of the features specific to that
particular staining / cell preparation method and therefore would not perform
well for other types of analysis problems.
• The width constriction on higher banded chromosomes can be missed easily due to bends or noise on the chromosome boundary, while chromosomes with sister
chromatid separation tends to mislead the width profile calculation near the
telomeric region.
• The centromere detection result is not accompanied by any indication of either a measure of confidence or a measure of uncertainty. Cytogeneticists often makes critical decisions based on these detection results and false positives and
negatives can have very high life threatening consequences.Therefore a measure
of confidence in the localization would provide the expert with some insight into
the detection process as opposed to a binary decision.
In this research, we explore image processing techniques and combinations to
de-rive or compute various information from chromosome cell images. This information
can be directly or indirectly used for clinical diagnosis and therefore can drastically
reduce the time per patient. Since centerline based methods tend to perform better
than other methods, we have proposed an algorithm which utilizes the centerline
sim-ply to divide the chromosome contour into two nearly symmetric partitions instead
of using it as a basis for measurements. This approach prevents the possibility of
boundary irregularities adversely affecting the centerline and therefore making the
width profile measurements noisy. Once the contour is segmented, we then utilized a Laplacian based thickness measurement algorithm where intensity was integrated
through a weighting scheme to bias the thickness measurement trace lines into
ho-mogenous intensity regions known as chromosome bands. The algorithm is capable
of partitioning the telomere region, detecting evidence of premature sister chromatid
Chapter 1: Introduction 5
the distance from the separating hyperplane was then used as measurement of good-ness of fit in order to find the best centromere candidate from the pool of candidates
for a given chromosome. A Principal Component Analysis (PCA) was performed on
the features that were created for centromere localization in order to gain some
in-sight into the contribution from each feature to the overall variance of the feature set.
A metric called ’Candidate Based Centromere Confidence’ (CBCC) was introduced
which represents the confidence in the selected centromere candidate. This provides
the expert with useful information which he/she can then use in the diagnosis
pro-cess. The proposed algorithm is designed to work with multiple staining methods
and preparation procedures and is tested with a data set containing both Giemsa and DAPI stained cell images collected from multiple sources which were prepared
for distinct clinical reasons. During preliminary testing, the proposed method was
observed to be more accurate and statistically significant compared to a centerline
based method [1]. We have tested the algorithm on a larger data set for further
validation of its performance.
1.1
Contributions
The objective of this research is to develop a set of algorithms that can analyze
hu-man metaphase chromosomes originating from multiple sources with multiple staining
methods. The algorithm is intended to work with chromosomes with high
morpho-logical variations and in the presence of premature sister chromatid separation 1. The centromere detection is identified as a basis for measuring the performance of
the proposed algorithm. Also a metric to yield the confidence in a given centromere
detection was proposed. With the inclusion of the metric, the proposed algorithm
provides experts with additional information regarding the detection process on top
of the typical detection result.
The following are the main contributions of this research divided into 3
cate-gories based on the functionality of the contribution.
Chapter 1: Introduction 6
Improvements to the thickness measurement of chromosomes
• The use of Laplacian algorithm for detecting the width of human chromosomes.
• Incorporating intensity into the Laplacian framework for guiding the width pro-file measurement process more accurately.
Providing additional information relating to a given centromere detection
• Creating a measure for measuring the confidence in a centromere candidate detection using the distance from the separating hyperplane as a measure of
goodness of fit to a label.
Improvements to the applicability of the algorithm
• A chromosome centromere detection algorithm is proposed which is compatible with all chromosome classes and multiple staining methods.
• Combining the advantages of both centerline based methods and their counter-part to come up with a hybrid solution for obtaining the feature profiles.
• A candidate based centromere detection approach facilitates the inclusion of acrocentric and submetacentric chromosomes into the analysis.
Some of the publications related to this dissertation are listed below,
Patent publication
1. US Patent - Centromere detector and method for determining radiation
ex-posure from chromosome abnormalities, United States 8,605,981. PCT No.:
PCT/US2011/059257
Journal publications
1. Akila Subasinghe A. et al. In review - ”Centromere Detection of Human
Metaphase Chromosome Images using a Candidate Based Method”. In
Chapter 1: Introduction 7
2. Peter K. Rogan, Yanxin Li, Asanka Wickramasinghe, Akila Subasinghe, Natasha Caminsky, Wahab Khan, Jagath Samarabandu, Joan H. Knoll, Ruth Wilkins,
and Farrah Flegal.”Automating dicentric chromosome detection from
cytoge-netic biodosimetry data”,Journal of Radiation Protection Dosimetry, 2014.
3. Akila Subasinghe A. et al. ”Intensity integrated Laplacian-based thickness
mea-surement for detecting human metaphase chromosome centromere location”. In
Biomedical Engineering, IEEE Transactions on (TBME), volume 60, pages 2005
2013, July 2013.
4. W. A. Khan, R. A. Chisholm, S. M. Taddayon, A. Subasinghe, J.
Samara-bandu, L. J. Johnston, P. R. Norton, P. K. Rogan, J. H. M. Knoll. ”Relating
centromeric topography in fixed human chromosomes to a-satellite DNA and
CENP-B distribution”, Cytogenetics and Genome Research
Conference publications
1. Akila Subasinghe A. et al. ”Intensity integrated Laplacian algorithm for
hu-man metaphase chromosome centromere detection”. In Electrical Computer
Engineering (CCECE), 2012 25th IEEE Canadian Conference on, May 2012.
2. Rajeev Ranjan, Akila Subasinghe Arachchige, Jagath Samarabandu, Peter K.
Rogan and Joan Knoll. ”Automatic Detection of Pale Path and Overlaps in
Chromosome Images using Adaptive Search Technique and Re-thresholding”,
International Conference on Computer Vision Theory and Applications, 2012.
3. Yanxin Li, Asanka Wikramasinghe, Akila Subasinghe, Jagath Samarabandu,
Joan Knoll, Ruth Wilkins, Farrah Flega, and Peter Rogan. ”Towards Large
Scale Automated Interpretation of Cytogenetic Biodosimetry Data”,
Interna-tional Conference on Information and Automation for Sustainability, 2012.
4. Akila Subasinghe A, Jagath Samarabandu , Joan Knoll, Wahab Khan and Peter
Rogan.”Accurately extracting the centerline from human metaphase
chromo-somes using image processing”. Canadian Student Conference on Biomedical Computing and Engineering (CSCBCE), 2012.
5. Akila Subasinghe A, Jagath Samarabandu , Joan Knoll and Peter Rogan.
Chapter 1: Introduction 8
systems”. Canadian Student Conference on Biomedical Computing and Engi-neering (CSCBCE), 2012.
6. Akila Subasinghe A. et al. ”An accurate image processing algorithm for
de-tecting fish probe locations relative to chromosome landmarks on dapi stained
metaphase chromosome images”. In Seventh Canadian Conference on
Com-puter and Robot Vision (CRV), May 2010.
7. Akila Subasinghe A. et al. ”An image processing algorithm for accurate
extrac-tion of the centerline from human metaphase chromosomes”. In Internaextrac-tional
Conference on Image Processing (ICIP), September 2010.
1.2
Thesis organization
In this chapter we have discussed the problem domain addressed by the proposed
algorithm including its contributions to the literature. Chapter 2 will provide some
insight into the existing literature and provide a basic description of background
methods as well as the anatomy of a chromosome. The proposed algorithm will
be explained in chapter 3 while chapter 4 will provide the results of the proposed algorithm in order to gauge its performance. Chapter 5 will provide a summary of
the conclusions drawn from this research and also provide some future work warranted
9
Chapter 2 Background
The main objective of this chapter is to layout the background information to provide
context for the proposed algorithm described in chapter 3. This includes a brief
intro-duction to human chromosome anatomy followed by a review of the existing literature
and a theoretical background of some of the techniques required to comprehend the
proposed method.
2.1
Introduction to human chromosomes
In every living organism (except some viruses), nucleic acid DNA (deoxyribonucleic
acid) makes up the genetic material. DNA is essentially a double stranded molecule
organized as a double helix which stores the hereditary units known as genes (see
figure 2.1). The smallest unit in this double helix is known a nucleotide which is
composed of Deoxyribose (a 5- Carbon sugar molecule), a phosphate and one of four
nitrogen bases Adenine (A), Cytosine (C), Thymine (T) and Guanine (G). Deoxyri-bose and phosphate bond together to create a twin backbone in the reverse order
on either side of the helix, while connection between the two strands are made by
the relatively weak nitrogenous bonds. These bonds happen in a very specific
or-der wherein, Adenine (A) only connects with Thymine (T) and Cytosine (C) only
connects with Guanine (G) and vice versa. Each of these connections make up a
single base pair. On average, a human chromosome contains about 100 million base
pairs of DNA [11]. The chromosome can contain non-genic regions on top of the
vast abundance of genes. During mitosis (and meiosis), the diffuse network of genetic
material in the nucleus known as chromatin condenses and folds up while giving the chromosome its characteristic shape temporarily only to return to the original state
towards the end of mitosis. During mitosis, chromosomes must ensure that the DNA
matter is separated equally to daughter nuclei during mitosis while maintaining the
Chapter 2: Background 10
When imaged using a light microscope during some stages of mitosis, a healthy human cell image should contain 46 chromosomes. This consists of 22 pairs
(auto-somes) of chromosomes (a number referred as the haploid number in a cell) and two
sex chromosomes X and Y. The presence of two XX chromosomes normally represents
a female while XY would normally specify a male. The 44 autosomes are numbered
from 1-22 in descending order of the length, size and the centromere position of each
of these pairs [12]. Each chromosome in a pair with nearly identical length and
centromere placement are called ’homologous chromosomes’. The karyotype of a
G-banded image given by figure 2.2 shows this nearly identical length and centromere
placement except for the two sex chromosomes (in male subjects). Furthermore, ho-mologous chromosomes carry the same gene sites along their lengths and therefore
have similar genetic potential. In humans (as with any sexually reproducing species),
one of these homologous chromosomes is derived from the paternal parent while the
other from the maternal parent.
A human metaphase chromosome has the following functional regions
(depend-ing on the chromosome type) which can be visually identified as,
• The centromere
• The telomere
• The nucleolar organizer regions
During this research we were mostly interested in the centromere and the
telom-ere regions.
2.1.1
The centromere
Centromere is the condensed or constricted location which holds the two sister
chro-matids together in place. It acts as the site where the spindle fibers attach to during
mitosis [8]. This is the location that is critical in chromosome segregation and cell
di-vision in both meiosis and mitosis. A mistake in the meiosis stage can yield incorrect
number of chromosomes in cells and can lead to disorders such as the ’Down syn-drome’. In many groups of chromosomes, this region in general can be observed as a
clear constriction in relation to the width profile of the chromosome. The centromere
Chapter 2: Background 11
Chapter 2: Background 12
Figure 2.2: A karyotype analysis end result with all 46 chromosomes organized according to their chromosome groups and types (Reproduced with permission from
Chapter 2: Background 13
mitosis called the anaphase. Furthermore, human chromosomes can be grouped into 3 categories based on the location of the centromere with respective to its ends as
follows,
• Metacentric
• Sub-metacentric
• Acrocentric
The centromere of metacentric chromosomes are located near the middle of the chromosome while in acrocentric chromosomes, it is near one of the end points.
Sub-metacentric chromosomes have the centromere between the middle and one of the end
points of the chromosome. All three different types of chromosomes, including the
acrocentric type (with ’nucleolar organizer regions’ or ’satellite stalks’) are depicted
in figure 2.3. Additionally chromosomes that do not possess a functional centromere
are called ’acentric’, while those with two centromere locations are called ’dicentric’.
Most of the time only one of the two centromere locations in a dicentric chromosome
is active during mitosis.
(a) Metacentric (b) Submetacentric (c) Acrocentric
Chapter 2: Background 14
2.1.2
The telomere
The name telomere is derived from the Greek term ’telos’ which means the ’end’.
Apart from the centromere (see figure 2.3), the telomere can be regarded as the
second most important structure of the chromosome. Located at the ends of the
chromosomes, its primary function is to prevent the chromosome from interacting
with other chromosomes in the cell by rendering the ends of the chromosome inert [12]. Therefore telomere regions do not fuse with one another or with other broken ends.
This is important since the ends of broken DNA molecules tend to fuse together easily.
Preventing such unwanted fusions is critical in cell propagation in the organism [13].
2.1.3
The centromere index (CI)
The centromere index (CI) is a measure based on the location of the centromere (see
section 2.1.1) with respect to the ends of a chromosome. The value of this index is
defined using figure 2.4.
Figure 2.4: The lengths used for calculating the centromere index of a given chromosome.
Letlpand lq respectively be the lengths of the short-arm (p-arm) and the
long-arm (q-long-arm) of the chromosome. Then CI is the ratio between the short-long-arm length
to the total length of the chromosome, and is stated as,
CI = lp
lp + lq
Chapter 2: Background 15
Therefore, it can further be observed that the CI value lies in the range of 0 and 0.5. For each chromosome in a cell (based on the chromosome number), the CI
value must fall within a certain small interval. Therefore, the CI value is an important
value that can be used to assist chromosome identification and classification. Table 2.1
below provides CI value ranges for all chromosomes in a human metaphase cell [2].
Table 2.1: Typical range of centromere index (CI) for each human chromosome [2]
Chromosome CI value Chromosome CI value
Number Number
Chapter 2: Background 16
2.2
Review of existing algorithms
With the use of cytogenetical analysis methods, the demand is rising for automated
microscopy systems that can increase throughput while not compromising the
ac-curacy. This is specially the case since the speed of the diagnosis process is highly
dependant on the time required by a trained cytogeneticist to examine the
chromo-some images. Therefore, a significant amount of research has been carried out to
automate these processes in order to present the data in a better way to the experts so that they speed up the diagnosis process. One such attempt where many research
publications have being carried out is Karyotyping, where the algorithm provides an
annotated list of all the 46 chromosome in a Giemsa - banded human cell image.
Fluorescence in situ-Hybridization (FISH) is another such attempt of analysis where
the algorithm is required to detect a fluorescent probe hybridized in the DAPI stained
chromosome body and provide the expert information regarding its positioning with
respect to the chromosome structure. In radiation dosimetry, the objective of the
algorithm is to detect and count the number of dicentric chromosomes in the cell
image, which are by-products of radiation exposure. An expert can utilize this
infor-mation in order to diagnose the amount of radiation exposure and then to prescribe a suitable remedy accordingly. All these methods and approaches rely on obtaining
the following information,
• An accurate segmentation of the chromosome
• An accurate localization of the centromere location
• A mechanism to detect supplementary information such as banding patterns, length of the chromosome etc.
In this section we have provided a detailed literature review of the existing
methods of segmentation and centromere detection.
2.2.1
Segmentation methods
Image segmentation can be defined as the process that partitions a given digital
image into many non-overlapping (disjoint) regions which correspond to individual
Chapter 2: Background 17
Some of the approaches relied on manual segmentation of the chromosomes where a technician had to mark the outline of the chromosome by hand [15], [9]. This was a
very time consuming process which produced subjective results for the segmentation
of each chromosome.
Chromosome cell images generally present a reasonable degree of contrast in
terms of intensity between the objects and the background. In other words, the image
histogram is bi modal and separable. Therefore many of the existing approaches
tend to employ intensity based thresholding in order to segment images [16]. In
one approach Sadina and Mehmet simply segmented the chromosomes using a fixed
threshold value set at 0.9 of the normalized intensity of the Giemsa banded image [17]. Since G-banded image background intensity is higher than the intensity values within
the chromosomes, they marked intensity values less than 0.9 as the object and the
rest as the background. Since general intensity characteristics can change from one
cell image to another, having a fixed intensity level would yield highly inconsistent
segmentation results.
Many of the automated segmentation techniques are performed based on global
thresholding for different staining methods, where the algorithm calculates a
suit-able intensity value in order to separate the bimodal histogram into two segments.
Popescu et al. performed global thresholding on G-banded images using an algorithm termed ’Otsu’s method’ [18] and used this segmentation result as the initial stage of
segmentation in his approach [19]. Similarly, Wolf et al. utilized the same algorithm
for segmentation on DAPI stained images used for FISH [20]. In another approach a
thresholding algorithm called ’Ketler’s method’ [21] was used to globally threshold the
chromosome cell image [22]. Some authors resorted to operate directly on the image
histogram for obtaining the segmentation result. In one such approach, Ji [23]
seg-mented chromosomes by applying a threshold value based on the smoothed histogram
of the chromosome image. This initial value was selected to be the value where the
intensity gradient (slope) of the histogram becomes zero. Then he re-thresholded the first result with a higher threshold value.
Since thresholding is a point operation where each pixel is labeled based on
its intensity value, this method is prone to creating noise in the segmented binary
image. Therefore many authors have attempted to employ both pre processing and
post processing methods to minimize this phenomenon. Gajendran and Rodriguez
Chapter 2: Background 18
post processing step on the threshold output in order to reduce some of this noise content [24], [25]. Wang et al. utilized pre processing approach where a median filter
was used to remove some of the noise in the original image which could lead to a
noisy segmentation result [26], [27]. Then, the thresholded image was subjected to
4-connected component labeling to remove isolated noise in the binary image.
Despite the fact that some of these approaches were successful in significantly
removing noise in the binary segmented output, the global thresholding approach in
general remains highly dependent on the lighting conditions in the image. Uneven
illumination in the cell image can cause the thresholded objects to be noisy and even
discontinuous at some locations. Furthermore, chromosomes could cluster together as one blob if the threshold value is set incorrectly or on the other extreme, even
could break the chromosomes into multiple segments. In some of the approaches,
the threshold value was set locally (adaptively) based on the immediate vicinity of
the chromosome to possibly solve this problem. Enrico et al. attempted this by
dividing the cell image into many tessellations with manually set fixed sizes and
applied thresholding on each of those regions of interests (ROIs) [28].
In general, segmentation using thresholding is highly sensitive to both
quan-tization errors as well as to intensity fading around chromosome boundary regions.
This tends to create a noisy object boundary on the binary output and therefore fails to represent the intricate shape variations of the corresponding chromosome in
the cell image. However, local thresholding could be considered as a very effective
segmentation step when followed by a refining step.
Few methods can be found in literature where parametric active contour
mod-els such as Gradient Vector Flow (GVF) have been utilized for segmentation. GVF
is an improvement of the standard active contour model [29], where limitations
such as the small capture range and lack of convergence into boundary
concavi-ties were addressed [30]. The works of Britto & Ravindran and also Li et al. has
reported significant improvements in chromosome segmentation by using the GVF snake model [31], [32]. However, GVF being a parametric active contour, the global
minima is not guaranteed unless the control points are initialized in the vicinity of
the desired contour (even with the improved capture range). Therefore the contour
could converge to an unwanted local minimum such as a chromosomal band (which
Chapter 2: Background 19
2.2.2
Centromere detection methods
Accurate detection of the centromere location in a chromosome is a critical step in
any automated diagnosis process. The location is characterized by a constriction in
the width and sometimes by a relatively lower intensity region within the body of the
chromosome. The region of darker intensity depends on the specific staining method
and the approach taken by the technicians when preparing the samples. Therefore, the width constriction can be considered as the more universally evident feature
of the centromere location. Centromere localization methods in the literature vary
mainly based on the methodology of obtaining the width profile of the chromosome.
Therefore, methods for centromere detection can be divided into the following two
categories,
• Methods that first calculates the centerline of the chromosome : The morpho-logical centerline of a closed object are defined as the set of all points which
are centers of circles (in 2D case) that are tangent to the shape at more than
one point and that contain no other tangent circles [33]. Once the centerline is
calculated, it will be used as the basis for calculating the width and/or
inten-sity profiles of the chromosome. This is often performed by creating a trellis
structure along the longitudinal axis of symmetry.
• The few methods that do not rely on a calculated centerline as the basis for measurement of the width of the chromosome : The applicability of these
meth-ods are often restricted by the necessity for special preparation techniques or
by morphological conditions.
Medial Axis Transform (MAT) and morphological thinning are the most
com-monly attempted methods of finding the centerline in the literature. Medial axis
transform or skeletonization attempt to reduce the segmented object into a set of
pixels which preserves the extent and connectivity of the original object. One such
attempt was made by Wolf et al., in which the binary segmented image was subjected
to morphological closing (dilation operator followed by the erosion operator) before
applying Medial Axis Transform (MAT) to find the centerline [20]. The rationale
behind applying the closing operator was to smoothen the object boundary before
Chapter 2: Background 20
autonomous. Moradi & Saterahdan proposed a better approach in which the prob-lem of having bifurcations (in the skeleton) towards the ends of the chromosome was
solved [9]. They took the median line of the triangle formed by the two skeletal
segments and the chromosome boundary at the telomere regions. Yet, this method
also fails if the skeleton gives spurious branches away from the telomere regions. In
another attempt, Stanley et al. calculated the feature profiles using a trellis
struc-ture based on a centerline derived using MAT [34]. In all these methods, the main
weakness is the accuracy of the centerline, which can be quite unreliable due to the
occurrence of spurious branches. Furthermore, MAT provides a set of points in space,
rather than a parametric curve that could effectively and easily be used for further calculations.
Thinning on the other hand creates less spurious branches compared to
skele-tonization. These methods are often accompanied by a method for end point extension
since they remove data points from the extreme ends of the centerline [4], [35]. In one
such attempt, Wang et al. applied morphological thinning to the segmented binary
object and then sampled it with a 5-pixel interval. Then these points were
interpo-lated to obtain the chromosome centerline [36],[27]. Gajendran & Rodriguez applied
median filtering to the digital cell image prior to obtaining the thinned centerline of
the chromosomes [24]. Some of the approaches have utilized iterative thinning algo-rithms which preserve the ends of the centerline unlike previous thinning methods. In
one such approach Somasundaram and Kumar used a method called the ’stentiford
thinning algorithm’ in order to obtain the complete centerline of the chromosome [22].
Yet, irregular boundary conditions which are commonly observed in Giemsa stained
images can introduce spurious branches in the thinned centerline.
We have previously proposed an algorithm to calculate the centerline with no
spurious branches irrespective of boundary irregularities or the morphology of the
chromosome [1]. Mohammad proposed an approach where he used our aforementioned
algorithm to derive the centerline and then used a curvature measure to localize the centromere location instead of the width measurements [37]. Despite the lack of
spurious branches, irregular boundary conditions (boundary noise) adversely affect
the centerline derived through these methods. Measurements performed on a noisy
centerline can easily lead to false centromere localization.
Several attempts have been made in order to find suitable methods without
Chapter 2: Background 21
Piper and Erick Granum [38] proposed a two stage approach to find the centerline in which they first determined the orientation of the chromosome by calculating the
minimum width enclosing rectangle. Then, if the chromosome is not highly bent, it
was rotated such that the orientation was vertical and mid points of the horizontal
chromosome slices were connected together to obtain the centerline which was then
smoothed to get the ’poor man’s skeleton’. But, if the chromosome is bent, they
performed a conventional skeletonization algorithm. Yet, the problem with this
ap-proach is the spurious branches that occurred with the conventional skeletonization
process. In another approach [39], chromosomes were sampled into scan lines of
dif-ferent inclinations and after selecting proper cross-sections, the selected mid points were combined to obtain an approximate centerline. The drawback of this method is
that it attempted at getting a polygonal approximation of the centerline instead of
the centerline itself. Results were poor when the segmented chromosome boundaries
were irregular in shape, which is a common occurrence in medial imaging. Gunter
Ritter [40] proposed a method which was based on finding the dominant points of the
chromosome. But, results were not reliable when it was applied to highly bent and
blurred chromosomes.
Due to the non rigid structure of bent chromosomes it has been one of the most
challenging aspects in developing an algorithm for centromere localization. The bend points can introduce spurious branches to morphological operators such as thinning
or MAT and also cause the centerline based method’s trellis structures to miss the
actual centromere location. Most chromosomes bend at the centromere location and
therefore exacerbate these false localizations. Some of our previous work have focused
on getting a centerline without spurious branches [41] while retaining the original
shape and orientation of the chromosome while Piper et al. rotated the chromosome
to align the centerline vertically [38]. Another such centromere detection approach
attempts to straighten bent chromosomes prior to detecting the width minima [42].
The straightening process analyzes the vertical and horizontal projection vectors of the chromosomes calculated at a set of rotation values in order to find the best
rotation to align the centerline vertically [43]. However this algorithm works only
with chromosomes limited to one bending center and is expected work well only on
chromosomes in group E (chromosome numbers 16-18).
There has been some research work in the literature, where the centromere
Chapter 2: Background 22
assigned a membership value for each pixel of DAPI (4’,6-diamidino-2-phenylindole) and FITC (Fluorescein Isothiocyanate) images (with centromere probes) based on an
iterative fuzzy algorithm. However, this method required the use of centromere probes
to mark the location of the centromere. Another work carried out by Moradi [15] and
similarly by Faria [45] (on chromosomes of fish) attempted to find the centromere
loca-tion by getting the horizontal and vertical projecloca-tion vectors of the binary segmented
chromosomes. Both methods did not perform well on acrocentric chromosomes as
well as on chromosomes with a bend greater than 900 degrees.
Considering the above limitations and shortcomings, there exists the need for
a centromere localization algorithm which can perform well with any morphological variation as well as with multiple staining methods. Furthermore, none of the
ap-proaches in literature can correct for artifacts such as sister chromatid separation.
Similarly, we are yet to encounter a centromere localization algorithm which provides
relevant supplementary confidence measurement values for each centromere
localiza-tion.
2.3
Background methods
This dissertation employs a number of existing image processing and machine
learn-ing algorithms. A brief description is given below. For a more detailed description,
the reader is referred to appendix A.
Gradient Vector Flow (GVF) snakes - This is a commonly used active contour
model based segmentation algorithm. GVF uses an edge based static vector field
as the external energy for evolving a set of points which constitutes a closed/open
snake. This segmentation algorithm has a higher capture range and the ability to
converge into boundary concavities better than the standard active contour models. Therefore, this algorithm was used to obtain smooth object boundaries of human
metaphase chromosomes. A detailed description of the GVF snake algorithm along
Chapter 2: Background 23
Discrete Curve Evolution (DCE) - DCE is a polygonal shape simplification al-gorithm which evolves by iteratively deleting vertices of a given polygon based on a
relevance measure. This measure captures the contribution of each individual vertex
to the overall shape of the polygon. In this research, this algorithm was utilized to
locate chromosome salient points in order to partition the object boundary. Appendix
A2 provides a detailed description of the algorithm and the relevance measure along
with the advantages and disadvantages of this approach for detecting salient points.
Support Vector Machine (SVM) - SVM is a powerful kernel based supervised
learning technique. SVM maximizes the margin between the two classes using the training data set. This provides good generalization and therefore is more likely to
perform well with unseen data. Furthermore, the use of kernels to map data into a
higher dimensional space increases the probability of obtaining a better separation
between the class labels. In this research SVM was used as a classifier in
multi-ple learning problems including contour partitioning, shape analysis and centromere
detection. In some instances, the distance from the separating hyperplane
(geomet-ric margin) was used as a measure of goodness of fit of a given sample. The basic
framework of SVM along with the derivation of the classification problem is given in
24
Chapter 3 Proposed algorithm
Detecting abnormalities in the human metaphase chromosome structure is a key stage
in the cytogenetic diagnosis process. Digital image analysis algorithms can speed
up this process to effectively utilize valuable and scarce expert time. However, the
existing algorithms in the literature can only operate on a limited range of shape
variations that a chromosome can exhibit with a specific staining method. Therefore, an algorithm is proposed in this research which could operate with multiple staining
methods and chromosome morphologies. The proposed algorithm is able to perform
segmentation, extract the centerline, detect the centromere location and to detect
and correct for sister chromatid separation. The algorithm also provides cytogenetic
experts with a measure of confidence in a given centromere detection. It is developed
and tested with both DAPI and Giemsa stained images and is readily adoptable to
work with other staining methods.
The algorithm requires the user to manually pick a point within (or close to)
each chromosome in order to proceed with the rest of the process autonomously. The algorithm assumes that the marked chromosome does not either touch or overlap
with other chromosomes in the cell image. This assumption is reasonable due to
the use of a content based ranking algorithm proposed by Kobayashi et al. in this
approach [46]. The output of this algorithm was a ranked set of metaphase images
where chromosome images that were spread well with minimal overlaps and were
complete (contain all 46 chromosomes) were ranked higher. Typically from a given
set of cell images, only the highest ranked 5% were selected for further processing.
This is a critical step required to improve the accuracy of the proposed algorithm.
The proposed algorithm which is designed as a sequential set of processes, is
depicted in the flow diagram given by figure 3.1. The user selected chromosome is first segmented out from the cell image. Next, the centerline of the chromosome
is derived using the binary segmentation result. The algorithm next partitions the
telomere regions of the chromosome in order to detect evidence of sister chromatid
separation. If the presence of sister chromatid separation is detected, the proposed
Chapter 3: Proposed algorithm 25
approximately symmetric partitioning of the contour which is a prerequisite for the IIL (Intensity Integrated Laplacian) thickness measurement algorithm. The
Lapla-cian based thickness measurement algorithm was improved by integrating intensity
information to utilize chromosome intensity bands. Once the thickness measurements
are calculated, the proposed method creates multiple candidates for the centromere
location based on local minima. Next, the candidates are ranked and the best
candi-date is selected as the centromere location. The proposed method then calculates a
measure termed ’Candidate Based Centromere Confidence’ (CBCC) which yields the
confidence of the centromere detection based on the candidates.
The proposed algorithm will be explained in the following five functional stages,
• Preprocessing and segmentation (discussed in section 3.2)
• Finding the chromosome centerline (discussed in section 3.3)
• Contour partitioning & correcting for sister chromatid separation (discussed in section 3.4)
• Laplacian based thickness measurement (discussed in section 3.5)
• Candidate based centromere detection (discussed in section 3.6)
3.1
The data set
The research was carried out as a part of a combined effort for developing a set of algorithms to perform dicentric chromosome detection. Samples of peripheral blood
lymphocytes were prepared to obtain metaphase cells, then metaphase cells were
stained with either Giemsa or DAPI, imaged and analyzed in laboratories at Health
Canada (Dr. Ruth Wilkins), Atomic Energy of Canada Ltd (Ms. Farrah Flegal)
and the University of Western Ontario (Dr. Joan Knoll, Pathology Dept). Figure 3.2
provides an example for the two staining methods used for this research. The complete
data set used for developing and testing the algorithm discussed in this dissertation
consists of 40 metaphase cell images including 38 from biodosimetry samples and 2
from clinical cytogenetic samples. The chromosome data set comprised images of 18 Giemsa stained cells and 22 DAPI stained cells. These metaphase images were
Chapter 3: Proposed algorithm 26
Chapter 3: Proposed algorithm 27
was to gather a representative sample of cells from both DAPI and Giemsa stained images with no bias to the length of the chromosomes. In the case of DAPI images,
the selection was performed to include chromosomes with and without premature
sister chromatid separation which captures a large degree of morphological variations.
Furthermore, the selected cell images had a good spread of chromosomes (containing
all 46 chromosomes) with minimal touches and overlaps which is a feature that enables
the algorithm to extract more chromosomes from each cell image.
(a) (b)
Figure 3.2: Shows two cell images with different staining methods. Figure 3.2(a) contains a cell image with DAPI staining while figure 3.2(b) is a Giemsa stained
image.
The data collection process for the experiment was performed using the Matlab
version of the algorithm while a converted and parallelized C++ version of the
algo-rithm (termed ADCI - Automated Dicentric Chromosome Identifier) was developed
and tested by the combined efforts of Mr. Asanka Wickramasinghe and Mr. Yanxin Li. For the data collection, the chromosomes were manually selected in order to pick
all possible chromosomes with no touches or overlaps with neighboring chromosomes
(judged visually). The interface required the operator to select a point within or in
the vicinity of the chromosome of interest while the rest of the process was fully
auto-mated. Some control was given to the operator to hard segment the chromosomes in
cases where separation was possible with minimal change of the threshold value (in
cases of chromosomes that are barely touching each other). This was obtained using
a thresholding factor (default value of 1.00) which was used to multiply the Otsu’s

![Table 2.1: Typical range of centromere index (CI) for each human chromosome [2]](https://thumb-us.123doks.com/thumbv2/123dok_us/7786655.1288437/28.612.161.486.226.436/table-typical-range-centromere-index-ci-human-chromosome.webp)
![Figure 3.7: Two chromosomes and their skeletonization [3] and morphological](https://thumb-us.123doks.com/thumbv2/123dok_us/7786655.1288437/49.612.119.531.207.494/figure-chromosomes-skeletonization-morphological.webp)