Measurements of the vector boson production with the ATLAS
detector
A. Lapertosa1,2,, on behalf of the ATLAS Collaboration
1Università degli Studi di Genova
2INFN Sezione di Genova
Abstract. Measurements of the Drell-Yan production ofW andZbosons at the LHC provide a benchmark of our understanding of perturbative QCD and probe the proton structure in a unique way. The ATLAS collaboration has performed new high precision measurements at a center-of-mass energy of 7 TeV. The measurements are performed for
W+,W−andZbosons integrated and as a function of the boson or lepton rapidity and theZmass. Unprecedented precision is reached and strong constraints on Parton Distri-bution Functions, in particular the strange density are found. Zboson cross sections are also measured at center-of-mass energies of 8 TeV and 13 TeV, and cross-section ratios to the top-quark pair production have been derived. This ratio measurement leads to a can-cellation of systematic effects and allows for a high precision comparison to the theory predictions. The production of jets in association with vector bosons is a further important process to study perturbative QCD in a multi-scale environment. The ATLAS collabo-ration has performed new measurements ofZboson plus jets cross sections, differential in several kinematic variables, in proton-proton collision data taken at a center-of-mass energy of 13 TeV. The measurements are compared to state-of-the art theory predictions. They are sensitive to higher-order pQCD effects, probe flavour and mass schemes and can be used to constrain the proton structure. In addition, a new measurement of the splitting scales of thektjet-clustering algorithm for final states containing aZboson candidate at a center-of-mass energy of 8 TeV is presented.
1 Introduction
The production ofWandZbosons via the Drell-Yan process is widely studied at the LHC experiments with proton-proton collision, including the ATLAS experiment [1]. Those processes have a clear signature (especially in the lepton decay channels: Z → llandW → lν) and are characterized by small background contamination. Due to the high production cross section, it is possible to collect large statistics samples of events containing vector bosons.
W andZ boson events, in turn, are common backgrounds in Standard Model measurements, in-cluding Higgs boson measurements, and in new physics searches. As a consequence, an improved description of the vector boson production has a positive impact in many ATLAS physics analyses.
Nevertheless, studying in details the production of vector bosons is useful to test the Standard Model accuracy and extract its parameters. It is possible to probe the proton structure, costraining
Parton Distribution Functions (PDFs), and to test the perturbative QCD theory, comparing experi-mental results to state-of-the-art predictions.
In this review, a selection of seven of the most recent ATLAS results on vector boson physics will be presented:WandZboson production cross section at 7 TeV [2] and 13 TeV [3]; ratio oftt¯overZ boson production cross section at 7, 8 and 13 TeV [4];Z+jets production cross section at 13 TeV [5]; triple differentialZboson cross section at 8 TeV [6]; angular coefficients ofZboson leptons [7] and splitting scales of anti-ktalgorithm clustered jets [8], both measured with 8 TeV data.
2
W
and
Z
boson cross section at 7 TeV
Several high precision vector boson cross section measurements have been performed on 4.6 fb−1
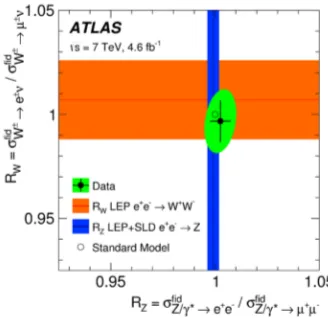
7 TeV data, both inclusive and differential. Very good agreement is found between the ATLAS results and the Standard Model in terms of lepton universality, with the measurement of theW →eν/W→µν
ratio and theZ→ee/Z→µµratio, both found to be compatible with unity (see Fig.1).
Figure 1.Measurement of the electron-to-muon cross-section ratios for theWandZbosons. The green shaded ellipse represents the 68% CL for the correlated measurement ofWandZratios, while the black error bars give the one-dimensional standard deviation. The orange and blue shaded bands represent the combination of the ratios as measured at the LEP and SLACe+e−colliders. The SM expectation is indicated with an open circle. Taken from Ref. [2].
The measurement of theW→lν/Z→llratio is sensitive to the strangeness content of the proton. The experimental precision reached is comparable and sometimes better than the one on theoretical predictions. The ATLAS result is compared with predictions obtained adopting different PDFs; in all cases, the predicted cross section ratio values are higher than those measured in data (see Fig. 2), clearly pointing out the need for improvements in the description of the proton structure.
TheW boson charge asymmetry Al, measured as a function of the pseudorapidity of the lepton
|ηl|, defined as:
Al= dσW+/d|ηl| −dσW−/d|ηl|
Parton Distribution Functions (PDFs), and to test the perturbative QCD theory, comparing experi-mental results to state-of-the-art predictions.
In this review, a selection of seven of the most recent ATLAS results on vector boson physics will be presented:WandZboson production cross section at 7 TeV [2] and 13 TeV [3]; ratio oftt¯overZ
boson production cross section at 7, 8 and 13 TeV [4];Z+jets production cross section at 13 TeV [5]; triple differentialZboson cross section at 8 TeV [6]; angular coefficients ofZboson leptons [7] and splitting scales of anti-ktalgorithm clustered jets [8], both measured with 8 TeV data.
2
W
and
Z
boson cross section at 7 TeV
Several high precision vector boson cross section measurements have been performed on 4.6 fb−1
7 TeV data, both inclusive and differential. Very good agreement is found between the ATLAS results and the Standard Model in terms of lepton universality, with the measurement of theW→eν/W→µν ratio and theZ→ee/Z→µµratio, both found to be compatible with unity (see Fig.1).
Figure 1.Measurement of the electron-to-muon cross-section ratios for theWandZbosons. The green shaded
ellipse represents the 68% CL for the correlated measurement ofWandZratios, while the black error bars give the one-dimensional standard deviation. The orange and blue shaded bands represent the combination of the ratios as measured at the LEP and SLACe+e−colliders. The SM expectation is indicated with an open circle. Taken from Ref. [2].
The measurement of theW→lν/Z→llratio is sensitive to the strangeness content of the proton. The experimental precision reached is comparable and sometimes better than the one on theoretical predictions. The ATLAS result is compared with predictions obtained adopting different PDFs; in all cases, the predicted cross section ratio values are higher than those measured in data (see Fig. 2), clearly pointing out the need for improvements in the description of the proton structure.
TheW boson charge asymmetry Al, measured as a function of the pseudorapidity of the lepton
|ηl|, defined as:
Al= dσW
+/d|ηl| −dσW−/d|ηl|
dσW+/d|ηl|+dσW−/d|ηl|, (1)
is found to be in good agreement with the predictions (see Fig. 3), with an accurancy better than 1% across the whole range considered (|η|<2.5).
Figure 2. Fiducial cross sections times leptonic branching ratios of theW → lν/Z→llratio. The data (solid
blue line) are shown with the statistical (yellow band) and the total uncertainties (green band). The uncertainties of the theoretical calculations correspond to the PDF uncertainties only. Taken from Ref. [2].
Figure 3. Left: lepton charge asymmetryAlproduction as a function of the lepton pseudorapidity. Right: Z
boson differential cross-section measurement as a function of the leptons rapidity|yll|. Predictions computed at NNLO QCD with NLO EW corrections using various PDF sets (open symbols) are compared to the data (full points). The ratio of theoretical predictions to the data is also shown. The predictions are displaced within each bin for better visibility. The theory uncertainty corresponds to the quadratic sum of the PDF uncertainty and the statistical uncertainty of the calculation. Taken from Ref. [2].
TheZboson production cross section measured as a function of the leptons rapidity|yll|is found
to be in agreement with predictions for values of|yll| > 1, while for |yll| < 1 the predictions are
underestimating the data results (see Fig. 3). This discrepancy can be interpreted as enhanced PDF strangeness content.
Figure 4. Left: Rsratio of the PDFs from the present ATLAS-epWZ16determination shown in the region of maximum sensitivity of the ATLAS data, 10−3<x<10−1. Uncertainty bands represent the experimental (exp),
model (mod) and parameterization (par) components in red, yellow and green, respectively. Right: Rs in the region of ATLAS best sensitivity,Q2 =1.9 GeV2 and x=0.023. Bands: present result and its uncertainty
contributions from experimental data, QCD fit, and theoretical uncertainties; Closed symbols with horizontal error bars: predictions from different NNLO PDF sets; Open square: previous ATLAS resuls. Taken from Ref. [2].
shows unsuppressed strangeness as a function ofBjorken-x; in particular, the variableRs, built as:
Rs= s+s¯ ¯
u+d¯, (2)
is found to be higher than unity in the xrange considered (10−3 < x < 10−1), with larger model
uncertainties in the high and lowxregions (see Fig. 4). The ATLAS data have the best sensitivity in the region withQ2=1.9 GeV2andx=0.023, where theRsis measured to be 1.13±0.05 (exp) ±0.02 (mod)+0.01
−0.06 (par). With this high precision measurements, ATLAS is definitely accessing the
proton structure.
3
W
and
Z
boson cross section at 13 TeV
TheW+,W−,W±andZboson production cross sections have been measured separately in the lep-ton decay channels with 81 pb−1 13 TeV data, within the fiducial region defined by the detector
acceptance. The ATLAS results are compared to theoretical predictions obtained with different PDFs, showing good agreement with many of them. The precision obtained is of the order of 2% onWboson and 1% onZboson cross section, excluding the 2.1% uncertainty due to the luminosity determination (see Fig. 5).
The cross section ratios benefit from significant cancellation of experimental uncertainties, result-ing in higher constrainresult-ing power. TheW+/W−ratio measured by ATLAS is found to be sistematically lower than the predictions, showing better agreement with the CT14 and MMHT14 PDFs. TheW/Z
Figure 4. Left: Rs ratio of the PDFs from the presentATLAS-epWZ16determination shown in the region of maximum sensitivity of the ATLAS data, 10−3<x<10−1. Uncertainty bands represent the experimental (exp),
model (mod) and parameterization (par) components in red, yellow and green, respectively. Right: Rs in the region of ATLAS best sensitivity,Q2 =1.9 GeV2 and x=0.023. Bands: present result and its uncertainty
contributions from experimental data, QCD fit, and theoretical uncertainties; Closed symbols with horizontal error bars: predictions from different NNLO PDF sets; Open square: previous ATLAS resuls. Taken from Ref. [2].
shows unsuppressed strangeness as a function ofBjorken-x; in particular, the variableRs, built as:
Rs= s+s¯ ¯
u+d¯, (2)
is found to be higher than unity in the xrange considered (10−3 < x < 10−1), with larger model
uncertainties in the high and lowxregions (see Fig. 4). The ATLAS data have the best sensitivity in the region withQ2 =1.9 GeV2andx=0.023, where theRsis measured to be 1.13±0.05 (exp) ±0.02 (mod)+0.01
−0.06 (par). With this high precision measurements, ATLAS is definitely accessing the
proton structure.
3
W
and
Z
boson cross section at 13 TeV
TheW+,W−,W±andZ boson production cross sections have been measured separately in the lep-ton decay channels with 81 pb−1 13 TeV data, within the fiducial region defined by the detector
acceptance. The ATLAS results are compared to theoretical predictions obtained with different PDFs, showing good agreement with many of them. The precision obtained is of the order of 2% onWboson and 1% onZboson cross section, excluding the 2.1% uncertainty due to the luminosity determination (see Fig. 5).
The cross section ratios benefit from significant cancellation of experimental uncertainties, result-ing in higher constrainresult-ing power. TheW+/W−ratio measured by ATLAS is found to be sistematically lower than the predictions, showing better agreement with the CT14 and MMHT14 PDFs. TheW/Z
ratio is found to be compatible with the different predictions, within the uncertainty. Both resuts are shown in Fig. 6.
fid ) meas σ / pred σ ( 0.85 0.9 0.95 1 1.05 1.1 1.15 ATLAS -1
13 TeV, 81 pb
(inner uncert.: PDF only)
Z ± W + W -W experimental uncertainties ⊕ luminosity experimental uncertainties MMHT14nnlo68CL NNPDF3.0 CT14nnlo ABM12 ATLAS-epWZ12nnlo HERAPDF2.0nnlo
Figure 5.Ratio of the predicted to measured fiducial cross section for the combined electron and muon channels using various PDFs. The inner (outer) band corresponds to the experimental uncertainty without (with) the luminosity uncertainty. The inner error bar of the predictions represents the PDF uncertainty while the outer error bar includes the sum in quadrature of all other systematic uncertainties. Taken from Ref. [3].
-W fid σ / + W fid σ 1.2 1.22 1.24 1.26 1.28 1.3 1.32 1.34
ATLAS -1
13 TeV, 81 pb
total uncertainty ± data stat. uncertainty ± data ABM12 CT14nnlo NNPDF3.0 MMHT14nnlo68CL ATLAS-epWZ12nnlo HERAPDF2.0nnlo -W fid σ / + W fid σ = -/W + W R Z fid σ / ± W fid σ 9.4 9.6 9.8 10 10.2 10.4 10.6 10.8
ATLAS -1
13 TeV, 81 pb
total uncertainty ± data stat. uncertainty ± data ABM12 CT14nnlo NNPDF3.0 MMHT14nnlo68CL ATLAS-epWZ12nnlo HERAPDF2.0nnlo Z fid σ / ± W fid σ = W/Z R
Figure 6.Ratios (red line) ofW+toW−boson (left) andWtoZboson (right) combined production cross sections in the fiducial region compared to predictions based on different PDF sets. The inner (yellow) shaded band cor-responds to the statistical uncertainty while the outer (green) band shows statistical and systematic uncertainties added in quadrature. The theory predictions are given with only the corresponding PDF uncertainties shown as error bars. Taken from Ref. [3].
4
t
t
¯
over
Z
boson cross section at 7, 8 and 13 TeV
Thett¯/Zcross section ratio has been measured at 7, 8 and 13 TeV: results are given directly for each
considered√sand also as double ratios of the two processes at different√s. The results are corrected to a common phase space and, furthermore, the systematic uncertainties are properly correlated among measurements. The cross section ratioRtt¯/Zis defined as:
Rtt¯/Z= σtt¯
0.5(σZ→ee+σZ→µµ), (3)
whereσZ→eeandσZ→µµare theZboson cross section measured in the electron and the muon channel, respectively.
Figure 7.Thett/Z¯ cross section ratio for√s=7 TeV (left) and 8 TeV (right): results are compared to predictions
based on different PDF sets. The inner shaded band corresponds to the statistical uncertainty, the middle band
to the statistical and experimental systematic uncertainties added in quadrature, while the outer band shows the total uncertainty, including the luminosity uncertainty which almost entirely cancel in these ratios. The theory predictions are given with the corresponding PDF uncertainties shown as inner bars while the outer bars include all other uncertainties added in quadrature. Taken from Ref. [4].
Figure 8. Impact of the ATLASZ boson andtt¯cross-section data on the determination of PDFs. The bands
represent the uncertainty for theATLAS-epWZ12PDF set and the uncertainty of the profiledATLAS-epWZ12
PDF set usingZboson andtt¯data as a function ofxfor the total light-quark-sea distribution (left) for the gluon density (right). The plots also show the impact of only including the ATLAStt¯data set. Taken from Ref. [4].
The six measured cross sections (tt¯andZ cross sections at 7, 8 and 13 TeV) are used together within a profile fit to further constrain theATLAS-epWZ12PDF: significant reductions of the uncer-tainties are obtained for the gluon distribution function forxvalues near 0.1 and for the light-quark sea forx<0.02 (see Fig. 8).
5
Z
+
jets production cross section at 13 TeV
The measurements of the production cross section of aZ boson in association with jets is performed on 3.16 fb−113 TeV data. Inclusive and differential cross sections are measured for events containing
aZ boson decaying to electrons or muons and produced in association with up to seven jets with
Figure 7.Thett/Z¯ cross section ratio for√s=7 TeV (left) and 8 TeV (right): results are compared to predictions
based on different PDF sets. The inner shaded band corresponds to the statistical uncertainty, the middle band
to the statistical and experimental systematic uncertainties added in quadrature, while the outer band shows the total uncertainty, including the luminosity uncertainty which almost entirely cancel in these ratios. The theory predictions are given with the corresponding PDF uncertainties shown as inner bars while the outer bars include all other uncertainties added in quadrature. Taken from Ref. [4].
Figure 8. Impact of the ATLASZboson andtt¯cross-section data on the determination of PDFs. The bands
represent the uncertainty for theATLAS-epWZ12PDF set and the uncertainty of the profiledATLAS-epWZ12
PDF set usingZboson andtt¯data as a function ofxfor the total light-quark-sea distribution (left) for the gluon density (right). The plots also show the impact of only including the ATLAStt¯data set. Taken from Ref. [4].
The six measured cross sections (tt¯andZ cross sections at 7, 8 and 13 TeV) are used together within a profile fit to further constrain theATLAS-epWZ12PDF: significant reductions of the uncer-tainties are obtained for the gluon distribution function forxvalues near 0.1 and for the light-quark sea forx<0.02 (see Fig. 8).
5
Z
+
jets production cross section at 13 TeV
The measurements of the production cross section of aZboson in association with jets is performed on 3.16 fb−113 TeV data. Inclusive and differential cross sections are measured for events containing
aZ boson decaying to electrons or muons and produced in association with up to seven jets with
pT >30 GeV and|y|<2.5. The data results are compared to different order predictions: in general,
Figure 9.Left: measured cross section as a function of the leading jetpT for inclusive Z+≥1,2,3,4 jet events.
Right: measured cross section as a function of the inclusive jet multiplicity for Z+jets events. The data are
compared to the predictions fromZ+≥1 jet Njetti NNLO (pTspectra only), BLACKHAT+SHERPA, SHERPA 2.2, ALPGEN+PY6, MG5_aMC+PY8 CKKWL, and MG5_aMC+PY8 FxFx. The error bars correspond to
the statistical uncertainty, and the hatched bands to the data statistical and systematic uncertainties (including luminosity) added in quadrature. Taken from Ref. [5].
good agreement is found within the uncertainties with the generators which use next-to-leading-order matrix elements and the more recent next-to-next-to-leading-order fixed-order predictions.
In particular, leading-order predictions are observed to have a too hard jetpT spectrum compared
to data, for values of jetpT >200 GeV. Regarding the jet multiplicity observable, the models
consid-ered are sensibly underestimating or overestimating the data results for high jet multiplicity (number of jets higher than 4). Both results are shown in Fig. 9.
6 Triple differential
Z
boson cross section at 8 TeV
TheZboson differential cross section in the lepton decay channel has been measured with 20.2 fb−1 8 TeV data. The results are presented as a function of the invariant massmll, the dilepton rapidity|yll|,
and the angular variablecosθ∗, between the outgoing lepton and the incoming quark in the Collins-Soper frame.
The cross sections are used to determine theZboson forward-backward asymmetryAFB, defined
as:
AFB=d
3σ(cosθ∗>0)−d3σ(cosθ∗<0)
d3σ(cosθ∗>0)+d3σ(cosθ∗<0), (4)
as a function ofmlland|yll|.
The forward-backward asymmetry is found to change sign at theZ boson mass and to increase with|yll|, as expected.AFBvalues are compatible with 0 formllclose toZboson mass, while they are
Figure 10.Fiducial cross section as a function ofmll, the dilepton rapidity|yll|in the invariant mass range close to theZboson mass. The data are shown as solid markers and the prediction from Powheg is shown as the solid line. The inner error bars represent the data statistical uncertainty and the solid band shows the total experimental uncertainty. The contribution to the uncertainty from the luminosity measurement is excluded. The hatched band represents the statistical and PDF uncertainties in the prediction. Taken from Ref. [6].
The measurements achieve high-precision (1% level, excluding the uncertainty in the integrated luminosity) and are in agreement with predictions, with a slight tendency of the prediction to under-estimate the data results, as can be seen in Fig. 10.
7 Drell-Yan lepton angular correlations
The angular correlations between lepton pairs has been measured with 20.3 fb−1 8 TeV data, in the
invariant mass region close toZboson mass. The complete set of angular coefficientsA0−7is extracted by polinomial decomposition of the lepton polarθand azimuthalφangular variables, measured in the Z boson Collins-Soper frame.
Results are compared to several available next-to-next-to-leading-order predictions. Evidence is found for nonzeroA5,6,7observables, consistent with expectations. The observableA0−A2, built as the
difference betweenA0andA2, is found to be higher than zero, as expected, when introducing higher order corrections. All the predictions are observed to be a factor of 2 lower than the data results (see Fig. 11).
8 Anti-
k
tjet splitting scales
Splitting scales of the jets produced in association with aZboson, clusterized with the anti-kt
algo-rithm [9], are measured with 20.2 fb−18 TeV data. Starting from charged particle tracks as input, jets
are clusterized according to the minimum distance criteria: minimum distance between the tracks or between the tracks and the beam axes. After the jet clusterization, the splitting scales√dkare defined
as the square root ofdk, where:
Figure 10.Fiducial cross section as a function ofmll, the dilepton rapidity|yll|in the invariant mass range close to theZboson mass. The data are shown as solid markers and the prediction from Powheg is shown as the solid line. The inner error bars represent the data statistical uncertainty and the solid band shows the total experimental uncertainty. The contribution to the uncertainty from the luminosity measurement is excluded. The hatched band represents the statistical and PDF uncertainties in the prediction. Taken from Ref. [6].
The measurements achieve high-precision (1% level, excluding the uncertainty in the integrated luminosity) and are in agreement with predictions, with a slight tendency of the prediction to under-estimate the data results, as can be seen in Fig. 10.
7 Drell-Yan lepton angular correlations
The angular correlations between lepton pairs has been measured with 20.3 fb−18 TeV data, in the
invariant mass region close toZboson mass. The complete set of angular coefficientsA0−7is extracted by polinomial decomposition of the lepton polarθand azimuthalφangular variables, measured in the Z boson Collins-Soper frame.
Results are compared to several available next-to-next-to-leading-order predictions. Evidence is found for nonzeroA5,6,7observables, consistent with expectations. The observableA0−A2, built as the
difference betweenA0andA2, is found to be higher than zero, as expected, when introducing higher order corrections. All the predictions are observed to be a factor of 2 lower than the data results (see Fig. 11).
8 Anti-
k
tjet splitting scales
Splitting scales of the jets produced in association with aZboson, clusterized with the anti-kt
algo-rithm [9], are measured with 20.2 fb−18 TeV data. Starting from charged particle tracks as input, jets
are clusterized according to the minimum distance criteria: minimum distance between the tracks or between the tracks and the beam axes. After the jet clusterization, the splitting scales √dkare defined
as the square root ofdk, where:
dk=min(di j,dib), (5)
Figure 11. Distributions of the angular coefficientsA0−A2as a function of pZT. The results are compared to
the DYNNLO and POWHEG MINLO predictions (left) and various SHERPA predictions (right). The error bars for the calculations show the total uncertainty for DYNNLO, but only the statistical uncertainties for POWHEG MINLO and SHERPA. Taken from Ref. [7].
Figure 12. Charged-only distributions for the 0-th (left) and the 7-th (right) splitting scales in the electron
channel using the jet-radius parameter R=0.4. The size of the error bars reflects the statistical uncertainty, while
the combined statistical and systematic uncertainty is indicated by the grey band. Theoretical predictions from SHERPA with NLO multijet merging (MEPS@NLO) and from POWHEG+PYTHIA8 with NNLO matching
(NNLOPS) are displayed including error bands for the generator uncertainties. Taken from Ref. [8].
withdi jdefined as:
di j =min(p2T,i,p2
T,j)×
∆R2i,j
R2 , (6)
anddibas:
dib=p2T,i. (7)
With this definition, the 0-th order splitting scale corresponds to thepTof the leading jet, while the
N-th order of N-the splitting scale can be interpreted as N-the distance at which aNjet event can be resolved as aN+1 jet event.
9 Conclusion
High precision ATLAS measurements of vector boson observables have been performed with 7, 8 and 13 TeV data. In several measurements, the experimental precision has been higher than the prediction one: in particular, the uncertainty had been further reduced in theW+/W−,W/Zandtt¯/Zcross section ratio measurements, due to the factorization of some systematic uncertainties.
The results have be exploited to improve theATLAS-epWZ12PDF precision and to derive the new version of the ATLAS based PDF,ATLAS-epWZ16, having reduced uncertainty compared to the previous version and showing unsuppressed strangeness content.
Several results are found to confirm the needs for higher order corrections. The remaining dis-crepancies will motivate further work to improve the precision and the modelling of the predictions. ATLAS precision measurements are therefore a powerful mean to improve our understanding of per-turbative QCD.
References
[1] ATLAS Collaboration, JINST3, S08003 (2008)
[2] ATLAS Collaboration, Eur. Phys. J. C77, 367 (2017),1612.03016
[3] ATLAS Collaboration, Phys. Lett. B759, 601 (2016),1603.09222
[4] ATLAS Collaboration, JHEP02, 117 (2017),1612.03636
[5] ATLAS Collaboration, Eur. Phys. J. C77, 361 (2017),1702.05725
[6] ATLAS Collaboration, Submitted to JHEP (2017),1710.05167
[7] ATLAS Collaboration, JHEP08, 159 (2016),1606.00689
[8] ATLAS Collaboration, JHEP08, 026 (2017),1704.01530