ISSN 2348 – 7968
Simulation and Experimental Testing of a PV Panel at Different
Operating Conditions
Abdullateef A. Jadallah, Dhari Y. Mahmood and Zaid A. Abdulqader
Department of Electromechanical Engineering, University of Technology Baghdad, Hay-alwihda, Iraq
Abstract
Solar energy is one of multi solutions to solve the problem of high electricity demand growth. This paper focuses on modeling and simulation of solar radiation and photovoltaic system using MATLAB software. Simulation results were compared with experimental work using photovoltaic panel. A good degree of agreement between the experimental and simulation results is achieved. The PV used has 36 monocrystalline silicon cells connected together in series and tested at Cranfield University-UK (52o North) on 17th July 2014. The simulation results show that power of the proposed model at nominal conditions is 50.5W while the actual PV panel produces 50 W under the same conditions experimentally. Collector tilt angle was taken in account as well. The simulation code can select the optimum tilt angle that gives the maximum solar radiation and extract the maximum power point from P-V characteristics of the PV module.
Keywords: photovoltaic, simulation, solar radiation, PV module
1. Introduction
Solar energy considered as a very important condition of life on the earth. It can be used for heating, cooling and power generation. In addition, it may be used with wind energy, biomass, hydropower and other sources [1,2]. Solar radiation can be transformed to electric power using photovoltaic effect of semiconductor. The performance of PV panel is highly affected by collector tilt angle which defined as the angle of panel with respect to horizontal. The optimal tilt angle of fixed PV panel is related to the local climatic conditions such as geographic location and period of its use [3]. Solar radiation influenced by sunshine hours duration and average monthly values of cloudiness [4]. Angstrom [5] gave a relation between mean daily sunshine duration ‘n’ and the mean daily global solar radiation ‘h’ Angstrom’s formula is quite convenient to use but it does not consider the effect of latitude and altitude of the station. C. Jena et.al. [6] developed a PV simulink module with Buck – Boost converter in order to investigate I-V and P-V characteristics of typical 36 W solar module. Mboumboue E. et.al, [7] proposed a simple method of modeling and simulation of photovoltaic panels using MATLAB software package. This paper proposed a simulation program using MATLAB that represents a complete solar photovoltaic system. Firstly, the program was to execute the sun earth main angles then it estimates the sun radiation (extraterrestrial, global, diffuse and beam
radiation). In addition, the collector tilt angle effect was taken in account in order to get monthly average daily total radiation. The next step was to estimate I-V and PV characteristics of PV panel. Calculated results from the computational software were compared with the actual results using 50 W PV panel installed in the ePAD Laboratory of Cranfield University under different conditions. The practical work includes using maximum power point tracking and dc-dc boost converter that delivers the power to dc brushless motor as a load.
2. Methodology
The most effective parameter on photovoltaic power is solar radiation. Estimation of the sun earth main angles such as latitude angle, declination angle, hour angle, incidence angle etc. were calculated according to the methodology found in [Soteris K 8].
In order to get the power from PV panel, it is important to know the amount of solar radiation that fall on the panel. The monthly average daily global extraterrestrial solar radiation for a given month was calculated on the plane normal to the radiation on the nth day of the year outside the atmosphere presented as follows [9].
(1)
The monthly Average daily global radiation the following formula can be calculated as follows [9].
(2) a = 0.25 and b = 0.5 are recommended and applicable anywhere in the world [10].
Basing on estimation of monthly average daily global radiation and clearance index, the monthly average daily diffused radiation may be given as follows:
(3) In addition it is possible to calculate the monthly average
beam radiation as following:
ISSN 2348 – 7968
For tilted collector, the ratio of the monthly total radiation on tilted surface HT to the monthly global radiation on horizontal surface may be obtained by [9]:
(5)
The mathematical model that employed to define the PV cell I-V characteristics was proposed by Bishop (1988). Based on the equivalent circuit shown in figure (1). The mathematical formulation of PV cell current is described as follow [11]:
(6)
Figure (1): Equivalent circuit of PV cell
Shunt and series resistances can be neglected because the hunt resistance magnitude is usually much higher than the load resistance, while the series resistance is much less than load resistance. So, less power is dissipated within the cell. In addition, in case of short circuit the voltage will be zero and photon current equal to short circuit current. Therefore, equation (6) will be reduced as follows:
(7)
In case of open circuit, cell current will be equal to zero and the voltage is then equal to open circuit voltage.
(8)
PV cell power can be estimated at each operating point using following expression:
(9)
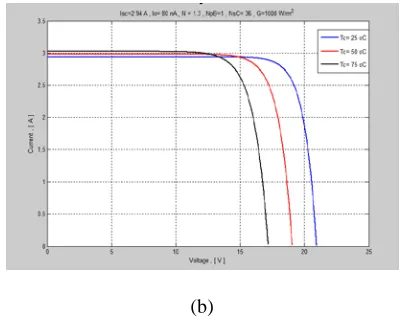
Figure (2) shows I-V and PV characteristics of PV cell which have 2.94A of short circuit current under nominal irradiation ( 1000 W/m2), cell temperature ( 25 oC ) and ( 554 mm * 636 mm) collector dimensions. When the
current equal to zero, the voltage is be equal to the open circuit voltage while, when the voltage equal to zero the current is equal to short circuit current. Between open and short circuit, the cell output power is greater than zero. The maximum cell power can be estimated by multiplication of maximum voltage and maximum current to achieve MPP.
Figure (2): I-V and P-V characteristics of photovoltaic cell.
PV modules are constructed from certain number of cells connected in parallel or in series or combined of series and parallel according to required design. The series connection is used in to get higher voltage (if two cells connected in series the voltage will be doubled) and the parallel connection is used to get higher current (if two cells connected in parallel the current will be doubled). Depending on the number of cells connected in series and number of branches connected in parallel module current can be expressed in the following formula [12].
(10)
In this work, 36 cells connected together in series in order to fix the cell current which can be calculated as below and increase the module voltage as shown in figure (3).
ISSN 2348 – 7968
3. Simulation:
The photovoltaic system was modeled and then simulated in suitable software built using MATLAB (m-file) in order to get a theoretical representation of this methodology. Figure (4) shows the signal flow chart of computational software.Input parameters such as nominal operation conditions, number of cells, bright sunshine hours, diode ideality factor of PV cell and latitude angle were set. Main angles are the first computed. Their values depend on the latitude angle, number of days (date) and solar time. Solar irradiance changes according to south directivity, season, month and even hours within day as well. The previous computation was applied to all months of the year by iterative conditional loop. Tilt angle effect was employed in simulation programming in order to identify the optimum tilt angle. For each month, the tilt angle varies from 0o to 90o with respect to horizontal level. The optimum solar irradiance could be specified by the simulation code which meets with the optimum tilt angle and this optimum irradiance used as input parameter to photovoltaic model in order to estimate I-V and P-V characteristics of PV module.
Figure (4): Signal Flow Chart of Simulation Program.
4. Experiments:
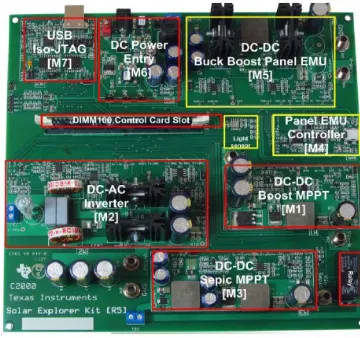
Experimental work was conducted in the ePDA laboratory at Cranfield University-UK using photovoltaic panel which described in section 2. PV panel output power was controlled by Texas instrument Solar Explorer Kit (TMDSSOLAR (P/C) EXPKIT). It provides a flexible and safe low voltage platform to evaluate the C2000 microcontroller family of devices for power applications. The kit is available with two part numbers depending on which C2000 MCU control card the kit is shipped with, namely TMDSSOLARPEXPKIT ( F28035 Control Card )
and TMDSSOLARCEXPKIT ( F28M35H52C1 Control Card as shown in figure (5).
Figure (5): TMDSSOLAREXPLKIT Macros.
The Solar Explorer Kit consists of stages for DC-DC conversion and DC-AC conversion along with the required sensing signal to perform MPP Tracking. A panel emulator is built onto the board using a DC-DC power stage with light sensor, for quick demonstration of MPPT and PV Inverter control algorithms running MCUs.
Figure (6): Solar Explorer Kit Block diagram.
Figure (6) depicts the power stages present on solar explorer board. All three power conversion stages after the panel DC output i.e. DC-DC Boost, DC-DC Sepic, DC-AC inverter are using C2000 family microcontroller, which is installed in the DIMM100 slot on the Solar Explorer base board. The control of the PV emulator stage ( DC-DC Buck Boost ) is kept separated and is implemented using the TMS320F28027 microcontroller, which is pre-installed on the base board. As PV panels are a light dependent source, a light sensor is present which can be used to change the V vs I curves of the PV emulator.
ISSN 2348 – 7968
Figure (7): Typical DC-AC off grid PV system driving a local AC load
The simulation program gives the relation between tilt angle and monthly average daily total radiation solar radiation. The approximate optimum tilt angle for each month can be known from the results shown in figure (8) below. In summer season, the useful tilt angle fall between 0o and 20o. While the useful tilt angle for the remaining seasons is between 20o and 85o according to the season and month.
Figure (8): the effect of tilt angle against monthly average daily total radiation
The solar PV panel were modeled and simulated. Figure (9a &9b).
(a)
(b)
Figure (9): a: P-V characteristics of PV module, b: I-V characteristics of PV module
The PV panel is then tested and installed outside the ePAD laboratory.
This practical case includes two conditions, sunny and cloudy conditions. In case of sunny condition the sky was clear and the light was not obstructed by clouds. Figure (10) shows the readings taken around 1:00 pm on Thursday 17th of July 2014 using different collector tilt angles. It can be seen that the optimum tilt angle is 21.16 deg. where the maximum power obtained. As the angle increase the power decreases. The current also drops as a result of solar radiation intensity reduction while the voltage was approximately constant. In case of cloudy condition, the readings were taken when the sky was cloudy. Similarly, the tilt angles were adjusted and the current, voltage and power were recorded.
(a)
ISSN 2348 – 7968
(b)
Figure (10): (a): The effect of tilt angle on the output power of panel. (b): the effect of tilt angle on the current of
PV panel.
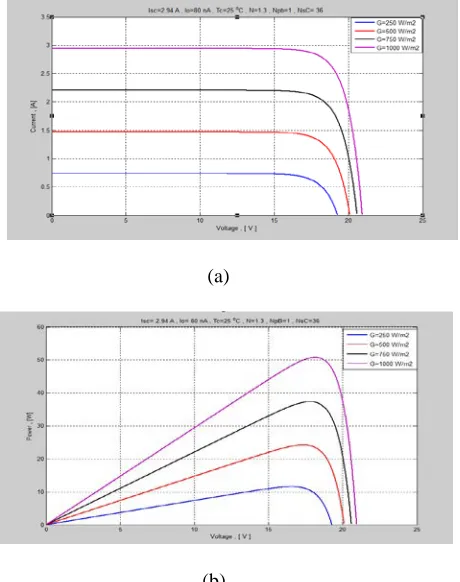
As compared with simulation results, From figure (11) where the level of irradiance was changed in the simulation to obtain variable results, it is quite clear that at 250W/m2 of solar radiation, the level of current falls to 0.7A and the power is around 11W. This is similar to the cloudy case as when the current is around 0.7A the output power is close to 11W. It can be assumed that in cloudy situations, the solar radiation falls close to 250W/m2.
(a)
(b)
Figure (11): (a) I-V characteristics of panel under different solar irradiance. (b): P-V characteristics of panel under
different solar irradiance.
From simulation, the maximum annual monthly average daily total radiation was provided in figure (12) that shows the maximum solar radiation at optimum tilt angle for each month within the year. It is clear that summer season has the maximum levels of radiation as compared with the others.
Figure (13) shows the maximum power point of PV panel at each month depending on the results provided in figure (12). Therefore, the maximum efficiency for each month can be estimated depending on power, solar radiation and collector dimensions as presented in figure (14).
Figure (12): Monthly average maximum daily total radiation with optimum tilt angle
Figure (13): monthly average maximum power produced by PV module.
ISSN 2348 – 7968
4. Conclusions
The most important factor affecting solar PV efficiency is the level of irradiance. With low level of irradiance, the PV panel efficiency will be low as well. Therefore, the efficiency will be increased with increment of solar irradiance. The PV panel power productivity and efficiency depends on the time within the year, location, position of the sun and its availability. With the results proving to be accurate, it is noted that getting the right angle is particularly important for solar PV modules. Thus, a tracking system needs to be installed for automatic tracking of the sun’s location. Using a tracking system, the solar panel will always be directed towards the sun thereby generating the most output at all times. A detailed cost analysis also needs to be carried out to see if the tracking system is feasible.
References
[1] BERANOVSKÝ, J., TRUXA, J., et al. Alternative energy for your house. Brno: ERA, 2004. ISBN 80-86517-59-4.
[2] LUQUE, A., HEGEDUS, S. Handbook of Photovoltaic Science and Engineering. John Wiley & Sons Ltd, 2003. ISBN 0-471-49196-9.
[3] Ashok Kumar et al.,'' OPTIMIZATION OF TILT ANGLE FOR PHOTOVOLTAIC ARRAY'', International Journal of Engineering Science and Technology (IJEST), ISSN: 0975-5462,. Vol. 3 No. 4 Apr 2011.
[4] Kimbal, H. H., 1919, “Variations in Total and Luminous Solar Radiation with Geographical Position in the United States,” Mon. Weather Rev., 47, p. 769.
[5] Angstrom, A., 1924, “Solar and Terrestrial Radiation,” Q. J. R. Meteorol. Soc., 50, pp. 121–126.
[6] C.Jena, Amruta Das, C.K.Panigrahi, M.Basu., ''
Modelling and Simulation of Photovoltaic Module with Buck-Boost Converter ''., International Journal of Advanced Engineering and Nano Technology (IJAENT)., ISSN: 2347-6389, Volume-1, Issue-3, pp 18-21, February 2014.
[7] MBOUMBOUE Edouard, Donatien NJOMO., '' Mathematical Modeling and Digital Simulation of PV Solar Panel using MATLAB Software''., International Journal of Emerging Technology and Advanced Engineering., ISSN 2250-2459, Volume 3, Issue 9, pp-24-32, September 2013.
[8] Soteris K.; "Solar Energy Engineering- Processes and Systems"; Copyright@ Elsevier Inc. @2009.
[9] B. H. Khan; "Non-Conventional Energy Resources"; Second Edition; McGraw Hill, 2010.
[10] Louis E. AKPABIO, Sunday E. ETUK "Relationship between global solar radiation and sunshine duration for onne, Nigerra, Turk. J. phys. 27 (2003)].
[11] F. Iannone, G. Noviello, A. Sarno, Monte Carlo Techniques to Analyse the Electrical Mismatch Losses in Large-Scale Photovoltaic Generators, Solar Energy, 62 (1998) 85−92.
[12] Kalogiour, Soteris.; '' solar energy engineering''; Elsevier Inc.; ISBN 978-0-12-374501-9 (hardcover); 2009.
Abdullateef A. Jadallah is Ph.D. in Mechanical engineering from Al-Rasheed College for engineering and science @University of Technology on 2001- Iraq. He has completed his M.Sc. & B.Sc. in Aeronautical Engineering from Al- Al-Rasheed College for engineering and science- Iraq in 1985, 1994 respectively. His research area of interest is the renewable energy (especially wind and solar), gas turbine power plant, and flow studies He has published several research papers in refereed International and National journals/ conference sand supervised many M.Sc. Students. He is currently working as Assistant Professor in the Department of Electromechanical engineering @
University of Technology, Iraq. [email protected]
Dhari Y. Mahmood is a phD in Electrical Engineering. He got his phD in Electrical Power in Samt Peterburg university, Russia. Currently he is the head of Electrical engineering Department @ U.O.T- iraq.his research area interest is the smart grid power and power system.