Winter-Range
Utilization
by Elk and Mule Deer
in Southeastern
Washington
HELMUT K. RUECHNER
Assistant Professor, Wildlife Matlagement, State College of Washington, Pullman
T
HE objective of this study was todetermine the utilization of winter- range forage by elk, Cervus canadensis nelsoni and mule deer, Odocoileus hemionus hetiionus, at different levels of population density. Some indication of the carrying capacity of grassland com- munities grazed by elk and deer alone is evident from the data presented here, and may be useful for comparison with ranges open to livestock grazing.
METHOD OF PROCEDURE
Two areas were selected for compari- sons on the William T. Wooten Game Range, a 12,000-acre tract owned by the State of Washington Department of Game, where livestock had been excluded for 5 to 6 years. One area, designated as the “Elk Range,” contained almost three times as many elk and about half as many deer as the other which was desig- nated as the “Mule-Deer Range.” On each area, clip plots (4 by 0.25 meters) were established in adjacent pairs to determine productivity and utilization of forage plants on grassy, southward-facing slopes. Open slopes covered mainly by her- baceous forage were considered the “key” areas most important for elk, the prin- cipal big-game animal in the Blue Moun- tains of southeastern Washington. Five 200-meter transects with five pairs of clip plots each were placed on the Elk Range; six on the Mule-Deer Range. Plots were clipped in September and October, 1949, and adjacent plots were clipped in early April, 1950.
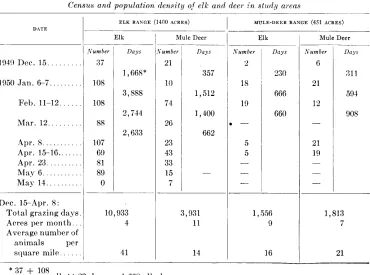
Population densities of elk and mule deer were determined by direct observa- tions made at intervals during the winter and early spring. These observations are recorded in Table 1. Admittedly, the pop- ulation densities were not nearly as pre- cise as those obtainable under controlled conditions in fenced pastures. The animals wandered freely into or out of the study areas, but their home ranges were suffi- ciently well established that ingress and egress were probably insignificant, as in- dicated by the relative uniformity of the census figures, particularly for the Elk Range. The elk first appeared on the areas sometime during the first two weeks in December and remained until the sec- ond week in May. Clipping to determine winter utilization was made April 5 to 7, immediately prior to renewed growth of the important herbs. Forage use and grazing months were, therefore, calculated for the four-month period, December to April.
The so-called “production” of blue- bunch wheatgrass (Agropyron spicatum)
actually represents only the amount of forage available at the time of clipping. Intermittent growth of this plant throughout the winter under favorable conditions precludes the determination of true production data. For management purposes this minor error is of little sig- nificance. Likewise, so-called “utilization,” which represents the amount of forage removed during the time interval, results from several factors in addition to elk and deer consumption and is also not an
ELK AND DEER RANGE UTILIZATION 77
accurate term. Forage removal of bunch- tional effort and expense of securing grass result in, 0‘ from factors other than paired data are not important limiting big game were insignificant, but for cheat- considerations.
grass (Bromus tecfor~m) and most forbs The adequacy of the sample was tested the removal from other causes was of by group comparisons, independent of major importance. pairing, of the fall and spring clippings
TABLE 1
Census and population density of elk and deer in stlrdjy areas
DATE
ELK RANGE (1400 ACRES)
Elk
Days
1049 13.x. 15.
.Vum ber 87
\Tumber 21
1950 *Jan. 6-7. 108 10
Feb. 11-12.. . 108
1,668”
3,888
2, '714
2,633 74
Mar. 12.. 88 26
,4pr. S.. . 107 23
Apr. 15-16.. . . . 69 43
Apr. 23.. 81 33
May 6.. . 89 15
May 14.. . . . . 0 7
Ihc. 15-L4pr. 8: Total grazing days. Acres per month. Average number of
animals per square mile.
10,933
41 14 16
MULE-DEER RANGE (451 ACRES)
Mule Deer Elk Mule Deer
Days
357
1,512
1,400
662
-
3,931 1, .556
11 9
18
19
. -
5 5 - - -
Days
330
666
660
* 37 + 108
- elk X 23 days = 1,668 elk-days. 2
Pairing plots appeared to increase the for wheatJgrass on each range. Setting “t”
efficiency of sampling only slightly. For at the five-percent level of significance in total forage on the Elk Range, 1.2 times the formula, n = 2s2t2/2 (p. 80 in Snede- as many plots would have been required car, 1946), for the Elk Range, 7 plots if the data were not paired. In this case would have been required in fall and in pairing was scarcely worthwhile. For spring to sample adequately for the 78 wheatgrass on the Mule-Deer Range, percent reduction that occurred. On the about 1.5 times as many plots would have Mule-Deer Range, 20 plots would have been required if they were not paired. been required each season to sample ade- Since the efficiency gained by pairing with quately for the 49 percent reduction that the small number of plots involved was occurred. Actually 24 usable plots were not appreciably great, the procedure can established each season on the former be recommended only where the addi- and 30 on the latter.
Kumber 6
21
12
-
21 19
- --
Days
311
594
908
1,813 w
78 HELMUT K. BUECHNER
RESULTS AND DISCUSSION
Production and Utilization
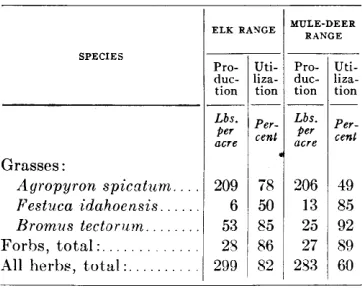
The productivity of the two areas was approximately the same (Table Z), as analysis of variance showed that the dif- ferences in total forage (299 and 283 lb./at.) and bluebunch wheatgrass (209 and 206 lb./at.) were not significant. On
TABLE 2
Forage production and utilization
Grasses :
Agropyron spicntum.. Festuca idahoensis. .
Hromus tectorum.. Forbs, total :.
All herbs, total:.
ELK RANGE MULE-DEER RANGE
Pro- duc- tion
~- Uti- Pro- liza- duc- tion tion __-
Per- Fr cent acre
*
Uti- liza- tion
Lbs. Per acre
Per- cent
209 78 206 49 6 50 13 s5 53 85 25 92 23 86 27 89 299 82 233 60
the Elk Range, 82 percent of all herbs and 78 percent of the wheatgrass by air-dry weight were removed from the range be- tween fall and spring. In contrast, 60 percent of all herbs and 49 percent of the wheatgrass were removed from the Mule- Deer Range. For spring clippings, the differences between areas were highly significant for both total forage (54 and 113 lb./at.) and wheatgrass (46 and 105 lb./at.), indicating that the reductions were much greater on the Elk Range than on the Mule-Deer Range. Since the fall productivity of the two ranges was essen- tially the same, the greater reduction in all forage and particularly in wheatgrass can be attributed only to the higher pop- ulation density of elk on the Elk Range. On this area, as shown in Table 1, only four acres were available per elk-month.
Idaho fescue (Festuca idahoensis) was approximately twice as abundant on the
Mule-Deer Range as on the Elk Range (Table 2). According to the Range Plant Handbook (1937)) Idaho fescue is a choice forage plant relished by all classes of live- stock. Presumably, it also ranks high for elk and mule deer. It appeared to be more palatable than Huebunch wheat- grass in the present study, since it was found utilized in greater amounts than wheatgrass where both occurred together in abundance. The higher utilization (85 compared to 50 percent) of Idaho fescue was correlated with the area of higher production (13 compared to 6 lb./at.), and apparently reflected the influence of availability upon utilization.
It is noteworthy that 85 percent of the cheatgrass on the Elk Range, and 92 percent on the Mule-Deer Range, was removed between fall and spring. This reduction represents primarily a loss in weight resulting from curing, trampling, packing by snow, leaching, washing during run-offs, and bacterial decompo- sition, rather than animal utilization. The plant does not appear to be utilized in a cured state, but elk were observed feeding avidly on cheatgrass in early May when the forage was green and fairly abundant in patches on benches and ridges.
The reduction in forb forage likewise resulted, at least in part, from factors other than grazing, although perhaps greatJer winter utilization may be expected on this group of plants than on cheat- grass.
Influence of Game Reserve
ELK AND DEER RANGE UTILIZA4TION 79
all hunters for elk of either sex and any age. Previous seasons were primarily for bulls, although during some years a few cow permits were issued. The reserve served as a reservoir, providing large num- bers of elk for a limited winter range. Elk also migrated from areas surrounding the reserve to. winter in the vicinity of the study area on Abel Ridge, one of the most important wintering areas in the Blue Mountains. The population density on this area was particularly high during the severe winters of 1948-49 and 1949-50, two of the coldest winters on record. Early snowfalls drove the elk to lower elevations and persistent snow throughout the win- ters held the.m there. In the spring of 1950 the elk did not depart for the summer range until sometime between May 6 and 14 (Table 1).
Cam ying Capacity
Blaisdell and Pechanec (1949) have shown that clumps of bluebunch wheat- grass clipped to ground level on October 30 produced as much herbage the fol- lowing year as unclipped clumps. The greatest reduction in the following year’s herbage resulted from clippings made in late May and early June, and the effect of late-fall clipping was slight. Further evidence that wheatgrass may withstand high utilization during the period of dor- mancy is presented by Daubenmire (1940) who observed that a fence-corner relic remained in fair condition despite ground- level grazing by livestock in the fall. Based on this evidence, the 78 percent utilization of wheatgrass on the Elk Range during the winter season did not appear to exceed t)he physiological limits of the plant. Yet it seems risky to base carrying capacity only on utilization of the key forage plant. Continued soil loss through washes, slips, and surface run-off, early spring trampling in wat)er-saturated soil, packed trails that accelerated ero-
sion, low density of the vegetation, scar- city of litter, and persistence of cheatgrass on the drier exposures and overused benches, and other factors indicated that the range was not in good condition. It appears doubtful that the range would recover to the desired stage of develop- ment under a grazing pressure of 4 acres per elk-month and 11 acres per deer- month. .Furthermore, utilization of wheat- grass extended into the growing season in 1950. Probably this is a common phe- nomenon following severe winters and late forage production on the summer range. However, despite heavy use of elk during periodic severe winters, the vegetation on the Wooten Game Range improved con- siderably in composition and productive capacity during the 5 to 6 years after the removal of livestock. Elimination of cattle grazing during the summer undoubtedly made possible the recovery of the vege- tation that has occurred.
In comparing the ‘two study areas, it was apparent that the vegetation on the Mule-Deer Range was in a healthy, satis- factory condition, while that on the Elk Range was seriously abused by both pre- vious and current overuse. The data pre- sented here indicate that the grassland vegetation can be maintained in good condition when not over 50 percent of the wheatgrass is utilized, and that 9 acres per elk-month and 7 acres per deer-month reflected approximately proper population densities over the period of time when the range was used.
80 HELMUT K. BUECHNER
zation by elk on one area. At a popula- tion density of 41 elk and 13 deer per square mile, or 4 acres per elk-month and 1 I acres per deer-month, 75 per cent of bluebunch wheatgrass was removed, whereas only 49 percent was removed at a population density of 16 elk and 21 deer per square mile, or 9 acres per elk- month and 7 acres per deer-month. De- spit)e rather heavy winter use, the vege- t,ation on the Wooten Game Range as a whole has shown considerable improve- ment since summer grazing by cattle was eliminated. Recovery of the grassland vegetation was seriously retarded where elk were most numerous. To maintain the vegetation in vigorous condition, it is rec- ommended that winter use not exceed 50 percent of bluebunch wheatgrass.
ACKNOWLEDGEMENT
I wish to extend my sincere apprecia- tion to Carl V. Swanson and Millard F. Howe of the State of Washington De-
partment of Game for their aid in se- lecting study areas and helpful sugges- tions and to the students who helped with clipping the plots. Dr. J. G. Darroch of the Washingt)on Agricuhural Experiment Stations generously contributed time and effort in checking the statistical analyses. This investigation was supported in part by the State College of Washington Re- search Fund.
LITERATURl< CITED
BLAISDELL, JAXIES P., 41x9 , JOSEPH F. PECHA-
XE<‘. 1949. IjYfects of herbage removal at various clatcs on vigor of k>luehunch wheat- grass and arrowleaf balsamroot. $:col. 30: 298-305.
DAUBENMIRE, REXFORII F. 1940. Plant suc- cession due to overgrazing in the Agro- pyron kmnchgrass prairie of southeastern Washington. Ecol. 21: 55-64.
DAYTON, W. A., et al. 1937. Range plant handbook. TJ. S. Govt. Printing Off., Wash- ington, D. C. See p. G58.
SNE~ECOR, GEOR(:E W. 1946. Statistica methods. Ioxa State Col. Press, Ames, Iowa. xvi + 485 pp.
THE PUBLICATION OF RESEARCH-2