A Hybrid Classifier for Classification of Rice Crop
Varieties
B. Mahendra Kumar#1, DR. Karthik S *2, Dr.V.K.Shunmughanaathan #3
#1
Lecturer, Dept. of MCA -VTU, Dayananda Sagar College of Engineering, Bangalore-560078
*2
Dean & HOD, Dept. of Cse, Sns College of Technology, Coimbatore, Tamil Nadu, India
3
Professor, SNS college of technology,Coimbatore-641035
Abstract— In this paper propose a denoising method for reducing noise in digital images. An efficient Rao-Blackwellized Particle Filter (RBPF) with maximum likelihood Estimation approach is used for improving the learning stage of the image structural model and guiding the particles to the most appropriate direction. It increases the efficiency of particle transitions. The proposal distribution is computed by conditionally Gaussian state space models and Rao-Blackwellized particle filtering. The discrete state of operation is identified using the continuous measurements corrupted by Gaussian noise. The analytical structure of the model is computed by the distribution of the continuous states. The posterior distribution can be approximated with a recursive, stochastic mixture of Gaussians. Rao-Blackwellized particle filtering is a combination of a particle filter (PF) and a bank of Kalman filters. The distribution of the discrete states is computed by using Particle Filters and the distribution of the continuous states are computed by using a bank of Kalman filters. The Maximum likelihood Estimation method is used for noise distribution process. The RBPF with MLE is very effective in eliminating noise. RBPF with MLE is compared with particle filter, Markov Random Field particle filter and RBPF. In this paper different performance metrics are evaluated for this type of noise removal technique. The metrics are Mean Square error, Root Mean square error, Peak Signal to Noise Ratio, Normalized absolute Error, and Normalized Cross Correlation, Mean Absolute Error and Signal to Noise Ratio. Experimental results prove that RBPF with MLE outperforms for degraded medical images.
Keywords— ECG, MIT-BIH Database, Median filter, FIR filter, Gaussian filter, Butterworth filter.
1. INTRODUCTION
In image processing Hyperspectral imagery data is an over-determined data. One important feature of hyperspectral data is its large data volume, data redundancy and band correlation. Hyperspectral imagery provides opportunities to extract more detailed information than is possible using traditional Multispectral data. Hyperspectral imagery has also been used to study details of surface properties that are undetectable using other types of imagery like multispectral. For example, Hyperspectral images have been used to detect soil properties including moisture, organic content, and salinity [2]. Hyperspectral images have found many applications in water resource management, agriculture and environmental monitoring [1].
Hyperspectral remote sensing technology demonstrates the capacity of accurate vegetation identification and estimate biochemical content, which is mainly because of narrow and contiguous bands that make it possible to distinguish the variations of absorption features that cannot be done by multispectral sensors. It is demonstrated that using hyperspectral image to make quantitative classification and identification of crop or vegetation characteristics is successful. The simplest way to identify different vegetation is to use reflectance curve due to chlorophyll absorption in blue and red regions and high reflectance in green and near infrared regions, or use different vegetation index [3].
Measures of plant physiology and structure such as water content, plant pigment content, canopy architecture, leaf area index, and density have been examined widely over the past decade ([4-9]) using hyperspectral imagery. Vegetation scientists have also successfully used Hyperspectral imagery to identify vegetation species ([10, 11]) and to detect vegetation stress and disease identification [12].
In Asia the most important staple food is Rice (Oryza sativa L.), and it has a lot of remote-sensing-based research on single biotic stress and infection levels, including panicle blast (13), leaf blast (14), leaf brown spot , sheath blight (15), leaf folder (16), and brown planthopper (17). However, few studies have focused on different levels of infection; two or more fungi may produce similar symptoms and coexist in the same field. Rice False Smut Disease (RFSD) is one of the most devastating diseases of rice, in which the rice grain is infected by the fungus Ustilaginoidea virens due to the spread and planting of high-yield hybrid rice cultivars (18).
Here rice crop classification is done by taking its Hyperspectral images of the crop region which is subject to classification process of hybrid technique of SVM and RVM.
2. RELATED WORK
The study area is part of Guntur district, Andra Pradesh state of India lying between 16°7’31”– 16°50’55” N latitude and 79°40’37”– 79°44’49” E longitude. The spectral library is build using field spectro radiometer data. Image processing has been done using ERDAS IMAGINE- 8.6 and ENVI 4.3 software [19].
Hyperspectral imagery provides an opportunity for more detailed image analysis. To fulfil this potential, new image processing techniques have been developed. In this series a sequence of algorithms were developed and commercialized specifically to extract detailed information from Hyperspectral imagery [20].
Recently, a support vector machine (SVMs) is used for the classification of multispectral remote sensing images [23]–[25]. SVMs have often been found to provide higher classification accuracies than other widely used pattern recognition techniques, such as the maximum likelihood and the multilayer perceptron neural network classifiers. Furthermore, SVMs appear to be especially advantageous in the presence of heterogeneous classes for which only few training samples are available. In the context of hyperspectral image classification, some pioneering experimental investigations preliminarily pointed out the effectiveness of SVMs to analyze hyperspectral data directly in the hyperdimensional feature space, without the need of any feature-reduction procedure [26, 27]
3. PROPOSED WORK
The proposed work is to improve the yield of rice crops for this Hyperspectral images are taken and they are preprocessed and classified by using hybrid technique here.
A. Crop Yield:
To improve agricultural and rural statistics considers crop area, crop production, and crop yield as three key variables that should be part of the minimum core data set that all countries should be able to provide. It identifies crop productivity, or crop yield, as one of the essential indicators for agricultural development. In essence, crop yield is defined as
crop yield = (1.1) And which is normally expressed as kilograms (kg) or metric tonnes (t) of product per hectare (ha). The estimation of crop yield thus involves both estimation of the crop area and estimation of the quantity of product obtained from that area. Though the definition seems simple, in many circumstances neither may be easy to estimate, both are prone to error and bias, and their measurement can be time consuming.
B. Image Pre-processing
The preprocessing of image is essential process in image processing. Satellite images are pre-processed before subject to the classification.
Here for the Hyperspectral images the sensor errors are removed with that the display corrections, band selection, dropping data dimensionality also removed to minimize the complicatedness. In this work the Hyperspectral image is corrected radiometrically, geometrically, irregular band and pixels are predicted. The process of spectral smoothing is
done to correct the spectral bands and atmospheric correction is implemented for better reflectance.
C. Radiometric Correction
The Hyperion sensor give constant spectral coverage of 242 bands of which 198 are non zero, in a 10 nm sampling interval over the wavelength as of 400 – 2500 nm. Two detectors are present in the sensors is VNIR and SWIR. The VNIR (VIR+NIR) bands envelop the spectral series of 400 –1000 nm in 70 bands with an average Full-Width At Half Maximum (FWHM) of 10.90 nm and are accumulate as 1.80x40xDN in watts per steradian micrometer square meter. SWIR cover up a series of 900 – 2500 nm in 172 bands by means of an average FWHM of 10.14nm and accumulated as 1.18x80xDN in watts per steradian micrometer square meter. So the Hyperion image has two scaling factors independently for VNIR and SWIR bands. Hence DN value of VNIR and SWIR bands is necessary to transformed into the relevant radiance value.
The total radiance data has been considered during
VNIR L = and SWIRL = .
Two multiband images have been implemented in accordance to their scale values in VNIR and SWIR regions, the unit is (W/m2SRμm). These supplementary data subsets are shared by means of nearest neighbour algorithm to construct a novel UTM projected and registered GeoTIFF image (Richard Beck, 2003).
D. Geometric Correction
The image is geometrically corrected to UTM projection with WGS-84 geographic datum in zone 43. The 198 non-zero spectral bands selected further processing. A subset of the image (192 x 306 pixels) has been used in spectral classification, as shown in Figure 1.
Selection of Celebrated Bands
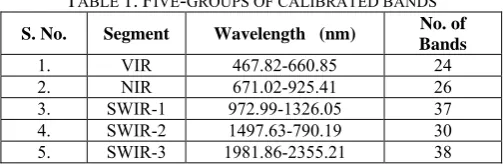
A Hyperion dataset having 155 bands is selected for additional processing, because of low detector response all 242 spectral bands are not calibrated and some of them are eliminated (1- 7, 58-82, 120-134, 165-182 and 221-242). The calibrated bands for further processing are shown in Table 1.
TABLE 1.FIVE-GROUPS OF CALIBRATED BANDS
S. No. Segment Wavelength (nm) No. of Bands
1. VIR 467.82-660.85 24 2. NIR 671.02-925.41 26 3. SWIR-1 972.99-1326.05 37 4. SWIR-2 1497.63-790.19 30 5. SWIR-3 1981.86-2355.21 38
Abnormal Pixels Detection and Correction
Intermittent with lower DN values is studied in (21). These errors are removed in image pre processing process. The Hyperion sensor is highly sensitive for detecting the changes that arise in both the VNIR or SWIR regions. A high spatial auto correction algorithm is designed to predict and correct the DN values of the instant left and right neighboring pixels.
This auto correction algorithm traverses each band flat to evaluate each pixel’s DN value with the value of its instant left and right neighbouring pixels. A pixel is labeled as a probable irregular pixel proviso its DN value is smaller than the DN’s of both neighbours. Then the each band is traversed perpendicularly to count the number of consecutive potential irregular pixels in each column. The required irregular pixels exceeds a defined threshold value, so that the column of the irregular pixels percentage is also increased hence it is denoted as a stripe.
For de-striping the function the required data should be in acquire format and it cannot be rotated. These de striping’s are for bad columns are investigated directly to eradicate the stripping errors. In stripping pixels correction 12 bands are visually examined for de-striping, the first 1VNIR (band 8, 9, 10, 11, 12, 13, 14, 15, 16, 56, 57) and 1-SWIR (band 183).
Spectral Smoothing and Atmospheric correction using AE AE refers to the combination of EFFORT (Empirical Flat Field Optimal Reflectance Transformation) custom smoothing algorithm with ATREM (Atmospheric Removal).
In this work Empirical Flat Field Optimal Reflectance Transformation (EFFORT) an image smoothing method is used to exact the spectral bands proposed in (22). EFFORT is an arithmetical improvement used to take away remaining instrument noise produced by instrument and
atmospheric effects from Hyperion data. EFFORT is used to produce gain and offset values in esteem to each spectral band and useful for atmospheric correction. These ASCII values for every band are considered by evaluating the modeled spectra to the data spectra, for pixels that fit. The atmospheric components have to be removed for better reflectance.
E. Spectral Digital Library
In satellite image processing the reflectance value of an object can be denoted in the form of graph or curve called spectral signature. In the present study multiple Regions of Interest with unique color symphony for digital library and classification of rice crop varieties are scheduled in Table 2.
In image analysis of hyperspectral, the digital value of a pixel matches to spectral band reflectance in the pixel at nth spectral band. The spectral reflectance value at nth spectra is analyzed for assessing the spectral separability as well as in image classification. The proposed library has the contribution of photosynthetic pigments (400-700nm) and chlorophyll absorption (600nm) in the first segment of spectra, red edge-chlorophyll (700-750nm) in the second phase of spectra, the liquid water variation (1080-1170) in the third phase of spectra, the various leaf waxes and oil (1700-1780nm) and cellulose (2100nm) in the fourth phase of spectra, the soil properties (2100-2300nm) and nitrogen/ protein (2280-2290nm). The spectral curve produced for RICE species in the Kharif season, it has shown diversity in reflectance pattern depending on the crop characteristics and growth stage of the crop in the VNIR and SWIR regions.
TABLE 2:REGIONS OF INTEREST WITH UNIQUE COLOR SYMPHONY FOR DIGITAL LIBRARY AND CLASSIFICATION OF RICE CROP VARIETIES
S.No Class Type No. of
pixels Class Color Composition
1. RICE 1 Ratan (IET-1411) 11 GREEN 2. RICE 2 CSR-10(IET-10349/10694) 07 GREEN 1 3. RICE 3 Haryana Basmati-1 (IET-10349/10694) 12 GREEN 2 4. RICE 4 HKR -126 26 GREEN 3 5. RICE 5 CSR – 13(IET-10348) 16 SEA GREEN
6. WATER 1 64 WHITE
7. HABITATION 66 CYAN 3
8. POND 04 BLUE
9. VEG 1(Sugarcane 1) 02 MAGENTA 10. VEG 2(Sugarcane 2) 01 MAROON 11. OPEN FIELD 07 CYAN
12. MOISTURE 05 PURPLE
13. SAND 08 RED
14. WATER 2 02 BLUE 2
15. BUSHES 20 YELLOW
16. BARON LAND 02 COTRAL
F. Reflectance Retrieval
The reason of atmospheric correction is to reduce the pressure of atmosphere on object reflectance. Impact of correction is more noticeable in VNIR region, for all land cover classes, the reflectance value in visible region is low, as in the NIR-SWIR region it establish high. The reflectance value is increased in the following spectra:
• 33-96(681.20 – 1104.19nm) • 102-163(1164.68-1780.09nm) • 183-184(1981.86-1991.96nm) • 187-220(2022.25-2355.21nm)
Whereas most of the reflectance value is decreased in the following spectra:
• 8-32 (426.82-671.02nm) • 97-101(1114.19-1154.58nm) • 164 (1790.19nm)
• 185-186 (2002.06-2012.15nm).
Therefore, the reflectance values of the wavebands 8-32(426.82-671.02nm), 97-101(1114.19-1154.58nm), 64(1790.19nm) and 185-186(2002.06-2012.15nm) are found negative and set to zero. In total there are 120 such bands that contained positive DN values, whereas 35 negative and set to zero.
G. Hyperspectral Image Classification
The enormous quantity of information and the high spectral resolution of hyperspectral images give the possibility to solve problems which usually cannot be solved by multispectral images. In classification of hyperspectral images, the higher dimensionality of the data increases the capability to detect and distinguish various classes with improved accuracy. Though, several significant issues need to be considered in the classification process for this kind of images. The most common of such issues are the spatial variability of the spectral signature, the high cost of true sample labelling, the quality of data, and problems associated with the very high number of spectral channels. The large dimensionality of the data in the spectral domain leads to theoretical and practical problems.
H. Mask Image
In this step mask is prepared to mask out non-vegetation (WATER 1, POND, HABITATION, OPEN FIELD, MOISTURE, SAND, WATER 2, SHRUB, and BARONLAND) and vegetation (VEG1 and VEG2) classes. The reason of this binary image is to reduce the data for analysis and make sure that the classification is done later will enhance contrast among different varieties of rice crop.
I. Hybrid SVM-RVM classification to classify the image Support vector machines (SVMs) and Relevance Vector Machines (RVMs) are two learning machines that are currently cutting-edge research. SVMs offer better accuracy and complexity, surpassed by RVMs when it comes to probabilistic outputs or kernel selection.
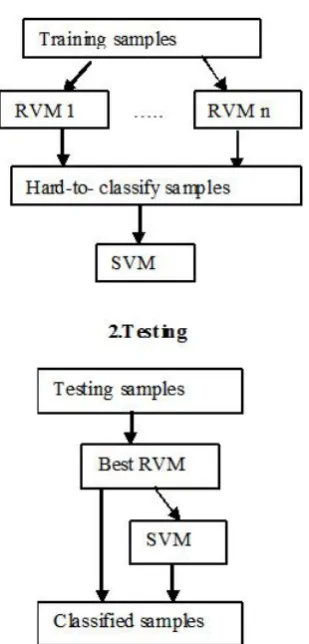
A two-level hierarchical hybrid SVM-RVM model to combine the best of both learning machines. The first level of the proposed model uses an RVM to determine the less confident classified examples and the second level uses an SVM to learn and classify the tougher examples. The hierarchical approach outperforms both baseline learning machine.
The first level of two-level hierarchical approach uses the probabilistic nature of several RVM models to determine which samples will be retaining and which will be transferred to the second level. To cope with RVM scalability problems, the training set was divided into chunks of 1,000 samples and an RVM model was induced for each chunk. By interpreting the RVM probabilistic output classification as a confidence measure, we defined a symmentrical interval centered on the origin ([-range, range]), where the RVM presented lower confidence. This interval or range was inspired by the logistic function,
p t = 1|d =
, where d represents the
input mask, t is the target and f is the RVM classifier
function. Thus training samples that fall in the area under the logistic curve are selected to be labeled as hard-to-classify samples. These samples classified within the defined range will constitute the training set of the second level SVM, which has presented the best standalone results so far. Testing procedure is similarly to the training phase.
4. EXPERIMENTAL RESULTS
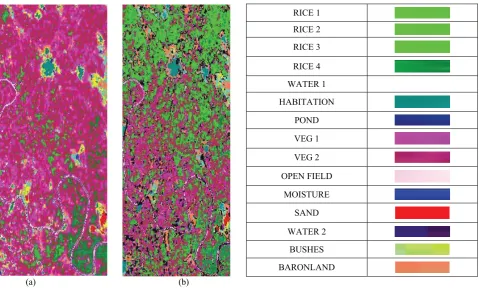
For the detection of rice crops correctly the Hyperspectral Image Processing System (HIPS) is used. The given EO-1Hyperion L1GST is a raw satellite image and not accurate. A demonstration of Pre-processing is engaged to obtain an acceptable reflectance shell to build up a spectral library and image classification. Exact monotonous spectral libraries of rice crop mixtures are named as Ratan (IET-1411), CSR- 10(IET-10349/10694), Haryana Basmati-1 (IET-10367), HKR-126 and CSR-13(IET-10348) is implemented with hyperspectral data. When the sixteen end members are practiced by hybrid SVM-RVM algorithm, an outstanding bias between the different end members is found in the spectral signatures. The classification result by means of Hybrid SVM-RVM classifier shows an overall accuracy is 89.16% previous to image correction. It is accurate that after Pre-processing classification accuracy 91.21% which is greater than before Pre-processing classification. Comparison of classification results is shown in the figure 2 before correction and after correction process with reference ground truth data; point out that forest region both in the two sides of the image and in the middle part of the image as small patches are suitably identified in classification after preprocessing.
The crop varieties of the rice are more exactly recognized after preprocessing process. The inter class addition in rice crop is comparatively reduced and deeply mixed VEG 2 class with RICE 1 class is eradicated in classification after image Pre-processing (Figure 2b). Compared with raw image classification, the classification significantly condensed the commission and omission errors of all classes by means of Pre-processed image with the exemption of the RICE 2, RICE 3 and RICE 1 respectively. For instance, uncertainty between RICE 1 and VEG 2 classes, RICE 2 and RICE 1 classes, RICE 3 and RICE 2 classes, RICE 4 and RICE 5 classes and RICE 5 and RICE 4 is condensed to 0.00% (from 9.09%), to 14.29% (from 28.57%), to 0.00% (from 8.33%), to 7.69% (from 19.23%) and to 12.50% (from 18.75%) respectively.
J. Performance Metrics:
The Performance of this work is measured by the parameters of
• Accuracy and • Time
Accuracy Measurement:
The accuracy of the classifier is measured using the classifiers percentage correctly classified result. Here the proposed work of hybrid SVM with RVM technique.
Fig 2. Classified images by Hybrid SVM-RVM classifier of the study area: (a) Before Pre-processing (b) After Pre-processing
RICE 1 RICE 2 RICE 3 RICE 4 WATER 1 HABITATION
POND VEG 1 VEG 2 OPEN FIELD
MOISTURE SAND WATER 2
TABLE3:BEFORE PRE-PROCESSING CLASSIFICATION ACCURACY USING ELM CLASSIFIER IN VNIR-SWIR RANGE
TABLE 4:AFTER PREPROCESSING CLASSIFICATION ACCURACY USING ELM CLASSIFIER IN VNIR-SWIR RANGE
Fig 3: Comparison graph of accuracy for existing and proposed methods
From the above figure 3, we can notice that the existing SVM classification produces accuracy of 79%, then SAM classifier produces 86 % where else the previously proposed method achieves accuracy of 92 % and hybrid
achieves nearly maximum accuracy of 94% and proved its efficiency.
Time Measurement:
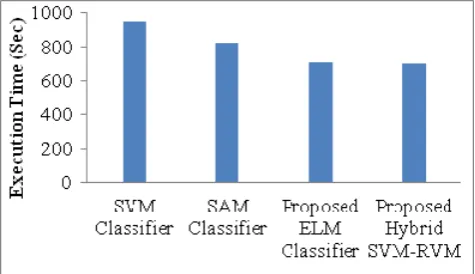
The execution time taken by any technique is also important factor. The time taken by the existing and proposed work is shown in below figure 4.
Fig 4: comparison graph of execution time for existing and
Class RICE CROP VARIETIES
WATER1 HABITATION POND VEG1 VEG2 Total RICE1 RICE2 RICE3 RICE4 RICE5
Unclassified 7 0 0 0 0 0 0 0 0 0 0
RICE1 72.73 28.57 8.33 0 0 0 0 0 0 0 4.35
RICE2 18.18 71.43 8.33 0 0 0 0 0 0 0 3.95
RICE3 0 0 83.33 0 0 0 0 0 0 0 9.49
RICE4 0 0 0 80.77 18.75 0 0 0 0 0 7.11
RICE5 0 0 0 19.23 81.25 93.75 0 0 0 0 23.72
WATER 0 0 0 0 0 0 83.33 0 0 0 21.74
HABITATION 0 0 0 0 0 0 0 100 0 0 1.58
POND 0 0 0 0 0 0 0 0 0 0 12.10
VEG 1 0 0 0 0 0 6.25 0 0 100 0 7.92
VEG2 9.09 0 0 0 0 0 16.67 0 0 100 8.06
Total 100 100 100 100 100 100 100 100 100 100 100
Overall
Accuracy 88.54%(224/253)
Kappa
Coefficient 0.87
Class RICE CROP VARIETIES
WATER1 HABITATION POND VEG1 VEG2 Total RICE1 RICE2 RICE3 RICE4 RICE5
Unclassified 0 0 0 0 0 7.81 3.03 0 0 0 2.37
RICE1 54.55 14.29 8.33 0 0 0 0 0 0 0 3.16
RICE2 36.36 85.71 0 0 0 0 0 0 0 0 3.95
RICE3 9.09 0 91.67 0 0 0 0 0 0 0 4.74
RICE4 0 0 0 92.31 12.5 0 0 0 0 0 10.28
RICE5 0 0 0 7.69 87.5 0 0 0 0 0 9.32
WATER 0 0 0 0 0 82.81 96.97 0 0 0 23.95
HABITATION 0 0 0 0 0 0 0 100 0 0 25.3
POND 0 0 0 0 0 0 0 0 0 0 4.23
VEG 1 0 0 0 0 0 9.37 0 0 100 0 8.26
VEG2 0 0 0 0 0 0 0 0 0 100 4.44
Total 100 100 100 100 100 100 100 100 100 100 100
Overall
Accuracy 93.21%
Kappa
From the figure 4, we can observe that the existing SVM classification takes 94 seconds, then SAM classifier takes 86 % where else the previously proposed method takes 70 seconds and hybrid takes of only 69 seconds and shows better accuracy in reduced time.
5. CONCLUSION
The rice crop yields are examined by Hyperspectral images. The image of this type is first pre-processed and subjected for the classification. In remote sensing image analysis a Hyperspectral Image Processing a promising technique to give more complete and in depth spectral information regarding land cover area and has a great potential to differentiate specific plant species by means of hundred numbers of adjacent bands. The classification technique of SVM is combined with RVM here for accurate classification. This hybrid technique can classify efficiently for large database also. The experimental result proves its efficiency and performance of this is evaluated using accuracy and execution time for hybrid technique.
REFERENCES
1. Smith RB, 2001a. Introduction to hyperspectral imaging. www.microimages.com (Accessed 11/03/2006).
2. Ben-Dor, E., Patin, K., Banin, A. and Karnieli, A., 2001, Mapping of several soil properties using DAIS-7915 hyperspectral scanner data. A case study over clayey soils in Israel. International Journal of Remote Sensing (in press).
3. Richard Beck, 2003. “EO-1 User Guide, V.2.3”, http:// eo1.usgs.gov & http://eo1.gsfs.nasa.gov.
4. Asner, G.P. 1998. Biophysical and biochemical sources of variability in canopy reflectance. Remote Sens. Environ. 64 234-253.
5. Datt B., 1998. Remote sensing of chlorophyll a, chlorophyll b, chlorophyll a+b, and total carotenoid content in eucalyptus leaves. Remote Sens. Environ 66 111-121.
6. Ceccato P, Flasse S, Tarantola S, Jacquemoud S and Gregoire J M, 2001. Detecting vegetation leaf water content using reflectance in the optical domain. Remote Sens. Environ. 77 22-33.
7. Gitelson A. A., Zur Y, Chivkunova, O. B. and Merzlyak M. N., 2002. Assesing carotenoid content in plant leaves with reflectance spectroscopy. Photochem. Photobiol. 75 272-281.
8. Champagne CM, Staenz K, Bannari A, Mcnairn H and Deguise JC, 2003. Validation of a hyperspectral curve fitting model for the estimation of water content of agricultural canopies. Remote Sens. Environ. 87 148-160.
9. Gupta R K, Vijayan D and Prasad T S, 2003. Comparative analysis of red-edge hyperspectral indices. Adv. Space Res. 32 2217-2222. 10. Cochrane, M.A. 2000. Using vegetation reflectance variability for
species level classification of hyperspectral data. International Journal of Remote Sensing, 21(10):2075-2087.
11. Galvao LS, Formaggio A R and TISOT DA, 2005. Discrimination of sugarcane varieties in Southeastern Brazil with EO-1 Hyperion data. Rem Sens Envir 95: 523-534.
12. Merton, R. N., 1999, Multi-temporal analysis of community scale vegetation stress with imaging spectroscopy. Ph.D. Thesis, Geography Department, University of Auckland, New Zealand, 492pp.
13. Kobayashi, T., Kanda, E., Kitada, K., Ishiguro, K., Torigoe, Y., 2001. Detection of rice panicle blast with multispectral radiometer and the potential of using airborne multispectral scanners. Phytopathology 91 (3), 316–323.
14. .Wu, S.W., Wang, R.C., Chen, X.B., Shen, Z.Q., Shi, Z., 2002. Effects of rice leaf blast on spectrum reflectance of rice. Journal of Shanghai Jiaotong University (Agricultural Science) 20 (1), 73–77 (in Chinese).
15. Qin, Z.H., Zhang, M.H., Christensen, T., Li, W.J., Tang, H.J., 2003. Remote sensing analysis of rice disease stresses for farm pest management using wide-band airborne data. IEEE International Geoscience and Remote Sensing Symposium 6 (4), 2215–2217. 16. .Shi, J.J., Liu, Z.Y., Zhang, L.L., Zhou, W., Huang, J.F., 2009.
Hyperspectral recognition of rice damaged by rice leaf roller based on support vector machine. Rice Science 23 (3), 331–334 (in Chinese). 17. Liu, Z.Y., Shi, J.J., Zhang, L.W., Huang, J.F., 2010. Discrimination of
rice panicles by hyperspectral reflectance data based on principal components analysis and support vector classification. Journal of Zhejiang University: Science B 11 (1), 820–827.
18. Ou, S.H., 1985. Rice Diseases, second ed. Commonwealth Mycological Institute, Ferry Lane, Kew, Surrey, UK, 307–311. 19. N. Rama Rao, P. K. GARG and S. K. GHOSH, 2007. Development of
an agricultural crops spectral library and classification of crops at cultivar level using hyperspectral data. Springer Science+Business Media, Precision Agric 2007 8:173-185 DOI 10.1007/s11119-007-9037.
20. Boardman, J. W. 1993. Automated spectral un-mixing of AVIRIS data using convex geometry concepts: in Summaries, Fourth JPL Airborne Geoscience Workshop, JPL Publication 93-26, 1:11-14. 21. Goodenough D. G., Dyk A., Niemann K. O., Pearlman J. S., Chen
Hao, Han T., Murdoch M., West C. (2003). Processing Hyperion and ALI for forest classification. IEEE Transactions on Geoscience and Remote Sensing, vol. 41, Issue 6, pp 1321-1331.
22. Singh A. and Harrison A. (1885). Standardized principal components. International Journal of Remote Sensing, 6(6), pp 883-896.
23. L. Hermes, D. Frieauff, J. Puzicha, and J. M. Buhmann, “Support vector machines for land usage classification in landsat TM imagery,” in Proc. IGARSS, Hamburg, Germany, 1999, pp. 348–350.
24. F. Roli and G. Fumera, “Support vector machines for remote-sensing image classification,” Proc. SPIE, vol. 4170, pp. 160–166, 2001. 25. C. Huang, L. S. Davis, and J. R. G. Townshend, “An assessment of
support vector machines for land cover classification,” Int. J. Remote Sens., vol. 23, pp. 725–749, 2002.