Theoretical and experimental investigation
of membrane distillation
Jianhua Zhang
Bachelor of Chemical Engineering Master of Inorganic Chemistry
Institute for Sustainability and Innovation, School of Engineering & Science, Victoria University
Submitted in fulfilment of the requirements of the degree of Doctor of Philosophy
i
Abstract
Invented in 1960s, membrane distillation is an emerging technology for water treatment attracting more attention since 1980s. There are four configurations of membrane distillation including air gap membrane distillation (AGMD), direct contact membrane distillation (DCMD), sweep gas membrane distillation (SGMD), and vacuum membrane distillation (VMD). DCMD and vacuum enhanced DCMD (VEDCMD), a variant of DCMD, were employed in this research. The objective of this study is to develop design tools for scale up of DCMD by analysing the characteristics of membrane suitable for DCMD, influences of membrane structure (hollow fibre membrane) and pressure (compressible PTFE membrane) on membrane performance, and modelling the energy efficiency of DCMD with varied process parameters.
There were four major stages in this project: a) selection of a suitable flat sheet membrane for membrane distillation based on criteria such as materials used for the active layer, active layer properties and support layer properties; b) study of a hollow fibre membrane in a tubular module, and analysis of the effect of the membrane’s asymmetric structure on its performance; c) investigation of the relationship between
applied pressure and membrane performance for compressible and incompressible membranes; and d) development of a simple relationship between membrane size, temperature and the MD flux based on experimentally determined global mass transfer coefficients, and theoretically modelling of the influence of process variables (flowrate, temperature, etc.), membrane properties (porosity, membrane thickness, etc.) and membrane geometric size on the membrane flux, energy efficiency and temperature polarisation of DCMD.
ii
membrane performance. A hydrophobic, micro-filtration, polyvinylidene fluoride (PVDF) membrane with nonwoven fabric support layer was considered, and compared to PTFE membranes with different support layers (nonwoven fabric and scrim) and different pore sizes (0.1-2 µm). The randomly structured nonwoven fabric support layer had torturous and tiny channels inside, which was apt to trap stagnant water inside so as to increase temperature polarisation. The scrim support layer had a regular structure with large, shallow, straight oval openings that reduced the chance of stagnant water being trapped inside the openings. For PTFE membranes with pore sizes of 1.5 and 2
µm, the membrane could not stop liquid water passing through the membrane even under a pressure less than 10 kPa; for PTFE membranes with pore size less than 1 µm,
better salt rejection, higher flux, and higher energy efficiency were found in the MD application process, as compared to the PVDF membrane. Additionally it was shown that PTFE membranes with larger pore size and structured support layer (scrim) had a better performance in MD for desalination than that of a membrane with small pore size or supported with nonwoven fabric. However, the PTFE membranes were formed by the stretching the PTFE membranes, so that larger pore size membranes also had a reduced thickness (if made from the same raw material), causing loss of mechanic strength. Based on experimental experience, the membranes with a thickness ≥40 µm
and pore size of 0.45-0.5 µm provided good flux and lasted longer in experiments. During this preliminary research, tests lasted for 2-6 days using reverse osmosis (RO) brines from wastewater treatment and groundwater treatment. The findings demonstrated that fouling and wetting were not a great issue in the membrane distillation when using PTFE membranes, especially for the test conducted at lower feed inlet temperature (40°C) in which the membrane performance was almost fully recovered by simply rinsing the scale off the membrane surface with de-ionised water.
In the second stage, a hollow fibre, tubular module specifically designed for membrane distillation was studied. The tubular module contains 95 hollow fibre membranes, which is made from a fluorinated polymer with a nominal pore size of 0.3 µm. To reduce the
iii
different velocities and temperatures on the global mass transfer coefficient and flux
were studied. The membrane showed high flux (18 Lm-2h-1, hot inlet temperature 80°C,
cold inlet temperature 20°C) and good salt rejection (>99%) under tested conditions. The asymmetric structure caused a large flux difference as the hot feed passing through the lumen compared to the shell side. This phenomenon was analysed by considering the heat and mass balance across each layer, from which it was found that the skin layer combining with the exponential relation between the interface temperature and vapour pressure lead to the difference. VEDCMD was also tested with this module. In the
experiments, the cold stream was drawn through the module on the shell side, and the degree of vacuum was increased by increasing the stream velocity. It was found that the
global mass transfer coefficient increased as negative pressure was applied on the cold side under the same hydrodynamic and thermal conditions. For a comparison test with positive pressure for the cold flow, a maximum global mass transfer coefficient was also found when only the cold stream velocity increased, due to the skin layer effect. In this case, the flux was reduced dramatically by swapping the feed stream from inside the fibre to outside the fibre, due to the change of heat conduction and mass transfer sequence. Therefore, based on this study, it is important to consider both the heat and mass transfers in fabrication of MD membranes.
The third stage focused on the influence of pressure on flux. From the theory of mass transfer through porous materials, it is clear that the pressure in the pore can affect mass diffusion. For compressible membranes in MD, as the air pressure in the pore increases, the rate of the water vapour diffusion slows. It is also expected that the membrane conductivity will increase due to reductions in thickness and porosity. Compressible PTFE membrane (pore size 0.5 µm) and incompressible hollow fibre membrane (pore size 0.3 µm) were used in these tests. Both the compressible and incompressible natures of the membranes were confirmed by deformation (volume change) experiments under different pressures. As the pressure increased from 3 to 63 kPa, there was negligible volume variation for the incompressible hollow fibre membrane, but there was a 1/3
iv
temperature and three different temperatures at the same velocity. The pressure in the experiment was increased in steps of 10 kPa over a total pressure increase of 40-50 kPa. There was a ±5% variation around the mean flux for the hollow fibre membrane as the pressure increased, which showed that the flux for the incompressible membrane was not related to the pressure applied on its surface. However, the flux for the PTFE membrane showed a decline with an increase in pressure. From the mass transfer theory and the thermal properties of the membrane, it can conclude that the flux reduction was directly related to the increased thermal conductivity and pressure in pores of the
membrane. Based on the heat and mass balances, the mass transfer coefficient was also calculated for different pressures, and a maximum mass transfer coefficient was found.
Therefore, the membrane mass coefficient increased initially in the lower pressure range and decreased in the higher pressure range, as the pressure rose.
The fourth stage considered the relationship between the geometric size of the membrane and flux, and a simple model for predicting the flux variation with length and temperature was developed based on the findings that the global mass transfer coefficient showed minor dependence (±<15%) on the temperatures and membrane length when the flow rate was set. A Perspex (Poly(methyl methacrylate)) module with symmetric flow channels was fabricated for this research. PTFE membranes with a nominal pore size of 0.5 µm and scrim support layer were used. The simple model predicted the flux at different temperatures and membrane lengths (5-13 cm) using the global mass transfer coefficient obtained at the same velocity. The modelling results were compared with the experimental results, and the errors varied in the range of ±<15% at different temperatures and in the range of ±<15% with different membrane lengths. Co-current and counter-current DCMD were both tested, and the counter-current DCMD showed higher flux than that of co-current DCMD under the same conditions. The study showed that shorter membrane modules had higher flux than that of longer membrane modules under the same conditions. Therefore, assessment of membrane performance by flux for membrane distillation can only be done for standard conditions
v
particular flowrate (ie. turbulence conditions in the module).
To overcome the limitations from the simple model (i.e. required experimentally determined mass transfer coefficients), a complex model was developed that required only the physical properties of the membrane as inputs. The modelling program was written in both Matlab and Visual Basic (implanted in an excel file) languages based on heat and mass balances. The model was used to predict flux for variations in the size and physical properties of membranes and process parameters. The assumptions included 1) no heat loss through the module wall, 2) the heat of vaporisation and
condensation does not change with concentration, 3) with a given membrane, the properties of the membrane, such as thickness, porosity, pore size, and tortuosity are
constant, 4) in balancing the heat transfer, the sensible heat carried by the water vapour can be neglected, 5) the stream has no temperature gradient in the direction perpendicular to the flow direction and parallel to the membrane, and 6) the mass balance neglects the mass flow difference due to vapour evaporation and condensation (ie. permeate flow is small compared to stream flows). The local convective heat transfer coefficient was calculated based on the spacer structure, channel depth and flow state, in which the Nusselt number was calculated based on the assumption of fully developed flow in a spacer filled channel. The model was also used for predicting flux
for large module sizes (0.75×0.25 m2). The error between the predicted results and
experimental results was in range of ±<15%. This compares to an experimental reproducibility of ±5%. The model was also used to examine the energy efficiency of MD and the effect of applied pressure for compressible (PTFE) membranes. The properties varied with pressure, e.g. thermal conductivity, porosity, thickness and pore size, and were calculated from experimental data obtained during the fourth stage. The difference between this model and the simple model is that::
The simple model was developed based on the experimentally obtained global
mass transfer coefficient, which varied with the velocity and flow channel structure. Therefore, in the acceptable engineering error range, this model is only suitable for predicting flux at the same velocity or above the fully developed turbulent flow regime where the global mass transfer coefficient is available in the built database.
vi
permeability (ε/bt). Thus, the model can be used to predict flux from different
velocities, temperatures, membrane lengths, and under different pressures
The findings in the study include: the scrim supported PTFE membrane has a better performance (both flux and energy efficiency) than that of the membrane supported by nonwoven fabric support layer; the flux of membrane distillation depends strongly on the membrane size along the flow direction; MD membrane performance is better
characterised by membrane mass transfer coefficient or ε/bt; for hollow fibre
membranes with asymmetric structure, the selection of feed flow channel (hot flow
through lumen or outside of the hollow fibre) has great influence on the flux; the pressure applied on the compressible membrane will affect flux and energy efficiency of
vii
Declaration
“I, Jianhua Zhang, declare that the PhD thesis entitled Theoretical and experimental
investigation of membrane distillation is no more than 100,000 words in length including quotes and exclusive of tables, figures, appendices, bibliography, references and footnotes. This thesis contains no material that has been submitted previously, in whole or in part, for the award of any other academic degree or diploma. Except where
otherwise indicated, this thesis is my own work”.
viii
Acknowledgement
I appreciate the great supervision of Professor Stephen, R. Gray, my principal supervisor, Director of Institute for Sustainability and Innovation, Victoria University. He always has been a source of knowledge and inspiration for providing clues and encouragement to solve the encountered problems in my research. Furthermore, he also gave me opportunities to undertake research in the broader filtration area, making me versatile in water treatment research.
I am also grateful to my associate supervisor, Associate Professor Jun-De Li, School of Engineering and Science, Victoria University. Under his guidance, I have obtained a comprehensive understanding of mass and heat transfers in my research area, and developed the skills of building mathematical models.
I acknowledge the CSIRO Cluster for Advanced Water Membrane Technologies for providing the financial support.
I acknowledge the help of Associate Professor Mikel Duke, Institute for Sustainability and Innovation, Victoria University. He provided constructive comments and suggestions during my paper writing.
I am thankful to our research officer, Noel Dow, Institute for Sustainability and Innovation, Victoria University. He helped me to start my research work smoothly and
gave me many effective solutions for my laboratory work.
I appreciate the generosity of all my colleagues in the Institute for Sustainability and Innovation. Dr. Peter Sanciolo helped me obtain a preliminary understanding of Reverse Osmosis, Dr. Marlene Cran helped taught me to use of IR instrument, Dr. Bo Zhu gave me the training of BET machine, and Dr. Nicholas Milne gave the opportunity of Reverse Osmosis research.
I am thankful to the support from my family. Without their help, I could not have focused completely on my Ph.D study.
Jianhua Zhang
Werribee, Australia
ix
Research Papers
Published Journal Papers arising from research described in this thesis:
[1] J. Zhang, M. Duke, E. Ostarcevic, N. Dow, S. Gray, J.-d. Li, Performance of new generation membrane distillation membranes. Water Science and Technology: Water Supply. 9(2009) 8.
[2] J. Zhang, N. Dow, M. Duke, E. Ostarcevic, J.-D. Li, S. Gray, Identification of material and physical features of membrane distillation membranes for high performance desalination, Journal of Membrane Science. 349(2010) 295-303.
[3] J. Zhang, J.-D. Li, M. Duke, Z. Xie, S. Gray, Performance of asymmetric hollow fibre membranes in membrane distillation under various configurations and vacuum enhancement, Journal of Membrane Science. 362(2010) 517-528.
[4] J. Zhang, S. Gray, J.-D. Li, Effect of applied pressure on performance of PTFE membrane in DCMD, Journal of Membrane Science. (2010) (Accepted)
[5] J. Zhang, S. Gray, J.-D. Li, Modelling heat and mass transfer in membrane distillation process, Chemical Engineering Journal. (2010) (Submitted).
Published Conference Paper:
[1] J. Zhang, Jun-De Li, Stephen Gray. Researching and modelling the dependence of MD flux on membrane dimension for scale-up purpose. AWA, Specialty III, 2009
[2] J. Zhang, N. Dow, J. Li, M. Duke and S. Gray. High-flux Hollow Fibre Module for Membrane Distillation. IWA, Beijing, 2009
x
Oral Presentations
Jianhua Zhang, Jun-De Li, Stephen Gray. Modelling for membrane distillation processes. Desalination for Clean Water and Energy, EuroMed, 3-7 October 2010, Tel Aviv, Israel
Jianhua Zhang, Jun-De Li, Stephen Gray. Researching and modelling the dependence of
MD flux on membrane dimension for scale-up purpose. AWA Membrane Specialty III,
11-13 Feburary 2009, Sydney, Australia
Poster presentations
J. Zhang, N. Dow, J. Li, M. Duke and S. Gray. High-flux Hollow Fibre Module for Membrane Distillation. IWA, Beijing, China, 2009
Jianhua Zhang, Noel Dow, Steven Mee, Jun-De Li, Mikel C. Duke and Stephen Gray. Progress on Membrane Distillation Scale-Up Using Polymer and Inorganic (Ceramic) Membranes. ICOM2008, Hawii, USA, 12-18 July 2008
xi
Table of Contents
Chapter 1 Introduction ... 1
Chapter 2 Literature review ... 5
2.1 Configurations of membrane distillation ... 5
2.2 Characteristics of membrane ... 7
2.3 Configurations of MD membranes ... 10
2.4 Configurations of MD modules ... 11
2.5 DCMD process diagram ... 13
2.6 Heat transfer and mass transfer in DCMD ... 15
2.6.1 Heat transfer ... 15
2.6.2 Mass transfer ... 19
2.7 Application of membrane distillation ... 23
2.8 Objective ... 25
Chapter 3 Identification of membrane characteristics for high performance in membrane desalination ... 26
3.1 Introduction ... 26
3.2 Experimental method ... 27
3.2.1 Membranes and their properties ... 27
3.2.1.1 Contact angle measurement ... 28
3.2.1.2 SEM characterisation ... 28
3.2.1.3 LEP measurement ... 28
3.2.1.4 Gas permeability measurement ... 30
3.2.1.5 Porosity measurement ... 31
3.2.2 DCMD Testing ... 32
3.3 Results and discussion ... 33
3.3.1 Membrane properties ... 33
3.3.2 Membrane fluxes and global mass transfer coefficients at different velocities ... 42
3.3.3 Membrane fluxes and global mass transfer coefficients at different temperatures ... 45
3.3.4 Temperature influence on membrane flux and energy efficiency ... 47
3.3.5 Key performance features of new generation membranes ... 52
3.4 Summary ... 53
Chapter 4 Performance of asymmetric hollow fibre membranes ... 55
4.1 Introduction ... 55
4.2 Theory ... 55
4.3 Experimental methods ... 57
4.3.1 Hollow fibre membrane and module ... 57
4.3.2 Characterisation of hollow fibre membrane... 58
4.3.2.1 Measurement of hollow fibre membrane dimensions ... 58
4.3.2.2 Contact angle measurement ... 59
4.3.2.3 Porosity measurement ... 63
4.3.2.4 Pore distribution and pore size measurement ... 64
4.3.2.5 SEM characterisation ... 64
4.3.3 DCMD and Vacuum Enhanced DCMD (VEDCMD) Testing ... 64
xii
4.4.1 Membrane properties ... 66
4.4.2 Experimental results ... 71
4.4.2.1 Fluxes and global mass transfer coefficients at different Reynolds numbers ... 71
4.4.2.2 Temperature influence on membrane flux... 73
4.4.2.3 Flux variation with enhanced vacuum on the cold side ... 75
4.4.2.4 Feed pressure and salt rejection ... 77
4.5 Discussion ... 77
4.5.1 Vacuum enhanced membrane distillation ... 79
4.5.2 Influence of asymmetric structure of hollow fibre membrane on flux ... 80
4.5.2.1 Mass transfer resistance analysis ... 80
4.5.2.2 Heat transfer resistance analysis ... 81
4.6 Summary ... 84
Chapter 5 Effect of applied total pressure on the performance of PTFE membranes in DCMD ... 86
5.1 Introduction ... 86
5.2 Force balance analysis at pore entrances ... 87
5.3 Experiment ... 88
5.3.1 Membrane characterisation ... 88
5.3.1.1 SEM characterisation ... 88
5.3.1.2 Air permeability measurement ... 89
5.3.1.3 Active layer porosity and thickness measurement ... 89
5.3.2 Membrane deformation measurement ... 92
5.3.3 DCMD experiments ... 94
5.4 Results and discussion ... 96
5.4.1 Analytical results and discussion ... 96
5.4.2 Deformation results and discussion ... 98
5.4.2.1 Thickness measurement of active layer under different pressures ... 98
5.4.2.2 Comparison of compressibility of PTFE and hollow fibre membrane ... 99
5.4.2.3 Calculation of pressure in the pores ...100
5.4.2.4 Estimation of pressure influence on membrane properties ...101
5.4.2.5 Estimation of mean membrane mass transfer coefficient (Cmembrane) ...105
5.4.3 DCMD experimental results and discussion ...106
5.4.3.1 Experimental results for incompressible hollow fibre membrane ...106
5.4.3.2 Compressible PTFE membrane experimental results and discussion ...109
5.4.3.2.1 Effect of applied pressure on compressible membrane at different velocities ...109
5.4.3.2.2 Effect of applied pressure on compressible membranes at different temperatures ...115
5.5 Summary ... 119
Chapter 6 Mathematical models for direct contact membrane distillation... 120
6.1 Simple model developed based on the global mass transfer coefficient ... 120
6.1.1 Introduction ...120
6.1.2 Simulation and experiment ...121
6.1.2.1 Theoretical analysis of one-dimension model for DCMD ...121
6.1.3 Experimental apparatus and procedure ...126
6.1.4 Results and discussion ...126
6.1.4.1 Verification of the modelling results ...126
6.1.4.1.1 Validating the use of the mean global mass and heat transfer coefficients in flux prediction ...126
6.1.4.1.2 Verification of the model at different temperatures ...129
xiii
6.1.4.2 Mathematical modelling of temperature profile in direct contact membrane distillation ...132
6.1.4.2.1 Prediction of temperature profile of co-and counter-current DCMD ...132
6.1.4.2.2 Prediction of temperature difference at difference velocities based on fitting equations in Fig. 6.4b ...133
6.1.4.2.3 Prediction of flux changes of co-and counter-current DCMD in flow direction at different feed velocities .135 6.2 Mathematic model of DCMD based on membrane properties and hydrodynamic and thermal conditions of streams ... 137
6.2.1 Introduction ...137
6.2.2 Theoretical analyses of the heat transfer and mass transfer ...137
6.2.3 Experiment and simulation ...138
6.2.3.1 Membrane and module characterisation ...138
6.2.3.1.1 Thermal conduction coefficient (λ/b) measurement ...138
6.2.3.1.2 Spacer and module ...139
6.2.3.2 Experimental process ...141
6.2.3.3 Modelling heat and mass transfer ...142
6.2.3.4 Numerical solution ...143
6.2.4 Results and discussion ...147
6.2.4.1 Analytical results and discussion ...147
6.2.4.2 Modelling and experimental results ...147
6.2.4.2.1 Verification of model...147
6.2.4.2.2 Application of model in analysis and discussion of co- and counter-current DCMD...155
6.2.4.2.3 Single-pass evaporation ratio variation with process parameters ...167
6.3 Summaries for both models ... 172
Chapter 7 Conclusions and Recommendations... 176
Chapter 8 Future research directions ... 183
Nomenclature ... 185
Reference ... 189
xiv
List of Tables
Table 2.1 Reported surface energy and thermal conductivity of materials used in MD [41, 51] ... 9
Table 2.2 Mass transfer mechanism in membrane pore ... 20
Table 3.1 Properties of membranes as provided by the manufacturers ... 28
Table 3.2 Measured and calculated properties of membrane ... 40
Table 3.3 Sensible heat transfer and latent heat transfer at different temperatures ... 49
Table 3.4 Flux change with side in contact with feed ... 51
Table 4.1 Nominal specifications of hollow fibre membranes ... 57
Table 4.2 Diameter calculated based the measurement from image... 59
Table 4.3 Measured height difference (h) between the top of the fibre and water surface ... 63
Table 4.4 Measured and calculated properties of membrane ... 66
Table 4.5 Estimated properties of the hollow fibre layers ... 70
Table 5.1 Calculated pore size and ε/bt from fitting equations in Fig. 5.2 ... 89
Table 5.2 Data of the tubular hollow fibre module... 95
Table 5.3 Properties of membrane ... 96
Table 6.1 Heat conduction measurement of the shim samples ... 139
Table 6.2 Dimension of module and spacer ... 140
xv
List of Figures
Fig. 2.1 Membrane distillation configurations ... 6
Fig. 2.2 Schematics of hollow fibre and flat sheet membranes ... 11
Fig. 2.3 MD Modules ... 12
Fig. 2.4 DCMD process schematic ... 14
Fig. 2.5 Heat transfer and mass transfer through membrane ... 16
Fig. 2.6 Spacer structure ... 17
Fig. 2.7 Electrical circuit analogues for different transport mechanisms ... 21
Fig. 3.1 Schematic diagram of LEP test ... 30
Fig. 3.2 Air permeability testing instrument ... 31
Fig. 3.3 Schematic diagram of the experimental setup ... 33
Fig. 3.4 SEM images of support and active layers ... 37
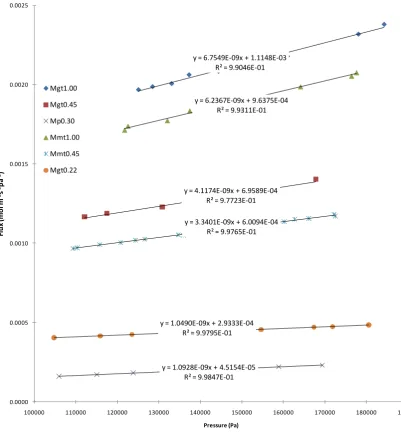
Fig. 3.5 Relations between J/∆Pgasand Ppore in nitrogen permeation test of different membranes ... 38
Fig. 3.6 Schematics of scrim embedded in the active layer ... 41
Fig. 3.7 Cross section of Mp0.30 active layer ... 41
Fig. 3.8 Relation between flux and velocity ... 42
Fig. 3.9 Mass transfer coefficients with respect to feed velocity ... 44
Fig. 3.10 Salt rejections related to feed velocity ... 45
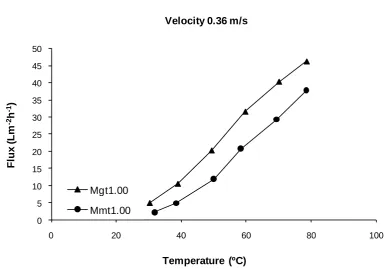
Fig. 3.11 Relation between flux and temperature for the various membranes ... 46
Fig. 3.12 Mass transfer coefficients with respect to feed inlet temperature for the various membranes .... 46
Fig. 3.13 Salt rejection at different temperatures ... 47
Fig. 3.14 Variation of flux with hot side inlet temperature at a constant velocity ... 48
Fig. 3.15 Ratio of heat for water flux to the total feed heat loss, E, at different temperatures ... 52
Fig. 4.1 Schematic diagram of the force balance at the pore entrances ... 56
Fig. 4.2 Photo for inner and outer diameter measurement of hollow fibre membrane ... 58
Fig. 4.3 Contact angle measurement for outer surface ... 60
Fig. 4.4 Mass change against the time in contact angle measurement... 61
Fig. 4.5 Contact angle measurement for the inner surface ... 62
Fig. 4.6 Schematic diagram of the experimental Setup III ... 66
Fig. 4.7 SEM images of the hollow fibre... 69
Fig. 4.8 BJH membrane pore size distribution (pore size 0.0017-0.3 μm) ... 70
Fig. 4.9 Influence of velocity on flux and global mass transfer coefficient ... 72
Fig. 4.10 Flux and global mass transfer coefficient affected by temperature ... 74
Fig. 4.11 Vacuum enhanced membrane distillation ... 76
xvi
Fig. 4.13 Schematic of the idealised membrane structure and temperature distribution ... 78
Fig. 4.14 Vapour pressure difference across skin layer at different temperatures (ΔT=0.31˚C) ... 83
Fig. 5.1 Schematic of force balance in the pore ... 88
Fig. 5.2 Results of gas permeation test ... 90
Fig. 5.3 Schematic of membrane deformation measure measurement ... 93
Fig. 5.4 Volume change under different pressures in blank experiment ... 94
Fig. 5.5 Schematic diagrams of the employed DCMD process ... 95
Fig. 5.6 Images for membrane structures ... 97
Fig. 5.7 Thickness change under different pressures for the PTFE membranes ... 98
Fig. 5.8 Ratio of volume change to total active layer volume under pressure ... 99
Fig. 5.9 Applied pressure vs calculated pressure in the pore of PTFE membrane ... 100
Fig. 5.10 εp1.5(1-εp) vs porosity variation ... 102
Fig. 5.11 Thermal properties changes under pressure ... 105
Fig. 5.12 Hollow fibre flux vs applied pressure at different velocities ... 107
Fig. 5.13 Hollow fibre flux vs applied pressure at different feed inlet temperatures ... 108
Fig. 5.14 Flat sheet PTFE flux vs applied pressure ... 111
Fig. 5.15 Changes of thermal conditions under different pressures (Tfi=60°C, Tpi=20°C) ... 113
Fig. 5.16 Mean membrane mass transfer coefficient under different pressures ... 114
Fig. 5.17 Flux changed with varied pressures at different temperatures ... 116
Fig. 5.18 Changes of thermal conditions under different pressures ... 118
Fig. 5.19 Mean membrane mass transfer coefficient under different pressures (Velocity=0.097 m/s) .... 119
Fig. 6.1 Heat and mass transfer element of a co-current DCMD... 123
Fig. 6.2 Schematic diagram for numerical flux calculation of co-current flow ... 124
Fig. 6.3 Schematic diagram for numerical flux calculation of counter-current flow ... 125
Fig. 6.4 Validation of mean global mass and heat transfer coefficients with velocity ... 128
Fig. 6.5 Comparison between experimental and modelling results at different temperatures for counter-current setup ... 129
Fig. 6.6 Comparison between experimental and modelling results for different membrane lengths in counter-current setup ... 131
Fig. 6.7 Comparison between experimental and modelling results for different membrane lengths in co-current setup ... 131
Fig. 6.8Temperature distributions along the membrane for co-current flow ... 132
Fig. 6.9Temperature profile along the membrane for counter-current flow ... 133
Fig. 6.10Average temperature difference across the membranes at different velocities ... 134
Fig. 6.11Flux at different velocities... 135
Fig. 6.12Flux changes of co-current DCMD in flow direction at different velocities ... 136
Fig. 6.13Flux changes of counter-current DCMD in flow direction at different velocities ... 136
Fig. 6.14 Dimensions of the module and spacer ... 141
Fig. 6.15 Flow chart for co-current DCMD modelling ... 145
xvii
Fig. 6.17 Model verified at different velocities ... 148
Fig. 6.18 Model verified at different temperatures ... 150
Fig. 6.19 Relationship between the recovery and temperatures and velocity ... 151
Fig. 6.20 Relationship between single pass recovery and modelling error ... 151
Fig. 6.21 Pressure analysis in counter- and co-current DCMD ... 152
Fig. 6.22 Accuracy assessment with varied membrane lengths ... 154
Fig. 6.23 Modelled temperature distribution in counter- and co-current DCMD ... 156
Fig. 6.24 Percentage flux difference between counter current and co-current modes ... 158
Fig. 6.25Temperature polarisation coefficient vs feed velocity ... 160
Fig. 6.26 Local flux distribution vs membrane length ... 162
Fig. 6.27Local temperature polarisation coefficient distribution vs membrane length ... 163
Fig. 6.28 Flux and temperature polarisation affected by temperature ... 165
Fig. 6.29 Influence of membrane characteristics on flux... 166
Fig. 6.30 Evaporation ratio and flux at different process conditions ... 170
1
Chapter 1
Introduction
Membrane distillation (MD) is one of the membrane-based separation processes. The driving force for MD processes is quite different from other membrane processes. It is
the vapour pressure difference across the membrane, rather than a pressure or concentration gradient or an electrical potential gradient, which drives mass transfer through a membrane.
Membrane distillation was introduced in the late 1960s [1, 2]. However, it was not commercialised at that time for desalination purposes. There were two major factors hindering its development [3]: 1) membranes with adequate characteristics and reasonable cost were not available, and 2) there were some negative opinions obtained long ago about the economics of the process [4]. The opinion was based on typical data from those membranes and systems which are far-from optimal, and showed that the temperature polarization coefficient was roughly estimated by Schofield et al. [5] to be 0.32. Hence, for this system, when the temperature difference between the bulk temperature of hot and cold channels is 10°C, the actual temperature difference across the membrane is only 3.2°C. In the 1980s, with the availability of new membranes, more research focused on membrane distillation and many novel MD modules were designed based on improved understanding of the mass and heat transfer principles of MD [6-8]. Furthermore, new applications for membrane distillation [9, 10] were considered in environmental protection and wastewater treatment.
The membrane distillation process was defined in the “Round Table” at the “Workshop on Membrane Distillation” in Rome on May 5, 1986. According to the Terminology for
Membrane Distillation [11], the MD process should have the following characteristics:
the membrane should be porous,
the membrane should not be wetted by process liquids,
no capillary condensation should take place inside the pores of the membranes,
only vapour should be transported through the pores of the membrane,
the membrane must not alter the vapour equilibrium of the different components
in the process liquids,
2 liquid, and
for each component, the driving force of the membrane operation is a partial
pressure gradient in the vapour phase.
Therefore, in MD systems, the micro-porous hydrophobic membranes only allow water in the vapour state, but not in the liquid state, to pass through, and the driving force is the effective vapour pressure difference produced by temperature difference and/or reduced pressure across the membrane. Since its driving force is thermal, membrane distillation is not very sensitive to the feed concentration. In comparison with other pressure/potential-driven membrane separation processes and technologies for desalination, MD has some distinctive advantages, such as a theoretically complete rejection of non-volatile components, low operating pressure, large membrane pore size, reduced vapour space compared to conventional distillation (Multi-Stage Flash Distillation), and low operating temperature (40-80°C) of the feed [10]. Thus, theoretically MD is not nearly as sensitive to feed concentration as that of RO, has relative smaller footprint than Multi-Stage Flash Distillation (MSF), and is able to utilise low-grade heat energy.
According to the characteristics of membrane distillation, many technologies have been developed. Because of its capability of utilising low grade heat, membrane distillation has been coupled with solar energy systems [12] to develop zero liquid discharge desalination systems. Membrane distillation can also be used to provide potable water in remote areas with low infrastructure and without connection to a grid [9, 13], due to its simple structure and low maintenance requirement.
The cost of desalination or separation processes varies from location to location as the conditions of the processed water and the nature and the size of the plant are different. Many leading cost components of MD are not yet known because the process has not been applied in commercial size to have the cost benefits of mass production; neither are factors such as permeate flux, pretreatment, fouling and membrane life known adequately yet. In an economic evaluation to assess the feasibility of direct contact membrane distillation (DCMD), the estimated cost for DCMD with heat recovery was
$1.17-4.04 m−3 [3, 9, 14, 15], which was comparable to the cost of water produced by
conventional thermal processes: i.e. around $1.00 m−3 for multiple effect distillation
3
claimed to be able to obtain very competitive water cost (¢26 m−3) when they operated
MD using cheap industrial waste steam [16, 17]. The cost estimated by [18] based on a
fully developed MD technology was $0.782 m-3 with a purified water production rate of
3,800 m3/day and heat recovery of 30%.In recent years, some pilot plants have been
established or designed. One of the layouts to be implemented in Almeria (Spain) using solar energy involves the concept of multi-step MD [9], which will minimise the cost of specific energy and membrane area required.
A 2 m3/day pilot plant using MEMSTILL® was tested at Senoko Refuse Incineration
Plant from February 2006 to June 2007, from which the principle of MEMSTILL® and sustainable operation of the M26 type MEMSTILL® module were demonstrated on a
pilot scale [16, 19]. The scaling-up of 3 m2 (membrane area) bench scale to 600 m2
proved that the integrity of membrane modules and no severe leakage was observed. The distillate quality was very high throughout the pilot plant study period. Future study will address some issues discovered during this pilot study regarding pre-treatment, heat recovery, etc. The MEMSTILL® Singapore pilot also pointed out certain areas for improvement to meet commercialization requirements.
According to previous research [20], there are two major criteria hindering the application of membrane distillation: one is the kind of membrane suitable for membrane distillation and the other is energy efficiency improvement by controlling the process parameters or membrane properties. Accordingly, this study has been divided into four stages:
1. selection of a suitable membrane for membrane distillation based on the criteria,
such as materials used for the active layers, active layer properties and support layers,
2. study of hollow fibre membranes in a tubular module, and analysis of the effect
of the membrane asymmetric structure on the membrane performance,
3. experimentally investigating the relationship between pressure applied on the
membrane surface and membrane performance, and
4. mathematical modelling including two parts:
experimentally researching on relationship between membrane geometric size
4
theoretically modelling the influences of process parameters (flowrate,
temperature, etc.), membrane properties (porosity, membrane thickness, etc.) and membrane geometric size on the membrane flux and temperature
polarisation, and researching the influences of process parameters (flowrate, temperature, etc.), membrane properties (porosity, membrane thickness) and membrane geometric size on energy efficiency of DCMD.
5
Chapter 2
Literature review
2.1 Configurations of membrane distillation
Membrane distillation is a thermally driven process. Mass transfer in gas phase is driven by a vapour pressure difference, arising from a temperature difference or reduced pressure, across the membrane, and from the feed side to the permeate side.
Fig. 2.1 illustrates four configurations of the MD system, which differ based on the nature of the cold side processing of the permeate [3, 11]:
Direct Contact Membrane Distillation (DCMD), in which the membrane is only
in direct contact with liquid phases. This is the simplest configuration capable of producing considerable flux. It is best suited for applications such as desalination and concentration of aqueous solutions (e.g., juice concentrates) [21-26].
Air Gap Membrane Distillation (AGMD), in which an air gap is interposed
between the membrane and a condensation surface. The configuration has the highest energy efficiency, but the flux obtained is in general low. The air gap configuration can be widely employed for most membrane distillation applications [27].
Vacuum Membrane Distillation (VMD), in which the permeate side is vapour or
air under reduced pressure, and if needed, permeate is condensed in a separate device. This configuration is useful when volatiles are being removed from an aqueous solution. [28, 29].
Sweep Gas Membrane Distillation (SGMD), in which stripping gas is used as a
6
Fig. 2.1 Membrane distillation configurations
Due to its simple structure and high flux relative to AGMD and SGMD, laboratory-scale DCMD has been widely studied [35]. The main disadvantage for DCMD in commercial applications is its low energy efficiency. Although the polymeric membrane
generally has low thermal conductivity, the driving force (temperature difference between the feed and permeate sides) for mass transfer will also lead to a great
conductive heat transfer through the membrane due to the small membrane thickness, so only part of the supplied heat energy is used for production. Of the four configurations, DCMD has the highest heat conduction loss, which results in relatively low thermal efficiency (defined as the fraction of heat energy used for evaporation) [36, 37].
In AGMD, the air gap is usually the controlling factor for the mass and heat transfers [38] because of its greater thermal and mass transfer resistances. In comparison with the thickness (40-250 µm) and conductivity of the membrane, the air gap is much thicker (general 2,000-10,000 µm) [39, 40] and has lower thermal conductivity. Therefore, more heat energy in AGMD will be used for water evaporation than that of DCMD. Additionally, if a low temperature feed is used as the cooling stream in this configuration, the latent heat can be recovered through the condensation of the vapour on the cooling plate. However, the AGMD has a typical low flux with the same temperature difference between the feed and permeate streams as that of DCMD, due to the high mass transfer resistance across the air gap [3, 27, 40].
7
greater driving force originating from the reduced vapour pressure on the permeate side of the membrane, and has less heat loss through the membrane. However, an external condenser and an air blower or compressed air are needed to maintain the running of this configuration, which will cause an increase in investment [32] and running costs.
In VMD, the vapour permeate is removed continuously from the vacuum chamber to form a vapour pressure difference across the membrane. Theoretically, this configuration can provide the greatest driving force at the same feed temperature, because the vapour pressure at the cold side can be reduced to almost zero. An external
condenser is required as for AGMD, if the liquid permeate is the product.
Of the four configurations, DCMD is the most popular for MD laboratory research, with more than half of the published references for membrane distillation based on DCMD [3, 22, 35, 41]. However, AGMD is more popular in commercial applications, because of its high energy efficiency and capability for latent heat recovery [16, 19].
2.2 Characteristics of membrane
In membrane distillation, membranes on the basis of their selective properties are not involved in the mass transport phenomena, but are involved in heat transport from the hot side to the cold side. Therefore, compounds transferred across the membrane in gas phase are driven by vapour pressure differences based on vapour-liquid equilibrium, and the microporous polymeric or inorganic membrane employed between the permeate and feed sides acts as a physical barrier providing the interfaces where heat and mass are simultaneously exchanged. Thus, the properties of membranes suitable for membrane distillation should include [11, 42-46]:
an adequate thickness, based on a compromise between increased membrane
permeability (tend to increase flux) and decreased thermal resistance (tend to reduce heat efficiency or interface temperature difference) as the membrane becomes thinner,
reasonably large pore size and narrow distribution of pore size, limited by the
8
(2.1)
where B is a geometric factor, γl is the surface tension of the solution, θ is the
contact angle between the solution and the membrane surface which depends on
the hydrophobicity of the membrane, rmax is the largest pore size, Pprocess is the
liquid pressure on either side of the membrane, and Ppore is the air pressure in the
membrane pore.
low surface energy, equivalent to high hydrophobicity. Based on Eq. (2.1),
material with higher hydrophobicity can be made into membranes with larger pore sizes, or membranes made from more hydrophobic material will be applicable under higher pressures for a given pore size,
low thermal conductivity. High thermal conductivities increases sensible heat
transfer and reduce vapour flux due to lowered interface temperature difference, and
high porosity. High porosity increases both the thermal resistance and the
permeability of MD membranes, so both the heat efficiency and flux are increased. However, high porosity membranes have low mechanical strength and tend to crack or compress under pressure, which results in the loss of membrane performance.
The most common materials used for MD membranes are polytetrafluoroethylene (PTFE), polypropylene (PP) and polyvinylidenefluoride (PVDF) [47]. The porosity of
the membranes used is in the range of 0.06 to 0.95, the pore size is in the range of 0.2 to 1.0 μm, and the thickness is in the range of 0.04 to 0.25 mm [3, 48]. The surface
energies and thermal conductivities of these materials are listed in Table 2.1.
9 hydrophobicity and porosity.
Table 2.1 Reported surface energy and thermal conductivity of materials used in MD [41, 51]
Membrane Material Surface Energy (×10-3 N/m)
Thermal Conductivity
(W.m-1K-1)
PTFE 9.1 0.25
PP 30.0 0.17
PVDF 30.3 0.19
Sintering, stretching, and phase inversion are some of the methods to fabricate MD membranes from these materials [51-53].
The sintering method can be used to prepare PTFE membranes [54, 55]. In the sintering process, polymeric powder is pressed into a film or plate and sintered just below the melting point. The porosity of the membranes made in this manner is in the range of 10–40% and typical pore sizes are in the range of 0.2 to 20 µm.
Stretching technology can be used to make PP and PTFE membranes. In this process,
films are formed by extrusion from a polymeric powder at temperatures close to the melting point coupled with a rapid draw-down. The membranes made have pore sizes in the range of 0.2–20 µm and porosity of about 90% [41, 48, 56].
Phase inversion can be used to produce PVDF membranes. In this process, the polymer is dissolved in an appropriate solvent [57] and spread as a 20–200 µm thick film on proper supports, such as nonwoven polyester, PP backing material or PP scrim backing [48, 58], and an appropriate precipitant (typically water) is added to split the homogeneous solution film into two phases (a solid polymer rich phase and a liquid rich phase). The prepared membrane has a pore size in the range of 0.2 to 20 µm, and porosity of approximately 80% [59].
10
2.3 Configurations of MD membranes
There are two common types of membrane configurations shown in Fig. 2.2:
hollow fibre membrane mainly prepared from PP, PVDF, and PVDF-PTFE
composite material [59, 61], and
flat sheet membrane mainly prepared from PP, PTFE, and PVDF.
Compared with flat sheet membranes, hollow fibre membranes have relatively large specific surface areas [62], but the main impediment of the hollow fibre module was its
typically low flux (generally 1-4 L.m-2h-1 at 40-60°C) [63-65]. However, high-flux
hollow fibre membranes with different features suitable for membrane distillation have
been developed recently, such as dual-layer hydrophilic-hydrophobic fibres with a very
thin effective hydrophobic PVDF layer (50 µm), and hollow fibre membranes with a
sponge-like structure and thin walls [59, 63, 66, 67], which have flux of about 50-70
kgm-2h-1 at about 80-90°C. This flux is as high as that from flat sheet membrane.
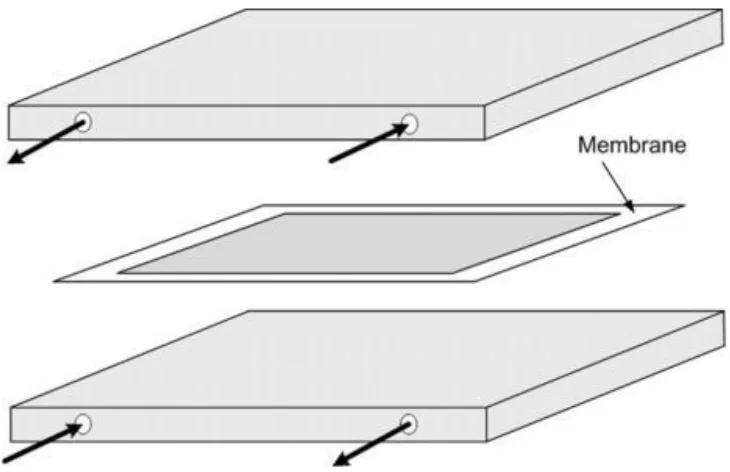
11
b. Flat sheet membrane
Fig. 2.2 Schematics of hollow fibre and flat sheet membranes
The reported flux from flat sheet membranes is typically 20-30 Lm-2h-1 [3] at inlet
temperatures of hot 60°C and cold 20°C. In general, the polymeric membrane shown in Fig. 2.2b is composed of a thin active layer and a porous support layer. This structure is able to provide enough mechanic strength for the membrane, so it enables the active layer to be manufactured as thin as possible, which reduces the mass transfer resistance.
As the flux from membrane distillation is related to the membrane size (in the flow direction), it is more appropriate to compare membrane performance with the mass transfer coefficient rather than the flux from different research works. However, it is difficult to calculate the mass transfer coefficients from the different works, because of the insufficient provision of data. Therefore, the flux provided here is only used as an approximate indication of performance.
2.4 Configurations of MD modules
There are three major MD module configurations [35], which are the spiral wound (flat
sheet), hollow fibre and the plate & frame modules. All of these modules have been used in pilot plant trials [19, 68, 69].
12
can have a very high packing density (3,000 m2/m3) [41, 70]. The feed is introduced
into the shell side or into lumen side of the hollow fibres, and cooling fluid, sweeping gas, or negative pressure can be applied on the other side to form VMD, SGMD, or DCMD. Because of its large active area combined with a small footprint, hollow fibre tubular module has great potential in commercial applications [41]. Although broken hollow fibres can not be replaced, it can be detected by the liquid decay test (LDT) [71, 72] and pinned afterward.
a. Tubular module for hollow fibre
b. Plate & frame module for flat sheet membrane
13
Fig. 2.3b shows the structure of the plate & frame module. This module is suitable for flat sheet membranes and can be used for DCMD, AGMD, VMD, and SGMD. In this
configuration, the packing density is about 100–400 m2/m3 [41, 69]. Although this
configuration has a relatively smaller effective area for the same volume when compared to the tubular modules, it is easy to construct and multiple layers of flat sheet MD membranes can be used to increase the effective area. As shown in Fig. 2.3b, it is easy to change damaged membranes from this configuration. Thus, this module is widely employed in laboratory experiments for testing the influence of membrane
properties and process parameters on the flux or energy efficiency of membrane distillation [41].
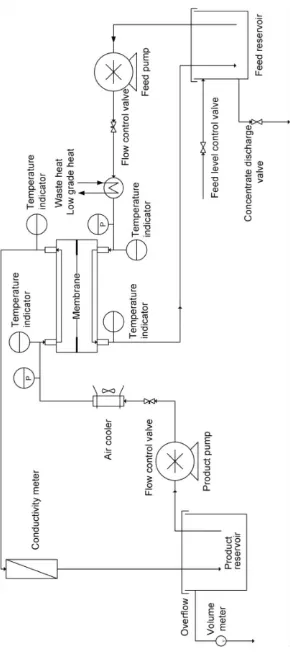
2.5 DCMD process diagram
14
15
2.6 Heat transfer and mass transfer in DCMD
DCMD processes use a temperature difference as the driving force for mass transfer through the membrane. Thus, heat and mass transfers in MD are coupled together, and are in the same direction from the hot side to the cold side [73]. Fig. 2.5 illustrates these
processes in DCMD. The feed temperature, Tf,drops across the feed side boundary layer
to T1 at the membrane surface. Some water evaporates and is transported through the
membrane. Simultaneously, heat is conducted through the membrane to the cold
(permeate) side. The cold flow temperature Tp increases across the permeate boundary
layer to T2 at the membrane surface on the cold sideas water vapour condenses into the
fresh water stream and gains heat from the feed side. The driving force is therefore, the
vapour pressure difference between T1 and T2, which is less than the vapour pressure
difference between Tf and Tp. This phenomenon is called temperature polarisation. The
temperature polarization coefficient is defined by [5]
(2.2)
2.6.1 Heat transfer
Heat transfer through the feed side to the permeate side includes two steps [35]: first, heat transfers from the hot side to the cold side across the membrane in the forms of sensible heat and latent heat, so as to form the temperature difference between boundary layer and bulk flow; second, the heat transfers from the bulk flow of the feed to the boundary layer via heat convection, due to the temperature difference arising from the first step. In the first step, as shown in Fig. 2.5, the sensible heat is conducted through the membrane to the cold side, and the latent heat is carried by the water vapour which is evaporated from the interface between the hot stream and membrane pores and
condensed at the interface between the pores and cold stream [23]. The feed temperature
(Tf) drops across the boundary layer on the feed side to T1. The permeate temperature Tp
increases across the permeate boundary layer to T2. The vapour pressure difference
across the membrane depends on the temperature T1 and T2, and the driving force is
therefore PT1-PT2 where PT1 and PT2 are the vapour pressures at T1 and T2, respectively.
16
Fig. 2.5 Heat transfer and mass transfer through membrane
According to the two heat transfer processes, the heat balance of the feed stream can be
described by [73, 75, 76].
(2.3)
(2.4)
(2.5)
because ,
(2.6)
where Q1 or Q2 are the total heat transferred from the hot side to the cold side, λ is the
thermal conductivity of the membrane, b is the membrane thickness, ε is the membrane
porosity, A is the membrane area, αf is the convective heat transfer coefficient on the hot
side, J is the permeate flux, and Hlatent is the latent heat of vaporization. In Eq. (2.6),
(λ/b)A(T1-T2 ) is the sensible heat loss through the membrane and JHlatentis the heat of
17
loss, the heat transfer coefficient (λ/b) of the membrane needs to be reduced by lowering
λ or increasing the membrane thickness. Since increasing the thickness of the
membrane will also increase the mass transfer resistance, reducing the membrane thermal conductivity by making the membrane more porous (shown in Eq. (2.4)) is an effective method, since the thermal conductivity of the air is in general one order of magnitude less than that of the membrane material. Also, the more porous the membrane is, the lower the resistance of the membrane to the transport of the vapour across the membrane. In practice, the membrane thickness is limited by its mechanical
strength. To maximise flux, it is necessary to increase the temperature difference between the hot and cold sides or to increase the temperature polarisation coefficient
[77, 78]. Therefore, it is necessary to improve the convective heat transfer coefficient for purpose of producing more flux based on Eqs. (2.3), (2.5) and (2.6). The convective heat transfer coefficient can be expressed as [79],
(2.7)
where λf is thermal conductivity of the feed, and
is the temperature
gradient in the thermal boundary layer of the feed. From Eq. (2.7), it can be found that the convective heat transfer coefficient can be improved effectively by reducing the thickness of the thermal boundary layer.
18
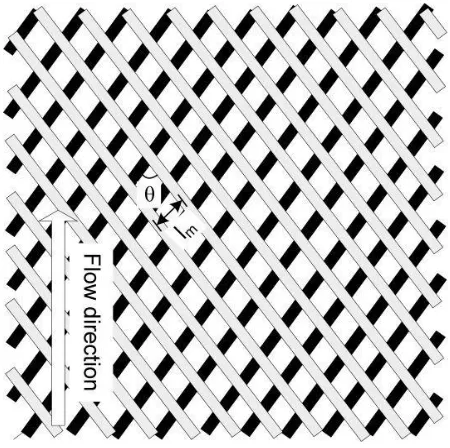
The presence of turbulence promoters, e.g. net-like spacers or zigzag spacers shown in Fig. 2.6 can effectively reduce the thickness of the thermal boundary layer and improve
αf [80-82], and it is also important that high heat transfer rates are achieved with a low
pressure drop in the channels where the feed solution and cooling liquid are flowing [36, 77, 78, 80, 83]. From reported data [77], the temperature polarisation coefficient of
spacer filled channelsfalls in the range of 0.9–0.97, in comparison with a temperature
polarisation coefficient 0.57–0.76 in the flowing channel without spacer. Reynolds
number for the spacer filled flat channel is expressed by [77, 80, 84]
(2.8)
where v is the velocity in the spacer filled channel, ρ is the density of the liquid steam,
dh is the hydraulic dimeter of the spacer filled channel, and μ is the liquid viscosity. The
velocity v can be calculated by [80]
(2.9)
where Qf/p is the volumetric flow rate of feed/permeate, εspacer is the porosity of the
spacer, and Acrossis the cross sectional area of empty channel. The hydraulic diameter dh
can be calculated by [81]
(2.10)
where hsp is the spacer thickness, and Sspacer is the specific surface of the spacer
expressed by
(2.11)
where df is diameter of spacer filaments. The spacer porosity can be measured
experimentally or calculated by
(2.12)
where lm is mesh size.
19
2.6.2 Mass transfer
Mass transfer in the MD process includes three steps: firstly the hot feed vaporizes from the liquid/gas interface, secondly the vapour is driven by the vapour pressure difference and defuses from the hot interface to the cold interface through the pores, and thirdly the vapour condenses into the cold side stream [48]. Therefore, there are two major factors controlling the mass transfer: one is the vapour pressure difference, and the other is the permeability of the membrane.
The influence of the membrane physical properties on membrane distillation includes:
1) the effective area for mass transfer is less than the total membrane area because the membrane is not 100% porous,
2) for most practical membranes, the membrane pores do not go straight through the membrane and the path for vapour transport is greater than the thickness of the membrane, and
3) the inside walls of the pores increase the resistance to diffusion by decreasing the momentum of the vapour molecules.
If the fluid dynamics conditions on both sides of the membrane could be considered good, mass transfer through the membrane may be the limiting step for mass transfer in MD [85].
The mass transport mechanism in the membrane pores is governed by three basic mechanisms known as Knudsen-diffusion (K), Poiseuille-flow (P) and Molecular-diffusion (M) or a combination between these known as the transition mechanism [35,
86]. The Knudsen number (Kn) is used to indicate the dominant mass transfer
mechanism in the pores.
Kn=l/d (2.13)
where d is the mean pore size of the membrane and l is the mean free path of the
molecules defined by [87, 88]
20
where kB is the Boltzman constant (1.381×10⁻²³ JK−1), σw and σa the collision diameters
for water vapour (2.641×10⁻¹⁰ m) and air (3.711×10⁻¹⁰ m) [89], T is the mean
temperature in the pores, and mw and ma are the molecular weights of water and air. At a
typical membrane temperature of 60°C, the mean free path of the water vapour in the membrane pores is 0.11 m. Table 2.2 shows the dominating mass transfer mechanism
based on the Kn in a gas mixture system without a total pressure difference [85].
Because the pore sizes of the membranes used for membrane distillation are in the range
of 0.2 to 1.0 μm, Kn will be in the range of 0.5 to 0.1. Thus, the dominant mass transfer
mechanism is Knudsen-molecular diffusion transition mechanism in DCMD. Although
the pore size distribution of the polymeric membrane will affect the mass transfer mechanism, the majority of the membrane area will be governed by the transition region as verified by Phattaranawik et al. [90], and as there is no total pressure difference existing in the pore, the Poiseuille flow can be ignored [35].
Table 2.2 Mass transfer mechanism in membrane pore
The molecular mass transport mechanisms through a membrane pores are shown as an electrical circuit analogue [3, 90] in Fig. 2.7a. There are also two other popular mass transfer models for membrane distillation, which are Schofield’s model [75, 91] shown
in Fig. 2.7b and the dusty-gas model shown in Fig. 2.7c for DCMD [92, 93].
a. Electrical circuit analogue for mass transfer mechanism in membrane pore
Kn<0.01 0.01<Kn<1 Kn>1
Molecular diffusion
Knudsen-molecular diffusion transition
mechanism
21
b. Electrical circuit analogue for Schofield’s model
c. Electrical circuit analogue for the dusty-gas model
Fig. 2.7 Electrical circuit analogues for different transport mechanisms
According to the theory of the mass transfer shown in Fig. 2.7a, the mass transfer through the membrane pore can be expressed as [35, 90]
,
with
, and
(2.15)
where Jm and Jk are the vapour flux through the membrane arising from molecular and
Knudsen diffusion, b is membrane thickness, t is the pore tortuosity, R (=8314
Pa.m3.mol-1.K-1) is the universal gas constant, M is the molecular mass of the vapour,
22
calculated by the Antoine equation [94]. According to [35, 82, 95], the diffusivity of
water vapour (A) relative to air (B) DAB (m2/s) in the temperature range of 273-373 K
can be estimated from,
(2.16)
The Schofield’s model shown in Fig. 2.7b is developed from kinetic theory and
assuming that the sum of Knudsen permeability and viscous permeability equals the total permeability, in which the transition region between the Knudsen and viscous flows is described,
, in which
, and (2.17)
where the gas’ mean molecular speed, and σ the collision cross-section.
In the “Dusty-Gas” model [92, 96], the porous membrane is assumed as an array of dust
particles held stationary in space, and the dust particles in terms of the classical kinetic theory of gases are supposed to be giant molecules in the interactions between gas and
surface. Based on this model, a general flux equation for a gas that permeates through a porous media in the Knudsen–viscous transition region can be described as:
, in which
, and
(2.18)
These equations of different mass transfer models can all be simplified as [48]
, in which
(2.19)
where a is an exponent coefficient in range of 1-2. Cmembrane is an important parameter to
23
Therefore, in our study, the performances of different membranes were compared under the same hydrodynamic and thermal conditions and subsequently under the same
boundary layer conditions. A global mass transfer coefficient Cglobal, calculated from the
bulk temperatures and which includes mass transfer phenomena in the boundary layer, was used to assess MD membranes.
From Eq. (2.19), the flux for MD can be increased by increasing pore sizes and porosity, and reducing the thickness of the membrane. However, from Eq. (2.4), reducing the thickness of the membrane also increases the sensible heat loss from the hot side to the
cold side, which leads to a reduction of water flux due to decreased interfacial temperature differences (vapour pressure difference). Therefore, there is an optimum
membrane thickness for membrane distillation efficiency.
In reviewed literature, there were many references to mass transfer relating to transmembrane phenomena. However, modelling focused on scale-up was not identified.
In analysis, it was found that the mass transfer coefficient will not be affected greatly by the temperature and flow rate, and the temperature changes (40-80°C) in MD will have little effect on the boundary layer. Therefore, a simple model can be developed to predict the flux from different feed temperatures and membrane sizes at given flow rates, based on an approximately constant global mass transfer coefficient [48] which is calculated from the bulk hot and cold temperatures at this flow rate and includes both the mass transfer phenomena across the membrane and boundary layer.
Furthermore, from the analysis of the channel and spacer conditions, a more general model can be developed based on the air permeability and thermal conductivity of the membrane, which can be used at different flow rates, temperatures and membrane sizes.
2.7 Application of membrane distillation
Although MD is currently used mostly at the laboratory scale, membrane distillation has potentially distinctive advantages in some particular areas [3, 41]. There are several
pilot plants currently undergoing field trials: for treating wastewater from a power plant (in Singapore) [19], and wastewater in a chemical plant (The Netherlands) by
24
i.e., the RO concentrate treatment, ground water treatment and solar heat utilisation [97-99].
Producing high-purity water from salty water is one of the main MD applications. Since 1982, Gore [100] proposed MD membrane modules for desalting NaCl aqueous solutions. Papers related to MD research in desalination processes increased dramatically in the following years [4, 31, 69, 101]. Different types of hydrophobic membranes and configurations [102, 103] were studied for desalination purposes. Coupling membrane distillation with solar energy was studied and has demonstrated the
feasibility of solar powered MD in which 60-80% of the energy was recovered [104-106]. Membrane distillation may also be integrated with reverse osmosis processes to
increase the water recovery in the desalination plants [104, 107] by treating the brine. Lawson and Llyod (1996) [84] stated that membrane distillation can be a viable process for desalination, while Schneider et al (1988) [85] have argued that small, portable desalination units utilising waste heat are more feasible for the applications of MD.
Membrane distillation also can be used for water treatment, such as removing heavy metal from wastewater [108], recovering HCl from cleaning solution in electroplating [109], concentrating sulphuric acid to recover lanthane compounds in apatite phosphogypsum extraction process [110], eliminating radioisotopes and reducing the waste volume from nuclear industry [111] and removing volatile organic components from dilute aqueous solutions [28, 29, 112, 113].
Due to the low feed temperature, MD can also be used for concentrating solutions in the food industry. It has been widely tested for the concentration of many juices including orange juice [25], apple juice [114] and sugarcane juice [115].
MD was also employed for selective extraction of volatile solutes and solvents for applications in the health and fermentation industries. Blood and plasma were treated by MD in order to promote a solute-free extraction of water from biomedical solutions
without loss in quality [116, 117]. Membrane distillation has also been suggested as an innovative tool to ameliorate treatment of uraemia by allowing purification of the blood