Learning to Annotate Scientific Publications
Minlie Huang
State Key Laboratory of Intelligent Technology and Systems, Dept. Computer Science and
Tech-nology, Tsinghua University
Zhiyong Lu National Center for Bio-technology Information (NCBI),
U.S. National Library of Medi-cine, National Institutes of Health
Abstract
Annotating scientific publications with keywords and phrases is of great importance to searching, indexing, and cataloging such documents. Unlike previous studies that focused on user-centric annotation, this paper presents our investigation of various annotation characteristics on service-centric anno-tation. Using a large number of publicly available annotated scientific publica-tions, we characterized and compared the two different types of annotation processes. Furthermore, we developed an automatic approach of annotating scientific publications based on a machine learning algorithm and a set of novel features. When compared to other methods, our approach shows significant-ly improved performance. Experimental data sets and evaluation results are pub-licly available at the supplementary web-site1.
1 Introduction
With the rapid development of the Internet, the online document archive is increasing quickly with a growing speed. Such a large volume and the rapid growth pose great challenges for docu-ment searching, indexing, and cataloging. To facilitate these processes, many concepts have been proposed, such as Semantic Web (Berners-Lee et al., 2001), Ontologies (Gruber, 1993), Open Directory Projects like Dmoz2,
1 http://www.ncbi.nlm.nih.gov/CBBresearch/Lu/indexing 2http://www.dmoz.org/
mies (Hotho et al., 2006), and social tagging sys-tems like Flickr and CiteULike. Annotating doc-uments or web-pages using Ontologies and Open Directories are often limited to a manually con-trolled vocabulary (developed by service provid-ers) and a small number of expert annotators, which we call service-centric annotation. By contrast, social tagging systems in which regis-tered users can freely use arbitrary words to tag images, documents or web-pages, belong to us-er-centric annotation. Although many advantag-es have been reported in user-centric annotation, low-quality and undesired annotations are always observed due to uncontrolled user behaviors (Xu et al., 2006; Sigurbjörnsson and Zwol, 2008). Moreover, the vocabulary involved in user-centric annotation is arbitrary, unlimited, and rapid-growing in nature, causing more difficul-ties in tag-based searching and browsing (Bao et al., 2007; Li et al., 2007).
Service-centric annotation is of importance for managing online documents, particularly in serv-ing high-quality repositories of scientific litera-ture. For example, in biomedicine, Gene Ontolo-gy (Ashburner et al., 2000) annotation has been for a decade an influential research topic of un-ifying reliable biological knowledge from the vast amount of biomedical literature. Document annotation can also greatly help service providers such as ACM/IEEE portals to provide better user experience of search. Much work has been de-voted to digital document annotation, such as ontology-based (Corcho, 2006) and semantic-oriented (Eriksson, 2007).
biomedical domain. We first analyze human an-notation behaviors in two millions previously annotated documents. When compared to user-centric annotation, we found that the two annota-tion processes have major differences and that they also share some common grounds. Next, we propose to annotate new articles with a learning method based on the assumption that documents similar in content share similar annotations. To this end, we utilize a logistic regression algo-rithm with a set of novel features. We evaluate our approach with extensive experiments and compare it to the state of the art. The contribu-tions of this work are two-fold: First, we present an in-depth analysis on annotation behaviors be-tween service-centric and user-centric annotation. Second, we develop an automatic method for annotating scientific publications with significant improvements over other systems.
The remainder of the paper is organized as fol-lows: We present several definitions in Section 2 and the analysis of annotation behaviors in Sec-tion 3. In SecSec-tion 4, we presented the logistic regression algorithm for annotation. Benchmark-ing results are shown in Section 5. We surveyed related work in Section 6 and summarized our work in Section 7.
2 Definitions
A controlled vocabulary: V, a set of pre-specified entries for describing certain topics. Entries in the vocabulary are organized in a hie-rarchical structure. This vocabulary can be mod-ified under human supervision.
Vocabulary Entry: an entry in a controlled vocabulary is defined as a triplet: VE = (MT, synonyms, NodeLabels). MT is a major term de-scribing the entry, and NodeLabels are a list of node labels in the hierarchical tree. An entry is identified by its MT, and a MT may have mul-tiple node labels as a MT may be mapped to sev-eral nodes of a hierarchical tree.
Entry Binary Relation: ISA(VEi, VEj) means
entry VEj is a child of entry VEi, and SIB(VEi,
VEj) meaning that VEj is a sibling of entry VEi. A
set of relations determine the structure of a hie-rarchy.
Entry Depth: the depth of an entry relative to the root node in the hierarchy. The root node has a depth of 1 and the immediate children of a root node has a depth of 2, and so on. A major term
may be mapped to several locations in the hie-rarchy, thus we have minimal, maximal, and av-erage depths for each MT.
Given the above definitions, a controlled vo-cabulary is defined as {<VEi, ISA(VEi,VEj),
SIB(VEi,VEj)>|any i, j }. The annotation task is
stated as follows: given a document D, predicting a list of entries VEs that are appropriate for anno-tating the document. In our framework, we ap-proach the task as a ranking problem, as detailed in Section 4.
3 Analyzing Service-centric Annotation Behavior
Analyzing annotation behaviors can greatly faci-litate assessing annotation quality, reliability, and consistency. There has been some work on ana-lyzing social tagging behaviors in user-centric annotation systems (Sigurbjörnsson and Zwol, 2008; Suchanek et al., 2008). However, to the best of our knowledge, there is no such analysis on service-centric annotation. In social tagging systems, no specific skills are required for partic-ipating; thus users can tag the resources with ar-bitrary words (the words may even be totally ir-relevant to the content, such as “todo”). By con-trast, in service-centric annotation, the annotators must be trained, and they must comply with a set of strict guidelines to assure the consistent anno-tation quality. Therefore, it is valuable to study the differences between the two annotation processes.
3.1 PubMed Document Collection
To investigate annotation behaviors, we down-loaded 2 million documents from PubMed3, one of the largest search portals for biomedical ar-ticles. These articles were published from Jan. 1, 2000 to Dec. 31, 2008. All these documents have been manually annotated by National Library Medicine (NLM) human curators. The controlled vocabulary used in this system is the Medical Subject Headings (MeSH)4, a thesaurus describ-ing various biomedical topics such as diseases, chemicals and drugs, and organisms. There are 25,588 entries in the vocabulary in 2010, and there are updates annually. By comparison, the vocabulary used in user-centric annotation is
markably larger (usually more than 1 million tags) and more dynamic (may be updated every day).
3.2 Annotation Characteristics
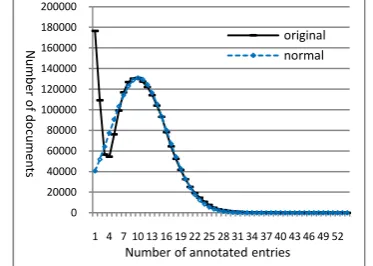
First, we examine the distribution of the number of annotated entries in the document collection. For each number of annotated entries, we counted the number of documents with respect to different numbers of annotations. The number of annotations per document among these 2 million documents varies from 1 (with 176,383 docu-ments) to 97 (with one document only). The av-erage number of annotations per document is 10.10, and the standard deviation is 5.95.
Figure 1. The original distribution and simulated normal distribution. Each data point denotes the number of documents (y-axis) that has the cor-responding number of entries (x-axis).
As illustrated in Figure 1, when there are more than 4 annotations, the distribution fits a normal distribution. Comparing with user-centric annota-tion, there are three notable observations: a), the maximal number of annotations per document (97) is much smaller (in social tagging systems the number amounts to over 104) due to much less annotators involved in service-centric anno-tation than users in user-centric annoanno-tation; b), the number of annotations assigned to documents conforms to a normal distribution, which has not yet been reported in user-centric annotation; c), similar to user-centric annotation, the number of documents that have only one annotation ac-counts for a large proportion.
Second, we investigate whether the Zipf law (Zipf, 1949) holds in service-centric annotation. To this end, we ranked all the entries according to the frequency of being annotated to docu-ments. We plotted the curve in logarithm scale, as illustrated in Figure 2. The curve can be
simu-lated by a linear function in logarithm scale if ignoring the tail which corresponds to very infre-quently used entries. To further justify this find-ing, we ranked all the documents according to the number of assigned annotations and plotted the curve in logarithm scale, as shown in Figure 3. Similar phenomenon is observed. In conclu-sion, the Zipf law also holds in service-centric annotation, just as reported in user-centric anno-tation (Sigurbjörnsson and Zwol, 2008).
Figure 2. The distribution of annotated entry frequency. X-axis is the rank of entries (ranking by the annotation frequency), and y-axis is the frequency of an entry being used in annotation.
Figure 3. The distribution of the number of an-notated entries. X-axis is the rank of a document (in log10 scale), and y-axis is the number of anno-tations assigned to documents (in log2 scale).
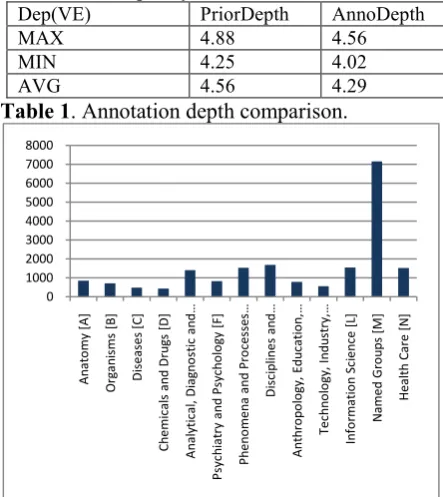
Furthermore, as mentioned in Section 2, the vocabulary corresponds to a hierarchy tree once a set of binary relations were defined. Thus we can easily obtain the minimal, maximal, and av-erage depth of an entry. The larger depth an entry has, the more specific meaning it has.
Therefore, we investigate whether service-centric annotation is performed at very specific level (with larger depth) or general level (with smaller depth). We define prior depth and anno-tation depth for this study, as follows:
( )
1 10 100 1000 10000 100000
1
1 10 100 1000 10000 100000
AnnoDepth Pr( ) * ( ) (2) ber of entries in the vocabulary. The two formu-las are actually the mathematical expectations of the hierarchy’s depth under two distributions re-spectively: a uniform distribution (1/|V|) and the annotation distribution (formula (3)). As shown in Table 1, the two expectations are close. This means the annotation has not been biased to ei-ther general or specific level, which suggests that the annotation quality is sound.
Dep(VE) PriorDepth AnnoDepth
MAX 4.88 4.56
MIN 4.25 4.02
AVG 4.56 4.29
Table 1. Annotation depth comparison.
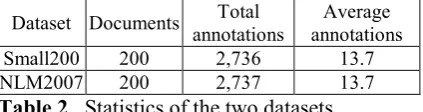
Figure 4. The imbalance frequency (y-axis) of annotated categories (x-axis).
3.3 Annotation Categorization Imbalance
We investigate here whether service-centric an-notation is biased to particular categories in the hierarchy. We define a category as the label of root nodes in the hierarchy. In our vocabulary, there are 11 categories that have at least one an-notation. The complete list of these categories is available at the website5. Three newly created categories have no annotations in the document collection. The total number of annotations with-in a category was divided by the number of
5http://www.nlm.nih.gov/mesh/2010/mesh_browser/MeSHtree.Z.html
tries in that category, as different categories may have quite different numbers of entries. If an en-try is mapped to multiple locations, its annota-tions will be counted to corresponding categories repeatedly.
From Figure 4, we can see that there is imbal-ance with respect to the annotations in different categories. Category “diseases” has 473.5 anno-tations per entry (totally 4408 entries in this cat-egory). Category “chemicals and drugs” has 423.0 annotations per entry (with 8815 entries in total). Due to the fact that diseases and chemicals and drugs are hot scientific topics, these catego-ries are largely under-annotated. The most fre-quently annotated category is: “named groups” (7144.4 annotations per entry), with 199 entries in total. The issue of imbalanced categorization may be due to that the topics of the document collection are of imbalance; and that the vocabu-lary was updated annually, so that the latest en-tries were used less frequently. As shown in (Si-gurbjörnsson and Zwol, 2008), this imbalance issue was also observed in user-centric annota-tion, such as in Flickr Tagging.
4 Learning to Annotate
As shown in Section 3, there are much fewer an-notations per document in service-centric annota-tion than in user-centric annotaannota-tions. Service-centric annotation is of high quality, and is li-mited to a controlled vocabulary. However, ma-nual annotation is time-consuming and labor in-tensive, particularly when seeking high quality. Indeed, our analysis shows that on average it takes over 90 days for a PubMed citation to be manually annotated with MeSH terms. Thus we propose to annotate articles automatically. Spe-cifically, we approach this task as a ranking problem: First, we retrieve k-nearest neighboring (KNN) documents for an input document using a retrieval model (Lin and Wilbur, 2007). Second, we obtain an initial list of annotated entries from those retrieved neighboring documents. Third, we rank those entries using a logistic regression model. Finally, the top N ranked entries are sug-gested as the annotations for the target document.
4.1 Logistic Regression
We propose a probabilistic framework of directly estimating the probability that an entry can be used to annotate a document. Given a document
D and an entry VE, we compute the probability from neighboring documents. Much work used Logistic Regression as classification: Pr(R=1|D) >∆ where ∆ is a threshold, but it is difficult to specify an appropriate value for the threshold in this work, as detailed in Section 5.5.
We applied the logistic regression model to this task. Logistic regression has been successful-ly employed in many applications including mul-tiple ranking list merging (Si and Callan, 2005) and answer validation for question answering (Ko et al., 2007). The model gives the following probability:
been annotated manually, each document will have a corresponding entry list, {VE1,
VE2,…,VEn}, and each VEi has gold-standard
la-bel yi=1 if VEi was used to annotate D, or yi=0
otherwise. Note that the number of entries of la-bel 0 is much larger than that of lala-bel 1 for each document. This may bias the learning algorithm. We will discuss this in Section 5.5. Given such title, abstract, and annotations) from PubMed.
Prior probability feature. We compute the appearance probability of a major term (MT), estimated on the 2 million documents. This prior probability reflects the prior quality of an entry.
Unigram overlap with the title. We count the number of unigrams overlapping between the MT of an entry and the title, dividing by the total number of unigrams in the MT.
Bigram overlap with the document. We first concatenate the title and abstract, then count the number of bigram overlaps between the MT and the concatenated string, dividing by the total number of bigrams in the MT.
Multinomial distribution feature. This fea-ture assumes that the words in a major term
ap-background corpus. This is obtained from a uni-gram language model that was estimated on the 13,999 articles;
λ – A smoothing parameter that was empirically set to be 0.2.
Query-likelihood features. The major term of an entry is viewed as a query, and this class of features computes likelihood scores between the query (as Q) and the article D (either the title or the abstract). We used the very classic okapi model (Robertson et al, 1994), as follows:
where:
tf(q,D) - The count of q occurring in document D; |D| - The total word counts in document D; df(q) - The number of documents containing word q;
avg(|D|) - The average length of documents in the collection;
N- The total number of documents (13,999). We have two features: okapi(MT, Title) and okapi(MT, Abstract). In other words, the title and abstract are processed separately. The advantage of using such query-likelihood scores is that they give a probability other than a binary judgment of whether a major term should be annotated to the article, as only indirect evidence exists for annotating a vocabulary entry to an article in most cases.
Neighborhood features. The first feature represents the number of neighboring documents that include the entry to be annotated for a doc-ument. The second feature, instead of counting documents, sums document similarity scores. The two features are formulated as follows, re-spectively:
{
}
( | ) i| i, i k (9)
freq MT D = D MT∈D D∈Ω
;
( | ) ( , ) (10)
i i k
i MT D D
sim MT D sim D D
∈ ∈Ω
=
∑
where Ωk is the k-nearest neighbors for an input
document D and sim(Di,Dj) is the similarity score
between a target document and its neighboring document, given by the retrieval model.
Synonym Features. Each vocabulary entry has synonyms. We designed two binary features: one judges whether there exists a synonym that can be exactly matched to the article text (title and abstract); and the other measures whether there exists a synonym whose unigram words have all been observed in the article text.
5 Experiment
5.1 Datasets
To justify the effectiveness of our method, we collected two datasets. We randomly selected a set of 200 documents from PubMed to train the logistic regression model (named Small200). For testing, we used a benchmark dataset, NLM2007, which has been previously used in benchmarking biomedical document annotation7 (Aronson et al.,
7http://ii.nlm.nih.gov/.
2004; Vasuki and Cohen, 2009; Trieschnigg et al., 2009). The two datasets have no overlap with the aforementioned 13,999 documents. Each document in these two sets has only title and ab-stract (i.e., no full text). The statistics listed in Table 2 show that the two datasets are alike in terms of annotations. Note that we also evaluate our method on a larger dataset of 1000 docu-ments, but due to the length limit, the results are not presented in this paper.
Dataset Documents Total
annotations
Average annotations
Small200 200 2,736 13.7
NLM2007 200 2,737 13.7
Table 2. Statistics of the two datasets.
5.2 Evaluation Metrics
We use precision, recall, F-score, and mean av-erage precision (MAP) to evaluate the ranking results. As can be seen from Section 3.2, the number of annotations per document is about 10. Thus we evaluated the performance with top 10 and top 15 items.
5.3 Comparison to Other Approaches
We compare our approach to three methods on the benchmark dataset - NLM2007. The first sys-tem is NLM’s MTI syssys-tem (Aronson et al., 2004). This is a knowledge-rich method that employs NLP techniques, biomedical thesauruses, and a KNN module. It also utilizes handcrafted filtering rules for refinement. The second and third me-thods rank entries according to Formula (9) and (10), respectively (Trieschnigg et al., 2009).
We trained our model on Small200. All fea-ture values were normalized to [0,1] using the maximum values of each feature. The number of neighbors was set to be 20. Neighboring docu-ments were retrieved from PubMed using the retrieval model described in (Lin and Wilbur, 2007). Existing document annotations were not used in retrieving similar documents as they should be treated as unavailable for new docu-ments. As the average number of annotations per document is around 13 (see Table 2), we com-puted precision, recall, F-score, and MAP with top 10 and 15 entries, respectively.
neighbor-hood similarity is significant, we conducted the Paired t-test (Goulden, 1956). When comparing results of using learning vs. neighborhood simi-larity in Table 3, the p-value is 0.028 for top 10 and 0.001 for top 15 items. This shows that the improvement achieved by our approach is statis-tically significant (at significance level of 0.05).
Methods Pre. Rec. F. MAP
Top 10
MTI .468 .355 .404 .400 Frequency .635 .464 .536 .598 Similarity .643 .469 .542 .604 Learning .657 .480 .555 .622
Top 15
MTI .404 .442 .422 .400 Frequency .512 .562 .536 .598 Similarity .524 .574 .548 .604 Learning .539 .591 .563 .622
Table 3. Comparative results on NLM2007.
5.4 Choosing Parameter k
We demonstrate here our search for the optimal number of neighboring documents in this task. As shown in Table 4, the more neighbors, the larger number of gold-standard annotations would be present in neighboring documents. With 20 neighbors a fairly high upper-bound re-call (UBR) is observed (about 85% of gold-standard annotations of a target document were present in its 20 neighbors’ annotations), and the average number of entries (Avg_VE) to be ranked is about 100.
Figure 5. The performance (y-axis) varies with the number of neighbors (x-axis).
Measure The number of neighboring documents 5 10 15 20 25 30
UBR .704 .793 .832 .856 .871 .882
Avg_VE 38.8 64.1 83.6 102.2 119.7 136.4
Table 4. The upper-bound recall (UBR) and av-erage number of entries (Avg_VE) with different number of neighboring documents.
To investigate whether the number of neigh-boring documents affects performance, we expe-rimented with different numbers of neighboring documents. We trained a model on Small200, and tested it on NLM2007. The curves in Figure
5 show that the performance becomes very close when choosing no less than 10 neighbors. This infers that reliable performance can be obtained. The best performance (F-score of 0.563) is ob-tained with 20 neighbors. Thus, the parameter k is set to be 20.
5.5 Data Imbalance Issue
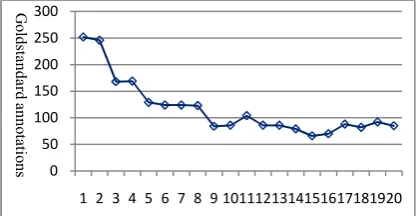
As mentioned in Section 4.1, there is a data im-balance issue in our task. For each document, we obtained an initial list of entries from 20 neigh-boring documents. The average number of gold-standard annotations is about 13, while the aver-age number of entries to be ranked is around 100 (see Table 4). Thus the number of entries of label 0 (negative examples) is much larger than that of label 1 (positive examples). We did not apply any filtering strategy because the gold-standard annotations are not proportional to their occur-ring frequency in the neighbooccur-ring documents. In fact, as shown in Figure 6, the majority of gold-standard annotations appear in only few docu-ments among 20 neighbors. For example, there are about 250 gold-standard annotations appear-ing in only one of 20 neighborappear-ing documents and 964 appearing in less than 6 neighboring docu-ments. Therefore, applying any filtering strategy based on their occurrence in neighboring docu-ments may be harmful to the performance.
Figure 6. The distribution of annotations. X-axis is the number of neighboring documents in which gold-standard annotations are found.
5.6 Feature Analysis
To investigate the impact of different groups of features, we performed a feature ablation study. The features were divided into four groups. For each round of this study, we remove one group of features from the entire feature set, re-train the model on Small200, and then test the perfor-mance on NLM2007 with top 15 entries. We di-vided the features into four independent groups:
0.45 0.5 0.55 0.6 0.65
5 10 15 20 25 30
MAP
Recall
F-score
Precision
0 50 100 150 200 250 300
1 2 3 4 5 6 7 8 9 1011121314151617181920
G
o
ld
st
an
d
ar
d
a
n
n
o
ta
tio
n
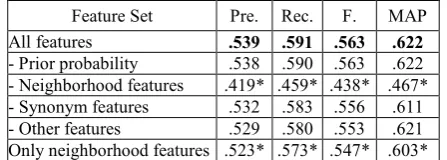
prior probability features, neighborhood features, synonym features, and other features (including unigram/bigram feature, query likelihood feature, etc., see Section 4.2). Results in Table 5 show that neighborhood features are dominant: remov-ing such features leads to a remarkable decrease in performance. On the other hand, using only neighborhood features (the last row) yields sig-nificant worse results than using all features. This means that combining all features together indeed contributes to the optimal performance.
Feature Set Pre. Rec. F. MAP All features .539 .591 .563 .622 - Prior probability .538 .590 .563 .622 - Neighborhood features .419* .459* .438* .467* - Synonym features .532 .583 .556 .611 - Other features .529 .580 .553 .621 Only neighborhood features .523* .573* .547* .603*
Table 5. Feature analysis. Those marked by stars are significantly worse than the best results.
5.7 Discussions
All methods that rely on neighboring documents have performance ceilings. Specifically, for the NLM2007 dataset, the upper bound recall is around 85.6% with 20 neighboring documents, as shown in Table 5. Due to the same reason, this genre of methods is also limited to recommend entries that are recently added to the controlled vocabulary as such entries may have not been annotated to any document yet. This phenome-non has been demonstrated in the annotation be-havior analysis: those latest entries have substan-tially fewer annotations than older ones.
6 Related Work
Our work is closely related to ontology-based or semantic-oriented document annotation (Corcho, 2006; Eriksson, 2007). This work is also related to KNN-based tag suggestion or recommendation systems (Mishne, 2006).
The task here is similar to keyword extraction (Nguyen and Kan, 2007; Jiang et al., 2009), but there is a major difference: keywords are always occurring in the document, while when an entry of a controlled vocabulary was annotated to a document, it may not appear in text at all.
As for the task tackled in this paper, i.e., anno-tating biomedical publications, three genres of approaches have been proposed: (1) k-Nearest Neighbor model: selecting annotations from
neighboring documents, ranking and filtering those annotations (Vasuki and Cohen, 2009; Tri-eschnigg et al., 2009). (2) Classification model: learning the association between the document text and an entry (Ruch, 2006). (3) Based on knowledge resources: using domain thesauruses and NLP techniques to match an entry with con-cepts in the document text (Aronson, 2001; Aronson et al., 2004). (4) LDA-based topic mod-el: (Mörchen et al., 2008).
7 Conclusion
This paper presents a novel study on service-centric annotation. Based on the analysis results of 2 million annotated scientific publications, we conclude that service-centric annotation exhibits the following unique characteristics: a) the num-ber of annotation per document is significant smaller, but it conforms to a normal distribution; and b) entries of different granularity (general vs. specific) are used appropriately by the trained annotators. Service-centric and user-centric an-notations have in common that the Zipf law holds and categorization imbalance exists.
Based on these observations, we introduced a logistic regression approach to annotate publica-tions, with novel features. Significant improve-ments over other systems were obtained on a benchmark dataset. Although our features are tailored for this task in biomedicine, this ap-proach may be generalized for similar tasks in other domains.
Acknowledgements
This work was supported by the Intramural Re-search Program of the NIH, National Library of Medicine. The first author was also supported by the Chinese Natural Science Foundation under grant No. 60803075 and the grant from the Inter-national Development Research Center, Ottawa, Canada IRCI.
References
Alan R. Aronson. Effective mapping of biomedical text to the UMLS Metathesaurus: the metamap program. In Proc AMIA Symp 2001. p. 17-21.
Medical Text Indexer. Stud Health Technol In-form. 2004;107(Pt 1):268-72.
Michael Ashburner, Catherine A. Ball, Judith A. Blake, David Botstein, Heather Butler, et al. Gene Ontology: tool for the unification of biology. Nat Genet. 2000 May; 25(1):25-9.
Shenghua Bao, Xiaoyuan Wu, Ben Fei, Guirong Xue, Zhong Su, and Yong Yu. Optimizing Web Search Using Social Annotations. WWW 2007, May 8–12, 2007, Banff, Alberta, Canada. Pp 501-510.
Tim Berners-Lee, James Hendler and Ora Lassila. The Semantic Web. Scientific American Magazine. (May 17, 2001).
Oscar Corcho. Ontology based document annotation: trends and open research problems. International Journal of Metadata, Semantics and Ontologies, Volume 1, Issue 1, Pages: 47-57, 2006.
Henrik Eriksson. An Annotation Tool for Semantic Documents. In Proceedings of the 4th European conference on The Semantic Web: Research and Applications, pages 759-768, 2007. Innsbruck, Austria.
Cyril Harold Goulden. Methods of Statistical Analy-sis, 2nd ed. New York: Wiley, pp. 50-55, 1956.
Thomas R. Gruber (1993). A Translation Approach to Portable Ontology Specifications. Knowledge Ac-quisition, 5(2), 1993, pp. 199-220.
Andreas Hotho, Robert Jaschke, Christoph Schmitz, Gerd Stumme. Information Retrieval in Folksono-mies: Search and Ranking. In “The Semantic Web: Research and Applications”, Vol. 4011 (2006), pp. 411-426.
Xin Jiang, Yunhua Hu, Hang Li. A Ranking Ap-proach to Keyphrase Extraction. SIGIR’09, July 19–23, 2009, Boston, Massachusetts, USA.
Jeongwoo Ko, Luo Si, Eric Nyberg. A Probabilistic Framework for Answer Selection in Question Answering. Proceedings of NAACL HLT 2007, pages 524–531, Rochester, NY, April 2007.
Rui Li, Shenghua Bao, Ben Fei, Zhong Su, and Yong Yu. Towards Effective Browsing of Large Scale Social Annotations. In WWW ’07: Proceedings of the 16th international conference on World Wide Web, 2007.
Jimmy Lin and W. John Wilbur. PubMed related ar-ticles: a probabilistic topic-based model for content similarity. BMC Bioinformatics 8: (2007).
Thomas P. Minka. A Comparison of Numerical Op-timizers for Logistic Regression. 2003. Unpub-lished draft.
Gilad Mishne. AutoTag: A Collaborative Approach to Automated Tag Assignment for Weblog Posts. WWW 2006, May 22–26, 2006, Edinburgh, Scot-land. pages 953–954.
Fabian Mörchen, Mathäus Dejori, Dmitriy Fradkin, Julien Etienne, Bernd Wachmann, Markus Bund-schus. Anticipating annotations and emerging trends in biomedical literature. In KDD '08: pp. 954-962.
Thuy Dung Nguyen and Min-Yen Kan. Keyphrase Extraction in Scientific Publications. In Proc. of In-ternational Conference on Asian Digital Libraries (ICADL ’07), pages 317-326.
Stephen E. Robertson, Steve Walker, Susan Jones, Micheline Hancock-Beaulieu, and Mike Gatford. Okapi at TREC-3. In Proceedings of the Third Text REtrieval Conference (TREC 1994). Gaithersburg, USA, November 1994.
Patrick Ruch. Automatic assignment of biomedical categories: toward a generic approach. Bioinfor-matics. 2006 Mar 15;22(6):658-64.
Luo Si and Jamie Callan. 2005 CLEF2005: Multilin-gual retrieval by combining multiple multilinMultilin-gual ranked lists. In Proceedings of Cross-Language Evaluation Forum.
Börkur Sigurbjörnsson and Roelof van Zwol. Flickr Tag Recommendation based on Collective Know-ledge. WWW 2008, April 21–25, 2008, Beijing, China. Pp. 327-336.
Fabian M. Suchanek, Milan Vojnovi´c, Dinan Guna-wardena. Social Tags: Meaning and Suggestions. CIKM’08, October 26–30, 2008, Napa Valley, Cal-ifornia, USA.
Dolf Trieschnigg, Piotr Pezik, Vivian Lee, Franciska de Jong, Wessel Kraaij, Dietrich Rebholz-Schuhmann. MeSH Up: effective MeSH text clas-sification for improved document retrieval. Bioin-formatics, Vol. 25 no. 11 2009, pages 1412–1418.
Vidya Vasuki and Trevor Cohen. Reflective Random Indexing for Semiautomatic Indexing of the Bio-medical Literature. AMIA 2009, San Francisco, Nov. 14-18, 2009.
Zhichen Xu, Yun Fu, Jianchang Mao, and Difu Su. Towards the Semantic Web: Collaborative Tag Suggestions. In WWW2006: Proceedings of the Collaborative Web Tagging Workshop (2006).