M e a s u r i n g D i a l e c t D i s t a n c e P h o n e t i c a l l y
J o h n N e r b o n n e a n d W i l b e r t H e e r i n g a A l f a - i n f o r m a t i c a , B C N
P . O . B o x 716, R i j k s u n i v e r s i t e i t G r o n i n g e n N L - 9 7 0 0 AS G r o n i n g e n , T h e N e t h e r l a n d s
nerbonne~let, r u g . nl
A b s t r a c t
We describe ongoing work in the experi- mental evaluation of a range of methods for measuring the phonetic distance be- tween the dialectal variants of pronuncia- tions. Alllare variants of Levenshtein dis- tance, both simple (based on atomic char- acters) and complex (based on feature vec- tors). The measurements using feature vec- tors varied according to whether city-block distance, Euclidean distance or (a measure using) Pearson's correlation coefficient was taken as basic. Variants of these using fea- ture weighting by entropy reduction were systematically compared, as was the rep- resentation of diphthongs (as one symbol or two). The results were compared to well-established scholarship in dialectology, yielding a Calibration of the method. These results indicate that feature representa- tions are more sensitive, that city-block dis- tance is a good measure of phonetic over- lap of feature vectors, that weighting is not useful, a n d that two-phone representations of diphthongs provide a more satisfactory base for this sort of comparison.
K e y w o r d s : dialectology, phonetic (dis)similarity
1 M o t i v a t i o n
Dialectologists frequently speak of the range of di- alects they describe as a "continuum", 1 which sug- gests a need t0 supersede the inherently discrete method of isogl0sses. Dialectologists have long rec- ognized the need for alternative notions of dialectal relationships (Durand (1889),p.49).
1For example,.Tait ol/Inuit: ';a fairly unbroken chain of dialects [...] the furthest extremes of the continuum being unintelligib!e to one another" (Tait (1994), p.3)
It is furthermore the case that a sensitive measure of dialectal distance could have broad application to questions in sociolinguistics and historical linguis- tics, e.g. the significance of political boundaries, the effect of the media, etc.
Levenshtein distance is a measure of string dis- tance that has been applied to problems in speech recognition, bird song ethology, and genetics. It is presented in (Kruskal, 1983), and may be under- stood as the cost of (the least costly set of) oper- ations mapping from one string to another.
Kessler (1995) applied Levenshtein distance to Irish Gaelic dialects with remarkable success, and Nerbonne et al. (1996) extended the applica- tion of his techniques to Dutch dialects, simi- larly with respectable results. Although Kessler and Nerbonne et al. (1996) experimented with more sensitive measures, their best results were based on calculations of phonetic distance in which phonetic overlap was binary: nonidentical phones contribute to phonetic distance, identical ones do not. Thus the pair [a,t] count as different to the same degree
as
2 B a c k g r o u n d
In the interest of space we omit an introduction to Levenshtein distance, referring to (Kruskal, 1983). It may be understood as the cost of (the least costly set of) operations mapping from one string to an- other. The basic costs are those of (single-phone) insertions and deletions, each of which costs half that of substitutions. Nerbonne et al. (1996)explains its use in the present application at some length. The various modifications below all tinker with the cost of substituting one phone for another.
Kessler (1995) experimented with making the measure more sensitive, but found little progress in using features, for example. The present paper ex- periments systematically with several variations on the basic Levenshtein theme.
T h e overall scheme is as follows: a definition of phonetic difference is applied to 101 pairs of words f r o m forty different Dutch dialect areas. All of the pronunciations are taken from the standard dialect atlas ((Blacquart et al, 19251982)--hence: REND,
Reeks Nederlandse Dialectatlassen).
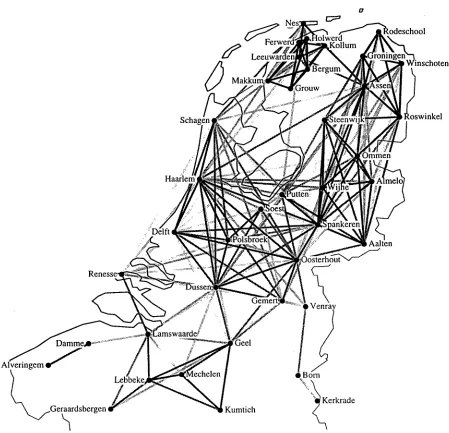
After some nor- malization, this results in an AVER.AGE PHONETIC difference for those d i a l e c t s - - a 40 x 40 m a t r i x of dif- ferences in total (of which one half is redundant due to the s y m m e t r y of distance: dist(a, b) = dist(b, a)). This distance m a t r i x is c o m p a r e d to existing ac- counts of the dialects in question, especially the m o s t recent s y s t e m a t i c account, ( D a a n and Blok, 1969). A visualization tool normally identifies very deviant results, see Fig. 1. Finally the distance m a t r i x is subjected to a heuristic clustering algorithm as a further indication of quality. 23
R e f i n e m e n t s for
D i a l e c t o l o g y
T h e dialects are c o m p a r e d on the basis of the words of 101 items. So the total distance of two dialects is equal to the s u m of 101 Levenshtein-distances. I f we simply use the Levenshtein-distance, it would tend to bias m e a s u r e m e n t s so t h a t changes in longer words would tend to contribute more toward the av- erage phonetic distance (since they tend to involve m o r e changes). T h i s m a y be legitimate, but since words are a crucial linguistic unit we chose to stick to average word distance. This involves the com- p u t a t i o n of 'relative distance', which we get by di- viding the absolute distance by the length of the larger word. We have also considered using the av- erage length of the two words being compared, which makes little difference where b o t h words are present. Missing words pose a p r o b l e m as does lexical re- placement. We wished to handle these consistently (to o b t a i n a consistent measure of distance), even recognizing the danger of conflating phonetic and lexical effects. T h r o u g h o u t this paper we do con- flate the two, reasoning t h a t this is the lesser of two e v i l s - - t h e other of which is deciding when massive phonetic modification a m o u n t s to lexical difference.
N a t u r a l l y no difference is recorded where a word is missing in b o t h dialects. If only one dialect is missing the word, the difference at t h a t point is j u s t
length
× insertion-cost, b u t normalization di- vides this by thelength
again, yielding just the cost of insertion. This is a point at which the decision2The choice of clustering technique is important, but is not the focus of the present paper. The methods here were compared using Ward's method, a variant of hierarchical agglommerative clustering which minimizes squared error. See (Jain and Dubes, 1988) for clustering techniques.
noted a b o v e - t o obtain relative distance v i a Leven- shtein distance divided by longer length-is i m p o r - tant. Recall the alternative mentioned there, t h a t of relativizing to the average length. T h i s would dou- ble the distance measured in cases where words are missing, biasing the overall distance toward dialects with less lexical overlap. This seemed excessive.
Similarly, for some items there are two words possible. If dialect 1 has w o r d l a and w o r d l b , and dialect 2 has word2, we calculate the dis- tance by averaging
dislance(wordla,word2)
anddis-
tance(wordlb,word2).
If b o t h dialect 1 and dialect 2 have multiple variants, we average all pairs of dis- tances.Although we experimented with variable costs for substitutions, depending on whether their base segments or diacritics differ, we could not settle on a n a t u r a l weighting, and further reasoned t h a t a feature-based cost-differential should s y s t e m a t i z e what the transcription-based differential intended. This is resumed below.
Dutch has a rich s y s t e m of diphthongs, which, moreover have been argued to be phonologically di- segmental (Moulton, 1962). We therefore experi- mented b o t h with single-phone and two-phone diph- thongal representations. It turned out the represen- tations with two phones were superior (for the pur- poses of showing dialectal relatedness). 3
3.1 F e a t u r e V e c t o r s
If we compare dialects on the basis of phonetic s y m - bols, it is not possible to take into account the affin- ity between sounds t h a t are not equal, b u t are still related. Methods based on phonetic s y m b o l s do not show t h a t ' p a t e r ' and 'vader' are m o r e kindred then ' p a t e r ' and ' m a l e r ' . This p r o b l e m can be solved by replacing each phonetic s y m b o l by a vector of fea- tures. Each feature can be regarded as a phonetic property which can be used for classifying of sounds. A feature vector contains for each feature a value which indicates to what extent the p r o p e r t y is in- stantiated. Since diacritics influence feature values, they likewise figure in the m a p p i n g f r o m transcrip- tions to feature vectors, and thus a u t o m a t i c a l l y fig- ure in calculations of phonetic distance.
tology use by (Hoppenbrouwers and Hoppenbrouw- ers, 1988), but obtained distinctly poorer results in spite of the larger number of features). Vieregge et al. make use of 14 features [longer discussion of Vieregge's system as well as the translation tran- scriptions in the RND in full version of paper].
We compare three methods for measuring pho- netic distance/ T h e first is MANHATTAN DISTANCE (also called "taxicab distance" or "city block" dis- tance). This is simply the sum of all feature value differences for each of the 14 features in the vector.
Y) = -
Second, w e tried EUCLIDEAN DISTANCE. As usual, this is the square root of the sum of squared differences in feature values. 6 ( X , Y ) =
v/Ei l ( x i -
Third, we examined the Pearson correlation coef- ficient, r. To ixiterpret this as distance we used 1 - r, where r is the usual ~ ~ ('-TU)(~-~ y_.A,~ ).
In the Levenshtein algorithm based on symbols, three operations were used: 'substitution', 'inser- tion' and 'deletion'. A substitution was regarded as a combination of an insertion and a deletion, so substitutions counted two, and "indels" one. When we compare vectors instead Of phonetic symbols, the value for a substitution is no longer a fixed value, but varies between '.two extremes. However, for indels we have to choose'a fixed value as well. This value was estimated by calculating the average of the values of all substitutiofis which take place in the comparison proces, and dividing this average by 2.
3.2 I n f o r m a t i o n - G a i n W e i g h t i n g
Not all features are equally important in classify- ing the sounds lused in the dialects. For example, it turned out that no positive value for the feature [flap
=t:] occurred in any of the words in the dialects exam- ined. We therefore experimented with weighing each feature by information gain, a number expressing the average entropy reduction a feature represents when known (Quinlan, 1993; Daelemans et al., 1996).
To calculate this we need a base figure for database entropy:
H ( D ) = -- E pilog2pi
i
If we have n: different vectors for all the dialects, then 1 < i < n. Pi is the probability of vector i, estimated by its frequency divided by ID[, which is the total number of vectors in all dialects.
Second we calculate the average entropy for each feature:
ID[/
H(D[y])
= E
H(Du='~'])v,~v IDI
[Dll=~d[
is the number of vectors that have valuevi for feature f . V is the set of possible values for feature f. H(Du=vd) is the remaining entropy of all vectors in the database that have value vi for feature f . It is calculated using the first formula, where the i's are now only the vectors that have value vi for feature f .
Finally we can calculate the information gain as- sociated with a feature:
G ( f ) = H ( D ) - H(Dll])
If we then compare two vectors using M a n h a t t a n distance, the weighted difference between two vec- tors X and Y is now:
T~
A ( x , y ) = a ( / , ) l x , -
i = l
And similarly for Euclidean distance and "inverse correlation".
We have recently become aware of the work of Broe (1996), which criticizes the simple application of entropy measures to feature systems in which some features are only partially defined. Such phonological features clearly exist: e.g.,
[lateral]
and [ s t r i d e n t ] apply only to consonants and not to vowels. Broe furthermore develops a generalization of entropy sensitive to these cases. This is an area of current interest.4
Experiments
The dialect varieties were chosen to contain "easy" cases as well as difficult ones. Frisian is accepted as rather more distinct from other areas, and eight Frisian varieties are represented in the wish to see quickly that that distance metrics could distinguish these. The full list of variants may be seen in Fig. 1.
5
Results
We compared a total of 14 methods, shown in Ta- ble 1. While none of these performed very poorly, several tendencies emerge.
Two-phone representations of diphthongs out- perform single-phone representations
Unweighted representations o u t p e r f o r m repre- sentations to which weightings were added. This is surprising.
Manhattan distance narrowly outperforms "correlation" which narrowly outperforms Eu- clidean distance.
0
. Oe rdsberg
/
Kumtich
. . .
erkrade
Figure 1: T h e distances calculated between the 40 pairs of Dutch dialects. Darker lines correspond to phonetically proximate language variants, lighter lines to more distant variants. Phonetically very distant relations result in lines too faint to be seen (in the interest of overall contrast). T h e Frisian dialects (in the Northwest) are clearly recognized as relatively close, as are the Saxon dialects (Northeast). T h e situation in the South is less simple.
[image:4.596.90.539.143.576.2]phone/feature-based weighted feature-comparison diphthong
1 phones one phone
2 phones two phones
3 features no Manhattan two phones
4 features no Manhattan one phone
5 features no Euclidean two phones
6 features no Euclidean one phone
7 features no correlation two phones
8 features no correlation one phone
9 features yes M a n h a t t a n two phones
10 features yes Manhattan one phone
11 features yes Euclidean two phones
12 features yes Euclidean one phone
13 features yes correlation two phones
14 features yes correlation one phone
Table 1: Fourteen variants of Levenshtein distance which were compared in the task of distinguishing Dutch dialect distances. Top performer (3) used features in place of discrete segments, no information-gain weight- ing, M a n h a t t a n (city-block) distance, and a two-segment representation of diphthongs.
Thus, m e t h o d (:3) was best.
T h e superiority is seen in the degree to which the distance matrices and resulting dendrograms match those of expert dialectologists, in particular, (Daan and Blok, 1969). 4
We did not apply a measure to the degree of co- incidence between the experts' division into dialect groups and the grouping induced by the Levenshtein distance metric, Instead, we compared the dendro- gram to the dialect map and checked for congruence. Some of the results accord better with expert opin- ion.
For example, dialectologists generally locate Delft as closer to Haarlem and Schagen (than to Oost- erhout, Dussen a n d Gemert). T h e better distance measures do this as well, but not several of the weighted measures. T h e weighted measures and the unweighted correlation-based measures similarly failed to recogniz:e the coastal (western) Flemish sub- group (Weslflaams or Zeeuwsvlaams), represented in our d a t a set by Alveringem, Damme, Lamswaarde, and Renesse.
Daan's work is accompanied by a map that also appears in the Atlas of the Netherlands, as Plate
4It should be noted that Daan and Blok (1969) incor- porate native speakers' subjective judgements of dialect distance in their assessment (their "arrow method"). But their final partition of dialects into differenct groups is well-accepted.
X-2. 5 It divides the Dutch area into 28 areas of roughly comparable dialect regions. Furthermore, it uses colortones to denote relative distance from standard Dutch. This information can be used to further calibrate the methods here. First, the rela- tive distance from standard Dutch (given in color- tones) can be translated to predictions a b o u t relative phonetic distance. For example, Twents is shaded dark green (and is represented in our d a t a set by the the dialect spoken in Almelo), while Veluws is shaded light green (and is represented by Soest and Putten). There is an intermediate dialect, Gelders- Overijssels shaded an intermediate green and rep- resented by Ommen, Wijhe and Spankeren. These relative distances (to ABN, represented in our data set by Haarlem and Delft) should be reflected in Lev- enshtein distance, and we can test the prediction by how accurate the relfection is. This m e t h o d of test- ing has the large advantage that it tests only Leven- shtein distance without involving the added level of clustering.
A second method of using the dialect m a p to cal- ibrate the Levenshtein metric is to use the 28 var- ious dialect regions as predictions of "minimal dis- tance". Here we can compare the map most simply to the dendrogram. In the present work, it may be noted that the Frisian dialects and the dialect of Groningen-North Drenth are indeed identified as
5Printed by the Topografische Dienst, Delft, 1968.
[image:5.596.132.462.92.301.2]groups (by the Levenshtein method combined mini- mal error clustering). It is more difficult to use the dialect map in this way without using the dendro- gram as well. In particular, it is not clear how the borders on the dialect map are to be interpreted. Keeping in mind the "continuum" metaphor noted in Sec. 1, the borders cannot be interpreted to be marking partitions of minimal distance. T h a t is, it will not be the case that each pair of elements in a given cluster are closer to each other than to any elements outside.
An interesting fact is that while no very close correlation is expected between dialectal distance and geographical distance, still the better techniques generally correlated higher with geographic distance than did the poorer techniques (at approx, r = 0.72).
We conclude that the present methods perform well, and we discuss opportunities for more defini- tive testing and further development in the following section.
6
F u t u r e D i r e c t i o n s
We should like to extend this work in several direc- tions.
• We should like to find a way to measure the success of a given distance metric. This should reflect the degree to which it coincides with ex- pert opinion (which is necessarily rougher). See Sec. 5.
• An examination of grouping methods is desir- able.
• T h e present m e t h o d averages 101 word dis- tances to arrive at a notion of dialect difference. It would he interesting to experiment directly with the 101-dimensional vector, standardized to reflect the distance to standard Dutch (alge- meen beschaafd Nederlands, ABN) and using, e.g., the cos(~,y~ as a distance measure (on vectors whose individual cells represent Leven- shtein distances from ABN pronunciations).
• For more definitive results, the method should be tested on material for which it has NOT been calibrated, ideally a large database of dialectal material.
• Finally, it would be interesting to apply the technique to problems involving the influence of external factors on language variation, such as migration, change in political boundaries, or cultural innovation.
7 Acknowledgernents
We thank Peter Kleiweg for his graphic programs (seen in all of the figures here), and thanks also to an anonymous reviewer for comments.
R e f e r e n c e s
Blacquart et al, E. dialectatlassen.
1925/1982. Reeks nederlandse
Broe, Michael. 1996. A generalized information- theoretic measure for systems of phonological classification and recognition. In Computational Phonology in Speech Technology: Proceedings of the Second Meeting of the ACL Special Interest Group in Computational Phonology, pages 17-24, Santa Cruz. Association for C o m p u t a t i o n a l Lin- guistics.
Daan, Jo and D. P. Blok. 1969. Van Randstad tot Landrand; toelichting bij de kaart: Dialecten
en Naamkunde. Amsterdam: Noord-Hollandsche
Uitgevers.
Daelemans, Walter, Jakub Zavrel, Peter Berck, and Steven Gillis. 1996. Memory-based part of speech tagging. In Gert Durieux, Walter Daelemans, and Steven Gillis, editors, Proc. of CLIN '95. Antwer- pen, pages 185-202.
Durand, Jean-Paul. 1889. Notes de philologie rouer- gate, 18. Revues des Langues Romanes, 33:47-84. cited by Kessler.
Hoppenbrouwers, Cot and Geer Hoppenbrouwers. 1988. De featurefrequentiemethode en de classifi- catie van nederlandse dialecten. TABU: Bulletin voor Taalwetenschap, 18(2):51-92.
Jain, K. and R. C. Dubes. 1988. Algorithms for clustering Data. Englewood Cliffs, New Jersey: Prentice Hall.
Kessler, Brett. 1995. C o m p u t a t i o n a l dialectology in Irish Gaelic. In Proc. of the European ACL, pages 60-67, Dublin.
Kruskal, Joseph. 1983. An overview of se- quence comparison. In David Sankoff and Joseph Kruskal, editors, Time Warps, String Edits and Macromolecules: The Theory and Practice of Sequence Comparison. Addison-Wesley, Reading, Mass., pages 1-44.
Aalten Spankeren Putten Almelo Ornmen Wijhe Steenwijk Assen Groningen Roswinkel Rodeschool IWinschoten Alveringem Damme Lamswaarde Renesse Geel Kumtich Mechelen Geraardsbergen Lebbeke Born Venray Kerkrade Delft Haarlem Schagen Dussen , Oosterhout Gemert Polsbroek Soest Bergum Grouw Ferwerd Holwerd Makkum Kollum Leeuwarden - -
Nes
0:0 200.0 400.0 ' 600.0 '
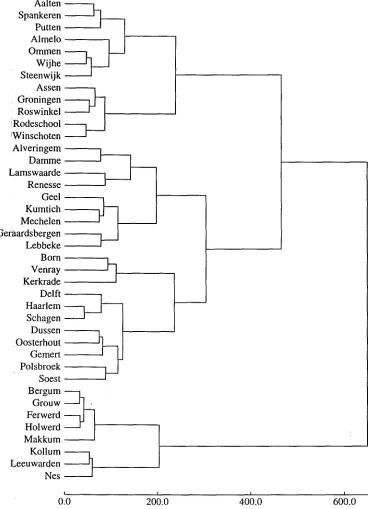
Figure 2: A dendrogram derived fi'om the distance matrix based on (unweighted) M a n h a t t a n distance between feature representations. Note that Frisian and Dutch variants are distinguished most significantly, while within Dutch there major distinctions are Lower Saxon dialects (top), Flemish, and Franeonian (lowest of the three most significant branches within Dutch). This accords well with dialectal scholarship. The dendrogram was obtained using a Ward's method of hierarchical agglommerative clustering, a minimized square-error method. Alternative clustering methods have also been compared in this project, but that topic is beyond the bounds of this paper.
[image:7.596.121.505.104.613.2]f Lee N e s ~
u m ~
Kerkrade
Figure 3: The four most significant dialect groups isolated bu this method correspond to Frisian (northwest, dark), Lower Saxon (northeast,light), Franconian (central, light-intermediate) and Flemish (south, dark- intermediate).
Nerbonne, John, Wilbert Heeringa, Erik van den Hout,
Peter van der Kooi, Simone Otten, and Willem van de Vis. 1996. Phonetic distance between dutch dialects. In Gert Durieux, Walter Daele- mans, and Steven Gillis, editors, Proc. of CLIN '95. Antwerpen, pages 185-202. Also available as http ://grid. let. rug. nl/'nerbonne/papers/ dialects.ps.
Quinlan, J. Ross. 1993. C~.5: Programs for Ma- chine Learning. San Mateo: Morgan Kaufmann.
Tait, Mary. 1994. North America. In Christo- pher Moseley and R.E. Asher, editors, Atlas of the World's Languages. Routledge, London and New York, pages 3-30.
Vieregge, Wilhelm H., A.C.M.Rietveld, and Carel Jansen. 1984. A distinctive feature based system for the evaluation of segmental transcription in dutch. In Proc. of the lOth htternational Congress of Phonetic Sciences, pages 654-659, Dordrecht.
[image:8.596.144.478.73.390.2]