A Comparison Of Emotion Annotation Schemes And A New Annotated Data
Set
Ian D. Wood, John P. McCrae, Vladimir Andryushechkin, Paul Buitelaar
Insight Centre for Data Analytics, National University of Ireland GalwayAbstract
While the recognition of positive/negative sentiment in text is an established task with many standard data sets and well developed methodologies, the recognition of more nuanced affect has received less attention, and in particular, there are very few publicly available gold standard annotated resources. To address this lack, we present a series of emotion annotation studies on tweets culminating in a publicly available collection of 2,019 tweets with scores on four emotion dimensions: valence, arousal, dominance and surprise, following the emotion representation model identified by Fontaine et.al. (Fontaine et al., 2007). Further, we make a comparison of relative vs. absolute annotation schemes. We find improved annotator agreement with a relative annotation scheme (comparisons) on a dimensional emotion model over a categorical annotation scheme on Ekman’s six basic emotions (Ekman et al., 1987), however when we compare inter-annotator agreement for comparisons with agreement for a rating scale annotation scheme (both with the same dimensional emotion model), we find improved inter-annotator agreement with rating scales, challenging a common belief that relative judgements are more reliable.
Keywords:emotion, annotation, annotator-agreement, social-media, affective-computing
1.
Introduction
Beyond simple positive/negative sentiment, there are two main emotion representation schemes that have been used in automated emotion recognition research. The first posits the existence of “basic” emotions or emotion categories to which all other emotions belong, for example the six emo-tions categories identified by Ekman (Ekman et al., 1987): joy, fear, anger,disgust,sadness andsurprise. The sec-ond envisages each emotional state as a point in a dimen-sional space, each dimension corresponding to a character-istic of the emotion, the most widely used model presenting three dimensions (Osgood et al., 1975; Russell and Mehra-bian, 1977):Valence(also termed evaluation-pleasantness), Dominance (also termed potency-control) and Arousal (also termed activation-arousal, a level of physical energy and action tendency). The question of which dimensions most effectively capture variation in emotional states was recently re-opened by Fontaine et.al. (2007), who identi-fied those same three dimensions (though with higher im-portance attributed toDominance) with one extra:Surprise or unpredictability.
Research effort in the recognition of affect in text has fo-cussed to a large extent on recognition of positive/negative sentiment, while more nuanced emotion representation models have received relatively little attention. In particu-lar, there has been a lack of quality annotated resources for model building and evaluation in that space (Mohammad, 2016) and in particular with dimensional annotations. Ex-isting text corpora with dimensional emotion annotations include Affective Norms for English Texts (Bradley and Lang, 2007), a collection of 120 generic texts with VAD an-notations; a collection of 2,895 Facebook posts annotated by just two annotators with valence and arousal dimen-sions (Preotiuc-Pietro et al., 2016). Yu et.al. (2016) pre-sented a collection of 2009 Chinese sentences from various online texts, again annotated with valence and arousal only. Subsequent to our annotation efforts, several further
anno-tated data sets have been published: EMOBANK (Buechel and Hahn, 2017), a collection of ten thousand texts from di-verse sources, but not including tweets, and data for the up-coming “Affect in Tweets” task for SemEval 20181which presents tweets annotated for valence, arousal and domi-nance in English, Spanish and Arabic. In addition, two re-cent data sets annotated with emotion intensity in Ekman emotion categories have also been released: data for the WASSA emotion intensity detection competition (Moham-mad and Bravo-Marquez, 2017), 1,500 to 2,000 tweets for each of the four Ekman emotions joy, anger, sadness and fear; and further data from SemEval 2018.
Several approaches to annotating emotion expressed in text on a continuous scale have been used. Probably the most common utilises an ordinal scale, such as the SAM manikins (Bradley and Lang, 1994). It has been argued that human estimations of relative values are more consis-tent than when assigning an absolute value (Metallinou and Narayanan, 2013; Yannakakis et al., 2017). To address this, Martinez et.al. (2014) suggest that ranked annotations not be treated as absolute values, and instead treated as ordinal, and used, for example, to train ranking estimators. Another approach is to perform relative annotations directly, such as best/worst scaling, where the highest and lowest ranked tweets are chosen from a set of four (Kiritchenko and Mo-hammad, 2017). Pairwise tweet comparisons are another option, however we are not aware of this approach being used previously in the emotion annotation literature as it requires a large number of annotations to acquire a reason-able ranking.
In this work, we present a collection of 2,019 tweets anno-tated following the four dimensional emotion representa-tion scheme of Fontaine et.al. (2007). We further assess the relative merits of annotations on a ranking scale vs. com-parisons, providing annotations using both a 5 point
rank-1
ing scale and pairwise comparisons2.
An initial pilot study with in-house volunteers was performed to compare pairwise tweet comparisons to best/worst scaling. We found that best/worst scaling re-quired significantly more effort and indeed our annotators preferred the pairwise comparison option, so for the final annotation round, best/worst scaling was dropped.
In order to compare annotator agreement between disparate annotation schemes, novel annotation metrics were devel-oped built on common principals of annotation discrepancy (see Section 4.1.). The pilot study and reanalysis of cat-egorical annotation data from previous work (Wood and Ruder, 2016) indicated improved annotator agreement with a relative annotation scheme (tweet comparisons) on a di-mensional emotion representation system compared to cat-egorical annotations of Ekman’s six basic emotions. Anno-tator agreement for final round pairwise comparisons was similar to that for the 5 point rating scale, and when con-sidered as ordinal annotations and converted into pairwise comparisons, agreement was noticeably better. These re-sults challenge the notion that relative human judgements are more reliable than absolute judgements.
As a further comparison of annotation schemes, our anno-tated data alongside two recently published data sets (Kir-itchenko and Mohammad, 2017; Mohammad and Bravo-Marquez, 2017) were analysed for the cognitive complex-ity of the annotation tasks using the time taken by reli-able crowd-sourced annotators as a proxy. We found that best/worst scaling (choosing the highest and lowest from a set of four examples) required between 3 and 3.5 times the effort per annotation item to both relative and absolute an-notation schemes, which exhibited similar effort per item (with relative marginally higher).
The remainder of this paper is organised as follows: Sec-tion 2. describes the collected data and data cleaning strate-gies. Section 3. describes our annotation schemes and pro-cedures. Section 4. presents novel annotation distance met-rics that allow comparison of annotator agreement between the annotation schemes and the agreement scores obtained. Section 5. describes baseline further two evaluation efforts, comparisons of cognitive complexity (using time to anno-tate as a proxy) and predictive models of the published data sets. Section 6. concludes with an overview of the principle results.
2.
Data Collection
For the pilot study, 30 distinct tweet pairs and 18 sets of four distinct tweets were chosen randomly from a collec-tion of tweets drawn from the Twitter Sample API between November 14th 2015 and February 22nd 2016. This ex-tended period of collection was inex-tended to reduce the bias from trending topics with high tweet rates over short pe-riods. Even so, there were many tweets related to the up-coming US election. Tweets containing URLs and those containing hashtags of the form “#Vote. . . ” were removed. Through identification of particular tweets with low anno-tator agreement in the pilot study and common sense, we at-tempted to remove tweets that were not created by humans,
2http://140.203.155.26/mixedemotions/ datasets/4dEmotionInTweets.tar.gz
High proportion of very short words High proportion #tags/@mentions Multiple new-line characters Large number of stop words Apparent quotations Weather channel tweets Presence of obscure acronyms Presence of “#Vote”
Presence of non English characters Presence of “follow” or “followme” . . .
Table 1: Heuristics used to remove tweets.
were difficult to comprehend or were difficult to annotate for some other reason. We developed a set of heuristics to automatically remove many such tweets, and performed a further manual assessment of selected tweets to remove the small number of obvious problematic tweets that remained (see Table 1).
For the primary study, two thousand tweets were sampled randomly from Twitter streaming API output over two pe-riods: 19 days from February 2nd 2016 and 14 days from July 15th 2016. The extended time period is intended to reduce biases caused by trending events which can domi-nate tweet generation over short periods of time. 19 tweet pairs from the pilot study that passed our heuristics (Ta-ble 1) were retained for the primary study.
3.
Annotation
Annotations were obtained via the CrowdFlower platform. For the pilot study, volunteer annotators from our organisa-tion were recruited, and for the scaled-up annotaorganisa-tion, pro-fessional CrowdFlower annotators from English speaking countries were used. Each emotion dimension was treated as a separate task, such that an annotator would annotate their quota of tweets on one dimension, then their quota on another and so forth.
Annotation guidelines used more accessible terms than the traditional names for the first three emotion dimen-sions (Happy/Sad, Excited/Bored, Confident/Unsure re-spectively; the terms Surprise and Intensity were used as is) as well as everyday language to describe them, and stressed that it was the feeling experienced by the tweetauthorthat was sought. Instructions included an explanation of the meaning of the relevant dimension including other emotion words associated with it as well as eight annotated exam-ples with explanations. In all annotation schemes, a “can’t tell” option was provided, and these annotations were not included in further analysis.
Pilot Study: We investigated two annotation schemes for comparing tweets along each of four emotion dimensions: Valence, Arousal, Potency/Dominance, Surprise and Inten-sity. This corresponds to the four dimensions identified by Fontaine et.al. (Fontaine et al., 2007) with the addition of emotion intensity. We found that intensity correlated strongly with activation and did not pursue it further in the primary study.
for “About the same” and “Can’t tell” were also provided. It was stressed that “Can’t tell” was to be used only when one or other of the tweets was unintelligible, in a language other than English, or it was impossible to form a clear picture of their authors emotional states. For this scheme there were 150 comparison tasks (30 tweet pairs in 5 emotion dimen-sions), 10 annotators took part in the study, each annotating between 30 and 150 tweet pairs.
The second annotation scheme used the Best-Worst ap-proach (Louviere and Woodworth, 1991; Louviere et al., 2015), where annotators are presented with four texts and asked to choose the two texts where the authors were feel-ing the most and least positive/dominant/etc. . . Best-Worst annotations provide five out of the six possible compar-isons between pairs of the presented texts, and thus are efficient at gathering information. Initial annotations with the Best-Worst approach indicated that the annotation tasks were cognitively very challenging and the time needed to annotate each tweet set was many times more than anno-tating a tweet pair, effectively counteracting the increased number of tweet comparisons per task. Our in-house anno-tators exhibited a clear preference for annotating pairwise comparisons, and anecdotal evidence suggested that anno-tators on crowd sourcing platforms such as CrowdFlower prefer simpler tasks that can be performed very quickly, thus the Best-Worst approach was not used further in this study in preference to simple tweet comparisons. Subse-quent analysis of other annotation efforts using the Best-Worst approach (Mohammad and Bravo-Marquez, 2017; Kiritchenko and Mohammad, 2017) indicated that Best-Worst annotations are none the less somewhat more effi-cient, giving 5 comparisons in approximately 3 to 3.5 times the time required for each annotation, however annotator agreement when taken as pairwise comparisons was very poor3. We leave further investigation of the relative merits
of these annotation approaches to later study.
Primary Study: The 2,019 tweets for the primary study were annotated with both the relative annotation scheme from the pilot study and an absolute annotation scheme on a 5-point scale. For the binary scheme, 2,019 tweet pairs were chosen such that each tweet was in at least one pair. For annotation on a 5-point scale, the Self-Assessment Manikin (SAM) (Bradley and Lang, 1994) with an an addi-tional “Can’t Tell” option for unintelligible or non-English tweets was used for Valence, Dominance and Arousal. There are no SAM manikins for Surprise, so it was anno-tated without visual aids.
Each individual tweet received 5 annotations for each emo-tion dimension. 44 tweets and 44 tweet pairs for each di-mension were annotated by the authors to serve as test ques-tions. We interspersed these in every 10 annotation tasks and excluded annotators who labelled more than 30% of these tests incorrectly from further experiments, discarding their annotations. As a side effect of this process, the test tweets received many more annotations than other tweets. To avoid bias due to the selection of tasks with low am-biguity for these test questions, they were removed when
3Agreement when considering only best/worst choices as
sin-gle comparisons was very high however.
calculating the annotation agreement metrics in Section 3. Annotator quality was high, with 80% of significant annota-tors passing>90%of the test questions and the remaining accepted annotators passing more than77%.
4.
Annotator Agreement Comparisons
We wished to assess the relative merits of different annota-tion schemes and target emoannota-tion representaannota-tion schemes. In order to assess annotation with categorical emotion schemes, we drew upon data from previous annotation projects (see Section 4.2.) for comparison.
To obtain comparisons of annotator agreement between categorical annotations and dimensional annotations we utilised Krippendorffs’ Alpha, a measure of agreement for which computed reliabilities are comparable across any numbers of coders, values, different metrics, and unequal sample sizes.
To apply Krippendorffs’ Alpha to the various annotation scenarios, we developed conceptually similar metrics of an-notator disagreement for the respective annotation schemes. We attempt to link these metrics through arguments around the nature of annotator judgements and through ensur-ing the metrics operate on a similar scale (i.e.: values for conceptually similar annotation differences should be the same). In this work, we do not attempt to empirically evaluate these disagreement metrics beyond comparison of agreement values on the presented data sets.
4.1.
Annotation Difference Metrics
Categorical Annotations (Multiple Categories Allowed)
There are several metrics that have been applied to cate-gorical annotations with multiple categories allowed. The Jacccard set similarity metric (Jaccard, 1912) is the ratio between the sizes of the intersection and union of the sets. Passonneau (Passonneau, 2004) observed that if one anno-tator is inclined to provide, in general, more labels than another annotator, you should consider any extra labels from the prolific annotator as less indicative of disagree-ment, proposing a simple difference metric that attempts to capture this idea (see below). Passonneau later proposed a combination of the two metrics (Passonneau, 2006), captur-ing the granularity of the Jaccard metric and the motivatcaptur-ing principle of his previous proposal. He named this metric MASI (Measuring Agreement on Set-valued Items). In the formulae below,AandBrefer to two annotations of a data element (tweet in our case), with each a set of annotated categories.
anno-Metric Categorical
Wood 0.33
Masi 0.30
Jaccard 0.31 Passonneau 0.32
Table 2: Krippendorffs’ Alpha for categorical emotion an-notations on emoji tweets with different metrics of annota-tion distance.
tator feels strongly about one or two labels, but adds some others with less conviction, the annotation scheme is unable to represent the situation. If we assume that agreed labels are most likely the labels that the annotators felt strongly about, we would consider any other annotated labels to dicate only mild disagreement, even if both annotators in-dicated an emotion distinct from the other annotator (hence Passonneau would give a high dissimilarity of 0.6). Moti-vated by this observation, we developed a new difference metric: the average proportion of unmatched annotations between the two annotated sets. Again,AandB refer to sets of chosen categories by each of two annotators for a given tweet or other data element.A\Brepresents the set of elements ofAthat are not inB.
Wood(A, B) = 1 2
|A\B|
|A| +
|B\A| |B|
Relative Dimensional Annotations For relative emotion annotations, we can use a naive difference metric (simply if the annotations differ).
Naive(x, y) =
(
0 x=y
1 x6=y
Following a similar intuition to the above metrics, we also develop a second difference metric for relative annotations. The situation here is somewhat simplified—there are 3 an-notation options: the first tweet, about the same and the second tweet. Following the intuition that, when the tweet authors are actually close on the annotated emotion scale, one annotator may be more inclined to choose “About the same” where another may prefer to choose one tweet or the other. In such cases, the annotations can be taken to differ little, and we score such situations with a difference of0.2.
distance(first,second) = 1 distance(x, x) = 0 distance(same, x) = 0.2
Rating Scale Annotations In this case, a naive distance metric simply considers annotations that differ to have dis-tance1(in theNaiverow in Table 3). A more natural dif-ference metric would be the difdif-ference between annotations taken as numerical values, scaled to lie between 0 and1 to match the distance metrics defined above (in theNovel row in Table 3). It has been suggested that ranking scale annotations are better treated as ordinal (Martinez et al., 2014), where annotations from each annotator are treated
Metric Comparisons Rating Scale Rating Scale (as comparisons)
Naive 0.39 0.41 0.39
Novel 0.45 0.47 0.51
Table 3: Overall Krippendorffs’ Alpha for primary study (continuous emotion scale) with different metrics of anno-tation distance.
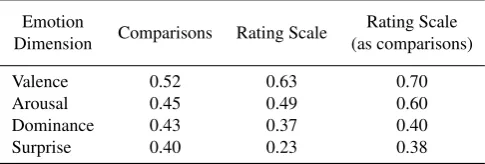
Emotion
Dimension Comparisons Rating Scale
Rating Scale (as comparisons)
Valence 0.52 0.63 0.70
Arousal 0.45 0.49 0.60
Dominance 0.43 0.37 0.40
Surprise 0.40 0.23 0.38
Table 4: Krippendorffs’ Alpha for primary study: compar-ison of emotion dimensions with the novel distance metric.
as a ranking of annotated items. When seen in this way, we can consider each pair of tweets annotated by a given an-notator as a pairwise comparison. If they are ranked at the same level, we treat them as “About the Same”.
4.2.
Annotator Agreement
To compare categorical annotation to dimensional relative annotations, we obtained annotation data from (Wood and Ruder, 2016), where 360 tweets containing at least one of a set of 62 commonly used emoji were annotated for Ek-mans six emotion categories. Though the number of tweets is low, there were 17 annotators who annotated between 60 and 360 tweets each. Table 2 summarises Krippendorffs’ alpha values using the above distance metrics for this data. Table 3 presents Krippendorffs’ alpha values using metrics for dimensional annotations on data from the primary study. Table 4 presents a breakdown of Krippendorffs’ alpha val-ues for individual emotion dimensions (using the “novel” metrics).
Notice that the rating scale and comparison annotation agreement scores (with novel metric) are higher than for the categorical annotations even given the optimistic nature of the new annotation metrics. This confirms the supposition that the annotating on a single emotion scale is a simpler task than choosing multiple emotions categories.
Of particular interest is the improved agreement when rat-ing scale annotations are considered as ordinal and con-verted to pairwise comparisons and also the higher agree-ment when treated this way than direct comparisons, de-spite the substantially larger number of pairs that result4. Agreement for arousal and in particular valence is notably higher than the other dimensions as has been seen in other studies, however it is interesting to note that the discrepancy is less for comparisons and when rating scale annotations are considered ordinal and converted to comparisons.
4An annotator providingnrating scale annotations results in
n(n−1)
Dimension Spearman Correlation (Regression Models)
F1
(Comparison Models)
Valence 0.72 0.72
Arousal 0.64 0.69
Dominance 0.53 0.71
Surprise 0.42 0.63
Average 0.58 0.69
Table 5: Cross validation results for rating scale regression models and comparison classification models.
5.
Predictive Model
As further verification of the utility of the data, we built two supervised models, one each from the 5-point rating scale and pairwise comparison annotations.
For the rating scale data, regressions were built using the approach in (Andryushechkin et al., 2017). This model consists of an ensemble of two supervised models: an SVR (Support Vector Machine Regression) with n-gram and sev-eral custom features (see (Andryushechkin et al., 2017)) and a BiLSTM (Bidirectional Long-Short Term Memory) model utilising 100 dimensional Glove word embeddings trained on tweets (Pennington et al., 2014). For the com-parison data, an SVM (Support Vector Machine) was built using the same Glove word embeddings as features. The cross validation results shown in Table 5 indicate that su-pervised modelling can be effective for predicting emotions using this data.
6.
Conclusions
We presented a new data set of English tweets with an-notations using a dimensional emotion model using four emotion dimensions following the emotion representation model identified by Fontaine et.al. (Fontaine et al., 2007). To the best of our knowledge, this is the first such data set to be made publicly available.
We also compared annotator agreement across different an-notation and emotion representation schemes, finding im-proved agreement on the simpler task of annotating one emotion dimension vs. annotating one of six emotion cat-egories. Contrary to expectations, we found evidence that annotations on a 5-point scale produced greater annotation agreement than comparisons with a dimensional emotion model, especially when considered as ordinal annotations and converted to comparisons (taking, for each annotator, the set of all pairs of tweets from those they annotated).
Acknowledgements
We would like to thank volunteers from the Insight Centre for Data Analytics for their efforts in pilot study annota-tions. This work was supported in part by the Science Foun-dation Ireland under Grant Number 16/IFB/4336 and Grant Number SFI/12/RC/2289 (Insight). The research leading to these results has received funding from the European Union’s Horizon 2020 research and innovation programme under grant agreements No. 644632 (MixedEmotions).
7.
Bibliographical References
Andryushechkin, V., Wood, I., and O’ Neill, J. (2017). NUIG at emoint-2017: Bilstm and SVR ensemble to detect emotion intensity. In Proceedings of the 8th Workshop on Computational Approaches to Subjectivity, Sentiment and Social Media Analysis, pages 175–179, Copenhagen, Denmark. Association for Computational Linguistics.
Bradley, M. M. and Lang, P. J. (1994). Measuring emo-tion: The self-assessment manikin and the semantic dif-ferential.Journal of Behavioral Theory and Experimen-tal Psychiatry, 25(1):49–59.
Bradley, M. M. and Lang, P. J. (2007). Affective norms for English text (ANET): affective ratings of texts and instruction manual. Technical report, University of Florida, Gainesville, Fl., USA.
Buechel, S. and Hahn, U. (2017). EMOBANK: Studying the impact of annotation perspective and representation format on dimensional emotion analysis. EACL 2017, page 578.
Ekman, P., Friesen, W. V., O’Sullivan, M., Chan, A., Diacoyanni-Tarlatzis, I., Heider, K., Krause, R., LeCompte, W. A., Pitcairn, T., Ricci-Bitti, P. E., Scherer, K., Tomita, M., and Tzavaras, A. (1987). Universals and cultural differences in the judgments of facial ex-pressions of emotion. Journal of Personality and Social Psychology, 53(4):712–717.
Fontaine, J. R. J., Scherer, K. R., Roesch, E. B., and Ellsworth, P. C. (2007). The world of emotions is not two-dimensional. Psychological Science, 18(12):1050– 1057.
Jaccard, P. (1912). The distribution of the flora in the alpine zone. New phytologist, 11(2):37–50.
Kiritchenko, S. and Mohammad, S. M. (2017). Best-worst scaling more reliable than rating scales: A case study on sentiment intensity annotation. InProceedings of the 32nd International Conference on Computational Lin-guistics and the 55th Annual Meeting of the Association for Computational Linguistics, Vancouver, Canada. Louviere, J. J. and Woodworth, G. (1991). Best-worst
scal-ing: A model for the largest difference judgments. Uni-versity of Alberta: Working Paper.
Louviere, J. J., Flynn, T. N., and Marley, A. A. (2015). Best-worst scaling: Theory, methods and applications. Cambridge University Press.
Martinez, H. P., Yannakakis, G. N., and Hallam, J. (2014). Don’t classify ratings of affect; rank them! IEEE trans-actions on affective computing, 5(3):314–326.
Metallinou, A. and Narayanan, S. (2013). Annotation and processing of continuous emotional attributes: Chal-lenges and opportunities. In 2013 10th IEEE Interna-tional Conference and Workshops on Automatic Face and Gesture Recognition (FG), pages 1–8.
Mohammad, S. M. (2016). Sentiment analysis: Detecting valence, emotions, and other affectual states from text. In Herbert L. Meiselman, editor,Emotion Measurement, pages 201–237. Woodhead Publishing.
Osgood, C. E., May, W. H., and Miron, M. S. (1975). Cross-cultural Universals of Affective Meaning. Univer-sity of Illinois Press.
Passonneau, R. J. (2004). Computing reliability for coref-erence annotation. InLREC.
Passonneau, R. (2006). Measuring agreement on set-valued items (MASI) for semantic and pragmatic anno-tation.
Pennington, J., Socher, R., and Manning, C. D. (2014). GloVe: Global vectors for word representation. In Empirical Methods in Natural Language Processing (EMNLP), pages 1532–1543.
Preotiuc-Pietro, D., Schwartz, H. A., Park, G., Eichstaedt, J. C., Kern, M., Ungar, L., and Shulman, E. P. (2016). Modelling valence and arousal in facebook posts. In Proceedings of NAACL-HLT, pages 9–15.
Russell, J. A. and Mehrabian, A. (1977). Evidence for a three-factor theory of emotions. Journal of Research in Personality, 11(3):273–294.
Wood, I. and Ruder, S. (2016). Emoji as emotion tags for tweets. InEmotion and Sentiment Analysis Workshop, at LREC2016, Portoroˇz, Slovenia.
Yannakakis, G. N., Cowie, R., and Busso, C. (2017). The ordinal nature of emotions. InInt. Conference on Affec-tive Computing and Intelligent Interaction.