Abstract
SHETTY, RITHIN KUMAR. HeapMon: a Low Overhead, Automatic, and Programmable Memory Bug Detector. (Under the direction of Yan Solihin.)
Enabling memory-related bug detection in production runs is important for detecting andpinpointingbugs that survive debugging. Left undetected, such bugs may be manifested in behavior that is difficult to detect, such as wrong computation outputs, late or obscure system crashes, security attacks, and subtle performance loss. To be useful in production runs, a bug monitoring scheme must not slow down the monitored program much, must be automatic and not require programmer intervention, and must be easy to deploy. Unfortunately, existing tools and techniques either have a very high performance overhead or require a high degree of programmer involvement.
HEAPMON: A LOW OVERHEAD, AUTOMATIC, AND
PROGRAMMABLE MEMORY BUG DETECTOR
by
RITHIN KUMAR SHETTY
A thesis submitted to the Graduate Faculty of
North Carolina State University
in partial fulfillment of the
requirements for the Degree of
Master of Science
COMPUTER SCIENCE
Raleigh
2005
APPROVED BY:
—————————————-Prof. Yan Solihin
Chair of Advisory Committee
Biography
Rithin Shetty was born on May 17, 1979 in Vandse, India. He obtained his Bachelor of Engineering
(BE) degree in Computer Science and Engineering from Sri Jayachamarajendra College of Engineering
(SJCE), Mysore affiliated to the University of Mysore, India in August 2001. After graduation, he
worked with Cisco Systems (India) Pvt Ltd,Bangalore as a Software Engineer from September 2001 to
August 2003. He began his graduate studies in Computer Science at North Carolina State University,
Raleigh from August 2003. He started working with Prof. Yan Solihin at the Center for Embedded
Acknowledgements
First and foremost, I would like to thank my family: my father Shridhar Shetty, my mother Shalini
Shetty and my sister Rashmi for their unconditional love and support throughout my life. I can not
describe in words what their encouragement means to me and how thankful I am to them for all that
they have done.
I would like to thank my advisor Prof. Yan Solihin for his guidance and support during my thesis
research. His guidance and support were vital in completing this research work. I learned a great deal
about research, technical paper writing and his philosophy on how to handle success and failure as a
researcher. I can not thank him enough for helping me realize my potential. I would also like to thank
other members of my thesis committee: Dr Edward Gehringer and Dr Jun Xu for their support.
Thanks are due to Prof. Milos Prvulovic, Asst Professor, Georgia Institute of Technologyfor helping
me during various stages of this project. TheSESCsimulator which I used for my research work was
developed at UIUC and I would like to thank some of its creators James Tuck and Jose Renau for
answering my numerous questions.
Last but certainly not the least, thanks to all the members of my research group at CESR: Mazen
Khar-butli, Seongbeom Kim, Brian Rogers, Radha Venkatagiri, and Fei Guo for their useful comments, Friday
afternoon brain storming sessions and their friendship. I would like to specially thank Mazen for helping
Contents
List Of Figures vi
List Of Tables vii
1 Introduction 1
1.1 Motivation . . . 1
1.2 Contributions . . . 4
1.3 Thesis Organization . . . 6
2 Bug Detection Coverage and Limitations 7 2.1 Bug Detection Coverage . . . 7
2.2 Limitations of HeapMon . . . 10
3 Architectural Support for HeapMon 12 3.1 Bug Reporting Modes . . . 13
3.2 Bug Check Filtering . . . 14
3.3 Bug Check Protocol . . . 15
3.4 Request Queueing . . . 17
3.5 Helper Thread Operation . . . 19
3.6 Other Implementation Issues . . . 21
5 Evaluation 25
5.1 Performance Overhead . . . 25
5.2 Memory Overhead . . . 27
5.3 Bug Detection Capability . . . 27
5.4 HeapMon Characterization . . . 30
5.5 Sensitivity to L2 Cache Parameters . . . 33
6 Related Work 35
7 Conclusions and Future Work 37
List of Figures
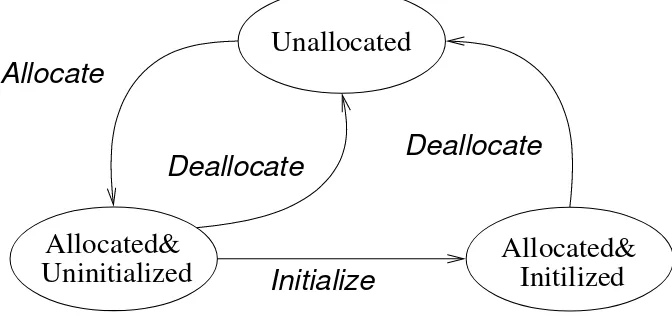
2.1 State transition diagram for each word. . . 8
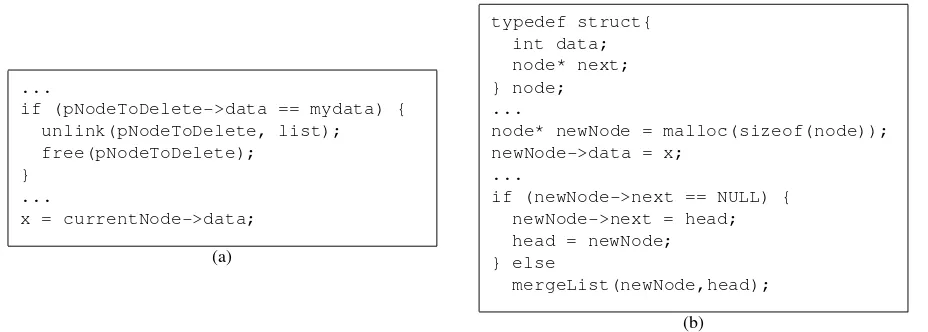
2.2 Bug example where there is an access to an unallocated location (a), and a read to an uninitialized
location (b). . . 10
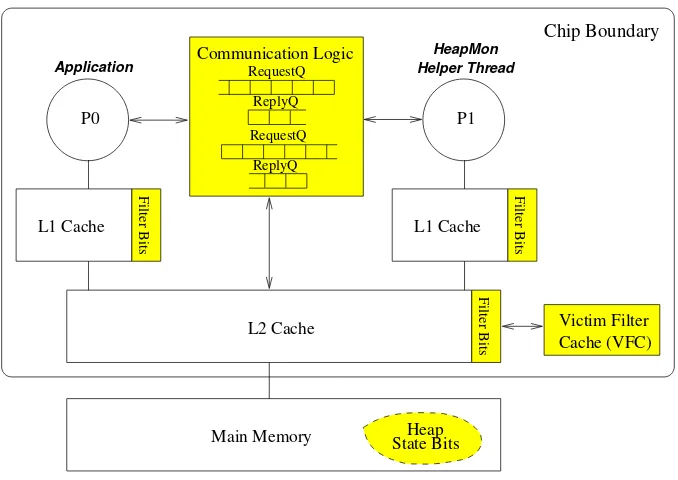
3.1 Hardware support for HeapMon is shown in shaded region enclosed with solid boxes. . . 13
3.2 HeapMon bug check protocol. For brevity, we show only one pair of Request and Reply Queues,
and do not show the memory hierarchy. . . 16
3.3 HeapMon helper thread’s main loop code. . . 20
3.4 HeapMon helper thread’s code for processing a bug check request from a read event. . . 20
5.1 Application’s execution time overhead (i.e. slowdown) imposed by HeapMon for various cases. 26
5.2 Breakdown of the HeapMon helper thread’s execution time by request type . . . 30
5.3 Percentage of accesses that find their filter bit in the L1/L2/VFC. . . 31
5.4 Percentage of time that the Request Queue is full. . . 33
5.5 HeapMon Sensitivity to Cache Size (Cache sizes tested:256KB,512KB, 1MB and 2 MB). . . 34
List of Tables
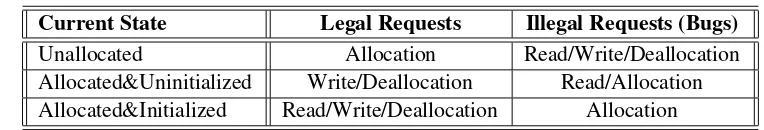
2.1 Legal requests and illegal requests (detectable bugs) for each state. . . 9
4.1 The applications used in our evaluation. . . 23
4.2 Parameters of the simulated architecture. Latencies correspond to contention-free conditions.
RTstands for round-tripfrom the processor. . . 24
5.1 Memory Overhead for State bits in each of the application tested . . . 27
5.2 Bug detection capability of HeapMon, showing how many number of bugs of each type is
in-jected, and the percentage of them that are detected. . . 28
5.3 Total memory leaks in the benchmarks tested. HeapMon can identify both continuous and
non-continuous memory leaks. . . 29
Chapter 1
Introduction
1.1. Motivation
Memory bugs, such as reads from uninitialized memory, reads or writes using dangling pointers,
mem-ory leaks, etc., are some of the most common types of software bugs in C/C++ programs. Software
bugs profoundly impact productivity, reliability, system performance, and security. In terms of loss of
productivity, the National Institute for Standards and Technology (NIST) has recently estimated that
inadequate infrastructure for software testing costs the US economy $22.2 billion annually [37]. It was
also estimated that Purify, a memory bug detection tool, improves debugging productivity by a factor
of ten, and saves $7,000 in development costs per programmer per year [24]. Reliability of computer
systems is also impacted because software bugs often result in system crashes. In terms of performance,
undetected memory leaks can exhaust the available virtual memory over a period of time, inducing
ex-cessive page faults. Finally, it is well known that memory bugs are often exploited for security attacks.
Therefore, improving the capability of the system to detect bugs is important.
fragments, which may even be in different modules or source code files. The compiler is also of little
help because it typically fails to accurately disambiguate pointers [43]. As a result, memory bug
detec-tion in practice relies on run-time checkers [25, 29, 14, 11, 28, 19, 2, 7, 16, 21, 22, 43], which typically
insert monitoring into the application using a compiler or binary instrumentation. However, the
perfor-mance overhead caused by such instrumentation is very high and is only tolerable indebugging runs.
In deployed software, the instrumentation is removed and bugs that occur in production runsare not
detected. As a result, problems that are manifested only with certain input combinations, intermittently,
or only in long runs can easily survive debugging and remain undetected in deployed software.
Enabling memory-related bug detection in production runs is important for detecting andpinpointing
bugs that survive debugging. Left undetected, such bugs may be manifested in behavior that is difficult to
detect, such as wrong computation outputs, late or obscure system crashes, security attacks, and subtle
performance loss. For example, reading from an uninitialized variable may not crash the system but
may produce wrong computation outputs, undetected memory leaks can induce excessive page faults
or much-delayed crashes due to exhausting the available memory over a period of time, and security
vulnerabilities due to memory bugs may not be manifested until an attack is carried out successfully.
The Code Red worm is an example of a recent heap memory attack [38]. Popular programs, such as
the Internet Explorer, Microsoft Internet Information Server, Macromedia Flash, ColdFusion, and many
more, are known to be vulnerable to heap-related attacks [39, 36, 3].
Dealing with a software problem typically involves several steps: detection, identification, and repair.
Detectionoccurs when the existence of a problem is determined (”something is wrong”, e.g. the
pro-gram crashes). Identificationinvolves finding out what is wrong (e.g. the program has a memory leak).
Finally,repairinvolves figuring out how to eliminate the problem and changing the code accordingly.
can be used during the development cycle to identify memory bugs. However, the high overhead
im-posed by such tools prevents their use in production environments. Problems that are manifested only
with certain input combinations, intermittently, or only in long runs can easily survive debugging and
remain in production code, where the existing tools can not be used to find them. Therefore, there is a
need for a system can identify memory bugs with very low-overhead and without human intervention.
Such a system can remain active even in production runs to identify bugs whenever and wherever they
may occur.
We thus identify three requirements that should be satisfied by a monitoring scheme that will be used in
production runs:
Low overhead: production runs should not be slowed down much,
Automatic: monitoring should be fully transparent to the user, and
Easily Deployable: monitoring should not require the source code of the application to be
avail-able and should not require the code to be specially compiled or prepared.
To the best of our knowledge, there is no tool that satisfies all of the above requirements. A variety
of dynamic bug detectors, such as Purify [25], Valgrind [29], Intel thread checker [14], DIDUCE [11],
Eraser [28], CCured [19], Stackguard [7], iWatcher [43], and others [2, 16, 21, 22], work by adding
instrumentation into the source or object code. Most are automatic because the monitoring code can be
inserted without human intervention. Those that rely on binary instrumentation, such as Purify, are also
easily deployable because they do not require recompilation. Unfortunately, in all of these schemes,
checks are too frequent due to a conservative instrumentation approach, and each check usually adds
instructions to the application’s critical path. As a result, various dynamic checkers are reported to cause
To overcome this performance problem, architectural support for bug monitoring has recently been
pro-posed by Zhou et al. This scheme, called Intelligent Watcher (iWatcher) [43, 42], supports efficient
“watchpoints” where a word or a range of memory words can be associated with a read and a write
monitoring flag. On a read or a write to the location, if the corresponding flag is on, an exception is
triggered to transfer the control to bug monitoring code. The system also employs thread-level
specula-tion, allowing the application to continue speculatively while monitoring is performed. Unfortunately,
iWatcher is not easily deployable, since it requires programmers to anticipate which memory regions
are likely related to bugs and correctly insert watchpoints, watch flags, and monitoring functions for
those locations. Bugs in memory regions that are not watched cannot be detected. Furthermore, while
much better than software-only monitoring, the performance overheads are still very high. For example,
iWatcher has overheads of 24-174% when 20% of dynamic loads are monitored [43]. A subsequent
enhanced system, called AccMon, has overheads of 24-288% [42]. One reason for the high overheads
is that the monitoring functions are tightly coupled (interleaved) into the application code. Also, every
memory reference to a monitored address triggers a monitoring check in the original iWatcher [43]. To
reduce the number of checks, AccMon uses statistical filtering to omit a check when the memory access
instruction has been seen in prior “golden” (i.e. bug-free) training runs [42]. The resulting scheme is
more difficult to deploy because it requires golden training runs, and less automatic because it raises
false alarms that must be weeded out by the programmer.
1.2. Contributions
This thesis presents HeapMon
, a heap memory bug detection scheme that has a very low performance
overhead, is automatic, and is easy to deploy. This work has been presented at [30] and will appear
in [31]. HeapMon relies on two new techniques. First, it completely decouplesthe application code
from bug monitoring functions, which are implemented as ahelper threadthat runs on a separate core
in a Chip Multi-Processor (CMP) system. The helper thread monitors the status of each word on the
heap by associating state bits with it.These bits indicate whether the word is unallocated, allocated but
uninitialized, or allocated and initialized. Each state defines which accesses are legal to perform on
the word and which are illegal (bugs), such as writes to unallocated memory regions and reads from
unallocated or uninitialized regions. When a bug is detected, its type, PC, and data address are logged
to enable developers to precisely pinpoint the bug’s nature and location. The second new technique in
HeapMon is to associate a filter bit with each cached word in order to safely and significantly reduce
bug checking frequency (by 95% on average). In particular, a filter bit is set by the helper thread for
a word that is both allocated and initialized. Since most words will be used many times after being
allocated and initialized, hardware can use these filter bits to significantly reduce the number of bug
check requests, without causing false alarms or the need for training runs.
As a result of these considerations, HeapMon has several major advantages over iWatcher and other
schemes:
1. Low-overhead. By using a helper thread to completely decouple bug monitoring functions from
the application, and by using a bug check filtering mechanism that safely and effectively reduces
the bug check frequency,HeapMonachieves a very low performance overhead. On C/C++ SPEC
2000 benchmarks,HeapMonslows down the application by only 3.5% on average, which is one
to two orders of magnitude smaller than the overhead of iWatcher and software-only techniques.
2. Automatic. HeapMon automatically monitors the entire heap segment of the application code.
There is no need to specify the memory regions to be monitored or insert breakpoints or
3. Deployable. HeapMon monitors existing program object files. It is deployed by re-linking
the application with a new static memory allocation library, or simply running it with a new
dynamically-linked memory allocation library.
HeapMon and iWatcheralso differ in bug detection capability. Both iWatcher andHeapMon can
de-tect most heap memory related bugs, such as reads from uninitialized or unallocated memory locations.
However,HeapMoncan also detect bugs related to memory allocations that cannot be detected to
cer-tainty by iWatcher, such as memory leaks and multiple de-allocations of the same heap region, while
iWatcher’s statistics-based approach can point out some anomalies that HeapMon can miss.
Architectural support for HeapMon includes small communication queues between the application and
the HeapMon helper thread, and modest storage overhead: 3.1% of the cache size and a 32KB victim
cache for the on-chip filter bits, and 6.2% of the allocated heap memory size for state bits, which
are maintained by the helper thread as a software data structure. Although HeapMon uses an extra
CMP processor to run the helper thread, the thread only runs less than 23% of the time for almost all
benchmarks, making it possible to run other tasks on the same processor.
1.3. Thesis Organization
The thesis is organized as follows: Chapter 2 discusses the functionality provided by HeapMon and
elaborates on the capabilities and limitations of HeapMon. Chapter 3 presents the architectural support
required for HeapMon, it also discusses the operations of various components of the system and how
they interact. Details of the simulator and Benchmarks are presented in Chapter 4. Chapter 5 presents
and discusses the evaluation results. Chapter 6 describes the related work, and Chapter 7 summarizes
Chapter 2
Bug Detection Coverage and Limitations
This chapter presents the types of bugs that can be detected by HeapMon (Section 2.1) and the
limita-tions of our current implementation of HeapMon (Section 2.2).
2.1. Bug Detection Coverage
To detect bugs, HeapMon’s helper thread allocates and maintains two bits of state for each word in
the heap area. The possible states and transitions between them are shown in Figure 2.1. Initially,
all words on the heap that are currently not allocated have an Unallocated state. When an object is
allocated (viamallocor an equivalent function), the state of all words of the object changes to
Allo-cated&Uninitialized. When a word in the object is written/initialized, the state of the word changes to
Allocated&Initialized. Finally, when an object is deallocated (via freeor equivalent functions), the
state of each of its words is changed back toUnallocated. The states and the state transition diagram are
adopted from Purify [25]. Consequently, HeapMon inherits some of Purify’s bug detection capability
decou-pling of the application code and the bug monitoring, and the use of architecture support to efficiently
reduce bug monitoring frequency, which results in orders of magnitude lower execution time overhead.
Allocate
Deallocate
Initialize
Deallocate
Initilized
Allocated&
Unallocated
Allocated&
Uninitialized
Figure 2.1: State transition diagram for each word.
HeapMon detects bugs by checking whether the current access is permitted by the state. Figure 2.1
shows, for each state, which requests are legal and which are illegal and should be detected as bugs.
By maintaining state bits on a per word basis, HeapMon can detect up to six types of memory bugs:
1. Unallocated Write
2. Unallocated Read
3. Uninitialized Read
4. Double Free
5. Double Allocation
6. Memory Leak
It may seem that bugs of type 1 and 2 above will cause the program to terminate with the dreaded
it does not cause segmentation violation. Double allocation (Type 5 above) by the memory
alloca-tion/deallocation library is not a frequent bug since the memory management library is typically
thor-oughly debugged. However, there are plausible scenarios in which this can happen, for example in an
attack that overwrites the structure that maintains allocated heap object information. This might cause
the memory allocation library to allocate a memory that has already been allocated.
Current State Legal Requests Illegal Requests (Bugs)
Unallocated Allocation Read/Write/Deallocation Allocated&Uninitialized Write/Deallocation Read/Allocation Allocated&Initialized Read/Write/Deallocation Allocation
Table 2.1:Legal requests and illegal requests (detectable bugs) for each state.
Like in Purify, the bug checking conditions shown in Table 2.1 can detect six types of memory-related
bugs. For example, an access to a dangling pointer usually occurs because the pointer is not updated
when the object it points to has been deallocated
. Figure 2.2a shows a code section that illustrates this
bug. In this code, a node pointed bynodeToDeleteis deallocated. Elsewhere in the same application,
currentNodeis dereferenced. The two pointers may never be equal (they point to different locations)
in test runs of the program. However, certain input combinations in a production environment may result
incurrentNodeandpNodeToDeleteto point to the same location, in which case dereferencing
currentNodeafter the node’s memory is deallocated is a bug. This bug is detected by HeapMon
because thefreefunction changes the state of the word toUnallocatedand any subsequent access to
this word is detected as a bug. This example also illustrates the importance of architectural support for
low-overhead bug detection: bugs may be difficult to detect by code inspection because they involve
multiple fragments of source code, and a bug may be manifested only with some input combinations
that may be hard to foresee when testing the code.
Figure 2.2b shows a code section that illustrates another kind of bug detected by HeapMon – access
...
if (pNodeToDelete->data == mydata) { unlink(pNodeToDelete, list); free(pNodeToDelete);
} ...
x = currentNode->data;
(a)
typedef struct{ int data; node* next; } node; ...
node* newNode = malloc(sizeof(node)); newNode->data = x;
...
if (newNode->next == NULL) { newNode->next = head; head = newNode; } else
mergeList(newNode,head);
(b)
Figure 2.2: Bug example where there is an access to an unallocated location (a), and a read to an uninitialized location (b).
to an uninitialized memory location. When the node newNode is allocated, its nextfield is left
uninitialized. Later in the code, the programmer incorrectly uses this field, assuming it should either
point to a valid node or have a NULL value. HeapMon detects this bug whennewNode->nextis read
because its state is stillAllocated&Uninitialized.
Other classes of bugs detected by HeapMon includedouble deallocationsand memory leaks. A double
deallocation is detected because the second deallocation of a memory location finds its state already
Unallocated, and a memory leak is detected when, at the end of program execution, some words in the
heap region are still in one of theAllocatedstates .
2.2. Limitations of HeapMon
The goal of HeapMon is to monitor the heap memory, where most pointer-related bugs occur.
Conse-quently, HeapMon cannot detect bugs in the global data and stack segments. This is not a fundamental
limitation because if desired, the helper thread can be extended to also track other segments. We leave
this for future work, but we carefully design our architectural support to remain general enough and
allow such extensions.
We track states at the granularity of 32-bit words, so bugs on accesses to byte-sized locations may not
always be detected. For example, a read to an uninitialized 1-byte charmay not be detected if the
neighboring byte has been initialized. However, the vast majority of accesses in our applications are
word-sized or larger. Additionally, pointers are always word-sized or larger, so HeapMondetects all
Chapter 3
Architectural Support for HeapMon
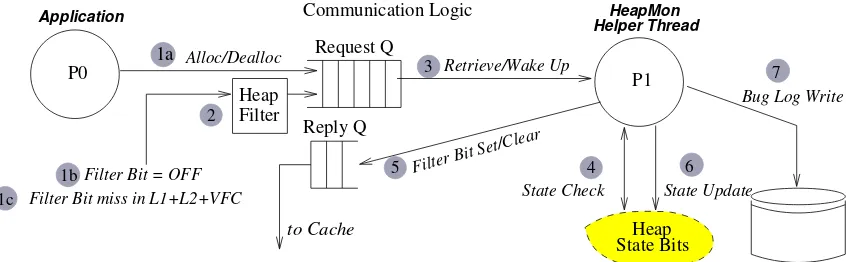
The hardware support required for HeapMon in a CMP system is shown in Figure 3.1. An application
runs on one of the processors, and is monitored by a HeapMon helper thread running on another
pro-cessor. As part of its software data structure, the HeapMon thread maintains twoHeap State Bits per
32-bit word in the application’s current heap region. The memory space overhead for these state bits is,
therefore, 6.25% of the total allocated heap memory. Since bug monitoring is implemented in a helper
thread, this overhead can be removed for applications that do not need heap bug monitoring, such as
legacy FORTRAN applications that do not use dynamic memory allocation.
Communication logic is added between the two CMP processor cores to facilitate fast communication
between them. The logic includes a 64-entry first-in first-out (FIFO)Request Queuefor sending requests
to the HeapMon thread, and an 8-entry FIFO Reply Queue for sending replies back (the choice of
queue sizes are explained in Section 3.4). Two pairs of queues are included to provide symmetry –
any processor can play the role of the application processor or a HeapMon processor. For filtering out
unnecessary requests, each 32-bit word in the L1 and L2 caches is augmented with onefilter bitwhich,
P1
RequestQ
ReplyQ
RequestQ
ReplyQ
P0
Main Memory
Filter Bits
L1 Cache
Filter Bits
L1 Cache
L2 Cache
Filter Bits
Heap State Bits Communication Logic
Helper ThreadHeapMon
Application
Chip Boundary
Victim Filter Cache (VFC)
Figure 3.1:Hardware support for HeapMon is shown in shaded region enclosed with solid boxes.
access to it will generate a bug check request. The storage overhead for the filter bits is modest: 3.1%
of the cache size. As a performance optimization to further minimize the frequency of bug checks, we
include a 32-KBVictim Filter Cache(VFC), which stores filter bits of blocks that are evicted from the
L2 cache.
3.1. Bug Reporting Modes
HeapMon supports two bug reporting modes: thelogging and theprecise mode. In the logging mode,
when a bug is detected, it is logged without involving the application processor. The application
pro-cessor may be notified of the bug, but not necessarily at the time while the instruction that causes the
bug is still in the application processor’s pipeline. In the precise mode, bug detection on a particular
instruction raises an exception for that instruction. In this mode, the application processor cannot retire
an instruction until the corresponding bug check is completedand reported.
However, in production runs, the extra delay in retirement of read and write instructions can
signifi-cantly slow down the execution of application code, especially considering that bug check latency in the
HeapMon helper thread can be quite high. Therefore, for production runs HeapMon should be used in
the logging mode, in which an instruction can be retired without waiting for the result of its bug check.
If a bug is detected, an entry is created in the bug detection log which can later be used for debugging.
Because in production runs the programmer is not available for interactive debugging, the logging mode
is as powerful as the precise mode if the log entry contains enough information such as the PC, address,
and the stack dump, which will allow programmers to exactly pinpoint the source and the nature of the
bug. This thesis concentrates on memory bug detection in production runs, so we only use the logging
mode in the rest of this thesis, although some of our optimizations can also be used in the precise mode.
3.2. Bug Check Filtering
Heap memory accesses are frequent and performing a bug check for each such access can be costly,
especially when doing the check in software. To reduce the frequency of bug checks, the L1 and L2
caches are augmented with a filter bit for each 32-bit word of cached data. HeapMon’s helper thread
sets (to one) the filter bit of a word only when it is sure that any subsequent reads and writes to the word
are safe, i.e. no bug will be detected. As shown in Figure 2.1, the only state of a word where both reads
and writes are legal operations is Allocated&Initialized. Therefore, HeapMon sets a filter bit only for
words in that state. The other two states require HeapMon bug checking for reads, writes, or both, and
filter bits are clear (zero) for words in those two states .
Our filter bits are only used to prevent safe read and write accesses from producing bug check requests.
This is because allocations and deallocations always change the state of affected words, hence they
For a bug-free application, the number of bug check requests that will be generated will be
approx-imately equal to the number of L2 cache misses to heap words plus the number of allocations and
deallocations which are typically much smaller. This is because a cache hit to a heap word almost
al-ways finds the filter bit set. The first initialization write to the word usually results in both a cache miss
for the data, and also a bug check request that transitions the state of the word toAllocated&Initialized,
which in turn will set the filter bit. Other misses, such as capacity and conflict misses, will also result
in bug check requests because the filter bit is not found in the cache and is assumed to be clear. Since a
typical heap word is accessed many times after being allocated and initialized, the number of bug checks
is significantly reduced by filtering. However, the effectiveness of the filtering will depend on the
appli-cation’s L2 cache miss rate, and traditional techniques that reduce the number of L2 cache misses, such
as using a victim cache, higher associativities, etc., will also reduce the number of bug check requests.
A victim cache for storing filter bits of the blocks that are evicted from the L2 cache also provides extra
storage for the filter bits and can reduce the number of bug checks.
3.3. Bug Check Protocol
Figure 3.2 shows the bug-checking protocol in HeapMon. When the application’s processor calls an
allocation or deallocation function, the call generates a special instruction that puts a request in the
Request Queue (circle 1ain Figure 3.2). For a read or write instruction, the filter bit for the accessed
word is checked. For L1 and L2 hits, the filter bit is found in the cache itself. For L2 misses, the filter bit
is either found in the VFC or conservatively assumed to be zero. If the filter bit is found to be set (one)
for an access, the access issafe(i.e. it will not cause a bug to be detected) and no bug check request
is generated. If the filter bit is found (or assumed) to be clear (zero), a bug check is generated for that
heap area. Since HeapMon only monitors the heap area, the heap filter drops non-heap requests and
only places heap requests in the Request Queue (circle 2). A request in the Request Queue contains the
application’s process id, PC of the requesting instruction, request type, starting virtual address, and the
request size. Virtual addresses are preferred in a request because the heap region is contiguous (Heap
Filter can be implemented easily) in the virtual address space, a bug can be immediately correlated to the
program’s address space, and the heap state bits do not become obsolete when the application’s address
translation changes. Heap State Bits P1 4 6 P0 Application 2 1a 1b 1c 5 3 7
Request Q Helper Thread
HeapMon
Communication Logic
Reply Q
to Cache
State Check State Update
Alloc/Dealloc
Filter Bit = OFF Filter Bit miss in L1+L2+VFC
Filter Bit Set/Clear
Retrieve/Wake Up
Heap
Filter Bug Log Write
Figure 3.2:HeapMon bug check protocol. For brevity, we show only one pair of Request and Reply Queues, and do not show the memory hierarchy.
The HeapMon helper thread, after processing a previous request, checks the queue and retrieves the next
request (circle 3). Alternatively, the helper thread may have been in a lightweight sleep because there
were no more requests to process, in which case it receives aWake Up signal when a new request is
placed in the queue. In both cases, the HeapMon thread obtains the request and reads theHeap State
Bits(circle 4) to determine whether the request corresponds to a valid heap access or a bug. Based on
the request type and the current heap state for the accessed word, the thread may reply with aFilter Bit
Set/Clearsignal (circle 5) to turn the filter bit on or off. The signal is sent in two cases. The first case is
when the request is from a read or a write that finds the word in theAllocated&Initializedstate, or from
a write that puts the word in that state. In this case, the HeapMon thread sends a filter-bit-set signal to
case is when the request is a deallocation of words inAllocated&Initialized state. In this case, it sends
a filter-bit-clear signal, so that future accesses will generate bug check requests.
If a request results in a state transition, the HeapMon thread performs a state update on the Heap State
bits (circle 6). Since the state bits were recently read by the thread, they most likely still reside in the
cache, and the update is a cache hit. Finally, if a bug is found, it is logged together with all relevant
information such as the bug type, PC of the instruction that causes the bug, the virtual address, etc.,
which can be reported to the programmers or users (circle 7). If desired, bug detection can also raise an
(imprecise) exception in the application, for example to terminate the application and prevent corruption
or disclosure of sensitive data.
Having outlined the general operation of HeapMon’s mechanism, we now discuss this mechanism and
its architectural support in more detail.
3.4. Request Queuing
Two conditions must be satisfied for a request to be placed in the Request Queue. First, the instruction
that corresponds to the request is no longer speculative (will not be squashed), to avoid corrupting
Heap-Mon’s state bits by state updates due to speculative instructions. Second, an instruction’s request may be
placed in the Request Queue only after all preceding instructions accessing the same word have already
placed their requests in the Request Queue, to avoid detection of false bugs due to out-of-order requests.
In our implementation, we satisfy both conditions by conservatively waiting until an instruction isabout
to retirebefore placing its request in the Request Queue. Once an entry in the Request Queue is reserved,
the instruction is allowed to retire. If the Request Queue is full, the instruction’s retirement is delayed
until an entry in the Request Queue becomes available. This retirement delay may eventually stall the
which HeapMon in the logging mode can stall the application’s processor. In practice, we found that for
a sufficiently large Request Queue (64 entries), the application processor rarely stalls. Since most bug
check requests are due to L2 cache misses, the Request Queue only needs to have slightly more entries
than the maximum number of outstanding misses that the L2 cache can support. Hence the processor
will likely stall on an L2 cache miss before it stalls on the Request Queue
. Therefore, there are only
a few real scenarios that cause an application processor’s stall, such as inmcf, where the helper thread
is busy for a long time servicing a large allocation (several MBs) while the application thread keeps
generating and queuing up requests. Eventually the Request Queue is full, the retirement of instructions
in the application’s processor stops, its reorder buffer fills up, and the application processor stalls.
For a read instruction, data and the filter bit will have been read from the cache before the instruction can
retire. Therefore, the decision of whether or not a bug request should be generated can always be made
when the instruction is about to retire. A write, however, may be retired and placed in the processor’s
write buffer before a cache access is performed. Therefore, the filter bit may not be available at the
time of retirement. To handle this case, we can conservatively assume that the filter bit is clear and
create a possibly unnecessary bug check request, or we can delay the write instruction’s retirement
until the filter bit is available. Our design philosophy is to keep the changes to the processor’s core at
the minimum. Therefore, we generate check requests for writes whose filter bits are not yet available.
However, when a filter bit arrives from the cache and turns out to be set, we remove the request from
the Request Queue if it is not already consumed by the HeapMon helper thread. In our experiments, we
found that this approach performs very well – if a redundant bug check request is quickly consumed by
the helper thread, the occupancy of the helper thread is low and extra bug checks are unlikely to affect
performance. Conversely, high occupancy in the helper thread means that a redundant request is likely
to remain in the queue until its filter bit becomes available, at which time the request is removed from
the queue.
For an L2 cache miss (or a prefetching miss), a hybrid request is generated. The request asks the
HeapMon thread to perform the bug check for the accessed word and to fetch the filter bits for the entire
cache line. If during the time the request is queued or serviced, there is another miss to a different word
in the same cache line, the miss is recorded in the Miss Status Handling Register (MSHR). When the
missed line arrives to the cache, if the filter bits for the line are not yet available, the secondary miss
conservatively assumes that the filter bit for the corresponding word is clear and generates a bug check
request. When the filter bits become available, if the bug check request of the secondary miss has not
been consumed by the HeapMon thread, it is removed from the Request Queue.
3.5. Helper Thread Operation
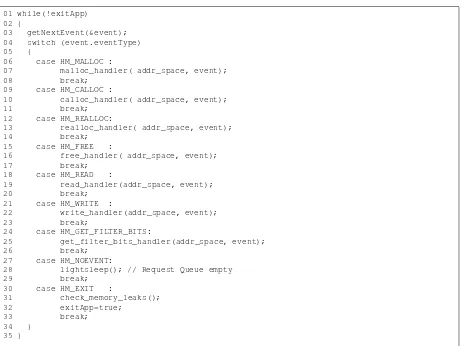
In this section we illustrate how the HeapMon thread operates. Figure 3.3 shows a simplified view of
the helper thread’s main loop. As shown in the figure, the thread operates in a tight loop to retrieve a bug
check request and process it based on its request type. The thread goes to a lightweight sleep if no bug
check request is in the queue. Allocation requests correspond tomalloc(),calloc(), and similar
library calls. HM GET FILTER BITS(line 24) corresponds to hybrid requests which fetch filter bits
for an entire cache line. Memory leaks are checked when an application completes its execution.
Figure 3.4 shows the actual code of the HeapMon thread for processing a read request. The state bits
for the heap are stored consecutively and heapMonState Bits points to this region. The code in lines
08-09 locates the byte that contains the state bits in the HeapMon thread’s data structure, while the code
on line 11 extracts the current state. Lines 12 and 13 show the code for detecting and reporting reads
to unallocated or uninitialized words. Some statements for statistics collection are implemented but not
01 while(!exitApp) 02 {
03 getNextEvent(&event);
04 switch (event.eventType)
05 {
06 case HM_MALLOC :
07 malloc_handler( addr_space, event);
08 break;
09 case HM_CALLOC :
10 calloc_handler( addr_space, event);
11 break;
12 case HM_REALLOC:
13 realloc_handler( addr_space, event);
14 break;
15 case HM_FREE :
16 free_handler( addr_space, event);
17 break;
18 case HM_READ :
19 read_handler(addr_space, event);
20 break;
21 case HM_WRITE :
22 write_handler(addr_space, event);
23 break;
24 case HM_GET_FILTER_BITS:
25 get_filter_bits_handler(addr_space, event);
26 break;
27 case HM_NOEVENT:
28 lightsleep(); // Request Queue empty
29 break;
30 case HM_EXIT :
31 check_memory_leaks();
32 exitApp=true;
33 break;
34 }
35 }
Figure 3.3: HeapMon helper thread’s main loop code.
01 #define NUMBYTES_PER_TAGBYTE 16 // State bits for 16 bytes are stored in 1 byte
02 #define NUM_TAG_BITS 2 // 2 State bits per 4 byte word
03 #define BLOCK_SIZE 4 // Byte granularity at which state bits are maintained
04
05 void read_handler(AddrSpace_t addr_space, Event_t event) 06 {
07 int offsetFromHeapStart = event.dAddr - addr_space.heapStart;
08 int byteOffset = offsetFromHeapStart /_NUMBYTES_PER_TAGBYTE;
09 int bitOffset = ((offsetFromHeapStart % NUMBYTES_PER_TAGBYTE) / BLOCK_SIZE)*NUM_TAG_BITS;
10
11 unsigned char heapState = (heapStateBits[byteOffset] >> bitOffset) & 0x03;
12 if (heapState != INIT_ALLOC)
13 reportBug(event.eventType, heapState, event.dAddr, event.iAddr);
14 }
In implementing the helper thread, we first started with a “clean” high level implementation. However,
we found the response time of the helper thread to be unsatisfactory. We then manually performed
various optimizations on the code, including using immediates (defines) for some values, constant
prop-agation, strength reduction, function inlining, loop unrolling, and others to improve the temporal and
spatial locality. To handle allocation and deallocation requests to a large region (128 bytes or more)
efficiently, the helper thread updates the state bits using 8-byte writes. Overall, the optimizations reduce
the helper thread’s response time by 80-95% compared to the unoptimized version. The code above has
been altered from its original version for simplicity.
3.6. Other Implementation Issues
HeapMon Thread Scheduling. To be effective, the HeapMon helper thread should be gang-scheduled
with the application, so that bug check requests from the application will be served in reasonable amount
of time. When the application is context switched, the helper thread should also be context switched, but
only after the thread finishes servicing all pending requests in the Request Queue. In our evaluation, we
assume that the HeapMon’s processor is not multi-tasked. However, our results in Chapter 5 show that
the HeapMon processor’s utilization is low (less than 23% in almost all cases). Therefore, it is possible
for the HeapMon thread to monitor several applications or threads from the same application. It is
also possible to multi-task HeapMon with lower-priority tasks, as long as a low-latency context switch
mechanism is supported or a larger Request Queue is used so that the HeapMon thread can process
requests before the Request Queue becomes full.
Managing the Heap State Bits. HeapMon stores the Heap State Bits as part of its software data
structure. To avoid allocating unnecessary space for the state bits, HeapMon allocates the state bit
its heap segment size by intercepting the application’s call tobrkandsbrk, and increases its state bit
structure accordingly. The large increment is useful to anticipate the growth in the application’s heap
area and avoid having to reallocate the memory used for the state bits often.
Shared vs Separate Address Spaces. If the HeapMon thread shares the address space with the
ap-plication, it needs a mechanism to detect or prevent its data structures from being corrupted by the
application code, for example by always checking a request’s address against the address range of its
own data structures.
Microcode support. In order to generate a request for an allocation or deallocation event, the allocation
and deallocation functions are augmented with a call to a microcode that inserts a special instruction
into the processor pipeline. The instruction has a small immediate and two register operands, which
specify the type of the request and two parameters which indicate the address and size for allocation
or deallocation request. When the instruction is about to retire, a corresponding bug check request is
Chapter 4
Evaluation Setup
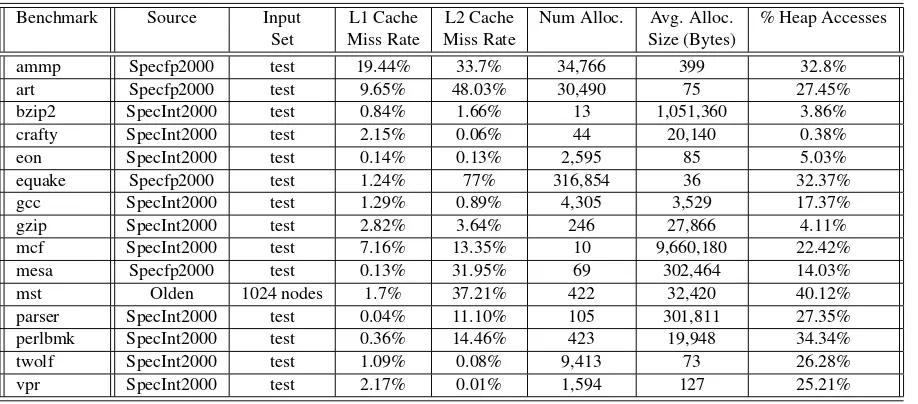
ApplicationsTo evaluate HeapMon, we use 15 applications, mostly from Spec2000 [34]. The
applica-tions, their sources, input sets, L1 and L2 cache miss rates, number of allocaapplica-tions, average allocation
size, and the percentage of memory accesses that go to the heap region are shown in Table 4.1. We
omitted FORTRAN benchmarks since they do not use dynamic memory allocation. Among C/C++
benchmarks,vortexandgapare not included because they cannot run on our simulator. All benchmarks
were simulated from start to completion.
Benchmark Source Input L1 Cache L2 Cache Num Alloc. Avg. Alloc. % Heap Accesses Set Miss Rate Miss Rate Size (Bytes)
ammp Specfp2000 test 19.44% 33.7% 34,766 399 32.8% art Specfp2000 test 9.65% 48.03% 30,490 75 27.45% bzip2 SpecInt2000 test 0.84% 1.66% 13 1,051,360 3.86% crafty SpecInt2000 test 2.15% 0.06% 44 20,140 0.38% eon SpecInt2000 test 0.14% 0.13% 2,595 85 5.03% equake Specfp2000 test 1.24% 77% 316,854 36 32.37% gcc SpecInt2000 test 1.29% 0.89% 4,305 3,529 17.37% gzip SpecInt2000 test 2.82% 3.64% 246 27,866 4.11% mcf SpecInt2000 test 7.16% 13.35% 10 9,660,180 22.42% mesa Specfp2000 test 0.13% 31.95% 69 302,464 14.03% mst Olden 1024 nodes 1.7% 37.21% 422 32,420 40.12% parser SpecInt2000 test 0.04% 11.10% 105 301,811 27.35% perlbmk SpecInt2000 test 0.36% 14.46% 423 19,948 34.34% twolf SpecInt2000 test 1.09% 0.08% 9,413 73 26.28% vpr SpecInt2000 test 2.17% 0.01% 1,594 127 25.21%
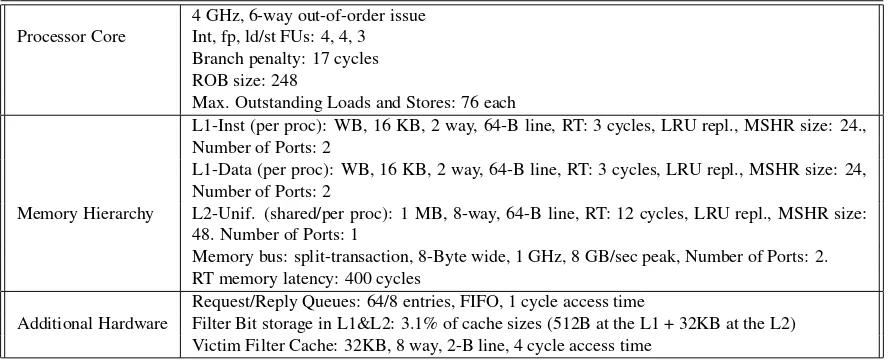
Simulation Environment. The evaluation is performed on an extension of SESC simulator [13]. SESC
is a detailed cycle-accurate execution-driven CMP simulator. Table 4.2 shows the parameters used for
each component of the architecture. Each CMP core is an aggressive out-of-order superscalar processor
with private L1 instruction and data caches. In CMPs, the L2 cache can be configured to be per-processor
private or shared among processors. The memory hierarchy below the L2 cache is always shared by all
CMP cores. We assume that the helper thread can obtain a request from its Request Queue with a
single-cycle latency. We note, however, that this has little effect on the overall request processing latency, which
is in the order of hundreds of cycles.
4 GHz, 6-way out-of-order issue Processor Core Int, fp, ld/st FUs: 4, 4, 3
Branch penalty: 17 cycles ROB size: 248
Max. Outstanding Loads and Stores: 76 each
L1-Inst (per proc): WB, 16 KB, 2 way, 64-B line, RT: 3 cycles, LRU repl., MSHR size: 24., Number of Ports: 2
L1-Data (per proc): WB, 16 KB, 2 way, 64-B line, RT: 3 cycles, LRU repl., MSHR size: 24, Number of Ports: 2
Memory Hierarchy L2-Unif. (shared/per proc): 1 MB, 8-way, 64-B line, RT: 12 cycles, LRU repl., MSHR size: 48. Number of Ports: 1
Memory bus: split-transaction, 8-Byte wide, 1 GHz, 8 GB/sec peak, Number of Ports: 2. RT memory latency: 400 cycles
Request/Reply Queues: 64/8 entries, FIFO, 1 cycle access time
Additional Hardware Filter Bit storage in L1&L2: 3.1% of cache sizes (512B at the L1 + 32KB at the L2) Victim Filter Cache: 32KB, 8 way, 2-B line, 4 cycle access time
Table 4.2: Parameters of the simulated architecture. Latencies correspond to contention-free condi-tions.RTstands for round-tripfrom the processor.
Bug Injection. HeapMon detects memory leaks in almost all of the original Spec2K benchmarks.
Heap-Mon does not detect other types of bugs, which is not surprising considering that Spec2K applications
have been heavily debugged, at least for the supplied input sets. To evaluate HeapMon’s bug detection
capability, we inject three types of bugs. alloc-bugis an injected bug where at random memory
alloca-tion requests, we reduce the allocaalloca-tion size by 32 bytes. dealloc-bugis an injected bug where at random
time, we deallocate the randomly selected heap objects. Finally,noinit-bugis an injected bug where we
Chapter 5
Evaluation
In this chapter we evaluate the execution time overhead (Section 5.1) and memory overhead
(Sec-tion 5.2)of HeapMon. We discuss HeapMon’s bug detec(Sec-tion capability in Sec(Sec-tion 5.3. We then
charac-terize HeapMon’s performance (Section 5.4) and analyze the sensitivity of HeapMon’s performance to
different cache parameters. (Section 5.5).
5.1. Performance Overhead
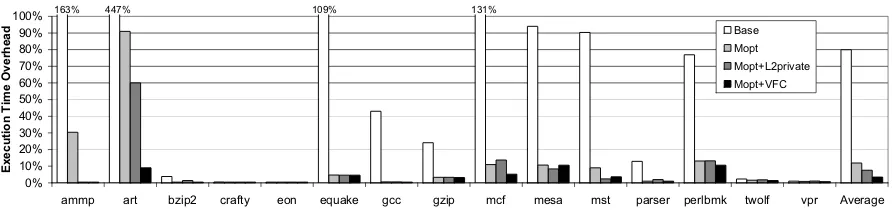
Figure 5.1 shows the execution time overhead of HeapMon for various cases. The figure shows four
bars for each benchmark and for their average. Each bar represents the execution time overhead of
a different HeapMon bug monitoring scheme, compared to the case where the program runs without
any bug monitoring. The four HeapMon schemes are: unoptimized HeapMon thread (Base),
manually-optimized HeapMon thread described in Section 3.5 (Mopt),Mopt with an additional private 1MB L2
cache for the HeapMon processor (Mopt+L2private), andMopt with a single shared L2 cache with a
32KB victim filter cache (Mopt+VFC).
Comparing the averages, it is clear that manually optimizing the HeapMon thread reduces the
execu-tion overhead significantly, from 80% inBaseto only 12% inMopt. Recall that in HeapMon’s logging
Re-0% 10% 20% 30% 40% 50% 60% 70% 80% 90% 100%
ammp art bzip2 crafty eon equake gcc gzip mcf mesa mst parser perlbmk twolf vpr Average
E x e c u ti o n T im e O v e r h e a d Base Mopt Mopt+L2private Mopt+VFC 131% 447% 109% 163%
Figure 5.1:Application’s execution time overhead (i.e. slowdown) imposed by HeapMon for various cases.
quest Queue is full and because of memory hierarchy contention (mainly the L2 cache) between the
application thread and the HeapMon thread. The high execution overhead inBaseis due to the
Heap-Mon thread not being fast enough to perform bug checking for the application. This results in the helper
thread being overwhelmed by the incoming requests and creating a bottleneck for the application code.
Manually optimizing the helper thread code significantly reduces the HeapMon thread’s response time
(by 80-95% for most request types), resulting in much lower overhead (12% on average inMopt).
How-ever, the worst case overhead forMoptis still quite high (91% forart). Using a 1MB private L2 cache
for the HeapMon thread inMopt+L2privateeliminates L2 cache contention between the application and
the HeapMon thread. Eliminating L2 cache contention reduces the overhead in applications that have
a large number of capacity misses due to their working set sizes (ammpand art), bringing the average
overhead down to 8%.
Instead of adding a large and private L2 cache, adding a victim filter cache (VFC) toMoptis the more
effective solution. This reduces the overhead to 3.5% on average, with the worst case of 10.6% in
only two cases (mesa andperblmk). This is a significant improvement, especially considering that the
additional hardware is a small 32KB cache for filter bits, which is accessed only on L2 cache misses
and replacements. The reason why a small VFC is more effective than a private L2 cache for the
HeapMon thread is that one of the costliest bug check requests involves computing the filter bits for an
the L2 cache less frequently. With this final optimization, HeapMon’s overhead is more than an order of
magnitude smaller than iWatcher [43, 42], mostly thanks to decoupling the bug checking function from
the application and to effective filtering of bug check requests.
5.2. Memory Overhead
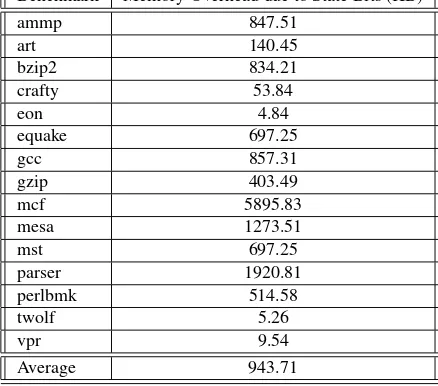
Table 5.1 shows the storage overhead due to state bits. As explained earlier, 2 bits of state information
is maintined for every 32 bit word. The average memory overhead is around 950 KB and the highest
overhead occurs in Mcf and Parser of 5.76 MB and 1.88 MB respectively. These two applications
perform very big memory allocation of size 92 MB (Mcf) and 31 MB (Parser), hence they also have
very high memory overhead. But overall the overhead is less than 1 MB for 12 of the 15 applications
tested.
Benchmark Memory Overhead due to State Bits (KB) ammp 847.51
art 140.45 bzip2 834.21 crafty 53.84 eon 4.84 equake 697.25 gcc 857.31 gzip 403.49 mcf 5895.83 mesa 1273.51 mst 697.25 parser 1920.81 perlbmk 514.58 twolf 5.26 vpr 9.54 Average 943.71
Table 5.1:Memory Overhead for State bits in each of the application tested
5.3. Bug Detection Capability
We now present an evaluation of HeapMon’s bug detection capability. With unmodified SPEC2K
bench-marks, HeapMon only finds memory leak bugs. This is not surprising: SPEC2K benchmarks have
capability of detecting other bugs, we inject bugs into selected SPEC 2000 benchmark applications. We
use Table 4.1 to choose a representative application for each of the following behaviors: few but very
large allocations (mcf), few and small allocations (crafty), many small allocations (art), and a very high
number of allocations (equake). As mentioned in Chapter 4, we introduce three types of bugs into these
benchmarks:alloc-bugreduces randomly selected memory allocation requests by 32 bytes,dealloc-bug
deallocates some randomly selected heap objects, andnoinit-bugremoves randomly selected
initializa-tion writes. We inject multiple bugs on each run. When a bug is detected, we reverse the impact of the
bug so it does not crash the application, allowing the HeapMon to detect other bugs that occur later.
Benchmark alloc-bug dealloc-bug noinit-bug
art 100% (out of 20) 100% (out of 5) 100% (out of 20) crafty 61% (out of 13) 100% (out of 4) 100% (out of 20) equake 100% (out of 20) 100% (out of 4) 100% (out of 20) mcf 100% (out of 3) 100% (out of 3) 100% (out of 20)
Table 5.2:Bug detection capability of HeapMon, showing how many number of bugs of each type is injected, and the percentage of them that are detected.
Table 5.2 shows the percentage of bugs detected by HeapMon for each type of injected bugs. HeapMon
detected all injected bugs except fivealloc-bugs incrafty. This happens for some heap objects that are
used as string character buffers. These buffers have a fixed allocated size, but unless they store long
strings, most of the bytes at the end of the allocated region will not be accessed, at least for the program
input that we use. As a result, the injected bug is not manifested. Again, this illustrates the difficulty
of detecting memory bugs because they may manifest with some input combinations that only occur
in production environments which stress the application to its limits. This observation supports the
argument that a low-overhead bug detection deployable in production environments is needed.
We also ran the benchmarks without bug injection with HeapMon bug checking. HeapMon was able
to identify all memory leaks manifested in each of the 15 benchmarks. Table 5.3 shows, for each
benchmark, how many memory allocations are made, how many of them are not deallocated (both as
allocated at the end of program execution). HeapMon identifies that six benchmarks (ammp,art,bzip2,
crafty,equake, andmst) either never deallocate their heap memory or deallocate fewer than 5% of their
allocations. We also found that the memory leak problems are not only in the applications themselves
-they are also in the libraries. For example, we found thatmcf’s memory leaks are due to library objects.
Benchmark Allocations Not Deallocated Not Deallocated (%) Total Memory Leak (Bytes) ammp 34,766 34,764 99.9% 13,867,154 art 30,490 30,489 99.9% 2,276,734 bzip2 13 13 100.0% 13,667,680 crafty 44 42 95.5% 881,680 eon 2,595 632 24.4% 53,720 equake 316,854 316,854 100.0% 11,406,744 gcc 4,305 1,180 27.4% 3,001,720 gzip 246 7 2.9% 6,605,308 mcf 10 3 30.0% 4,600 mesa 69 9 13.0% 13,836 mst 422 422 100.0% 13,681,240 parser 105 7 6.66% 31,470,635 perlbmk 423 323 76.4% 4,233,204 twolf 9,413 1,408 14.9% 7,821,619 vpr 1,594 50 3.1% 80,462
Table 5.3:Total memory leaks in the benchmarks tested. HeapMon can identify both continuous and non-continuous memory leaks.
This prevalence of memory leaks is due to several factors. First, they are hard to detect because, with
fixed and relatively small inputs used for benchmarking, the system never runs out of memory due
to these leaks. Second, developers tend to be conservative in deallocating heap objects, for fear that
doing so will result in dangling pointers or deallocating an object multiple times, which could crash
the application. Note that memory leaks that grow over time (continuous) are more dangerous than
other types because they can cause long-running programs (e.g. web servers) to exhaust the virtual
memory and crash. Thus, code developers may consciously skip deallocating objects that will not cause
continuous memory leaks. From the perspective of software engineering, however, all memory leaks are
potentially dangerous because codes may be reused in a way that the developers do not envision, hence
can detect all memory leaks.
5.4. HeapMon Characterization
This subsection presents characterization results of the HeapMon helper thread for theMopt+VFCcase.
Figure 5.2 shows HeapMon helper thread’s execution time, broken down into the time it is busy servicing
allocation requests (Alloc), deallocation requests (Dealloc), read requests (Read), write requests (Write),
and whole-cache-line filter bits fetch requests (Filter Bits). Each bar is normalized to the application’s
execution time. Therefore, the height of the entire bar for each application shows the fraction of the
application execution time during which HeapMon helper thread is busy servicing requests. This “busy”
time includes various pipeline stall time in the HeapMon thread’s processor.
0% 10% 20% 30% 40% 50% 60% 70% 80% 90% 100% a m m p a rt b z ip 2 c ra ft y e o n e q u a k e g c c g z ip m c f mesa m s t p a rs e r perlbmk tw o lf v p r A v e ra g e HeapMon Thread Activity Time Filter Bits Write Read Dealloc Alloc
Figure 5.2:Breakdown of the HeapMon helper thread’s execution time by request type
The figure shows that on average, the HeapMon processor is busy servicing requests only 13% of the
time, and for all but two applications, the HeapMon processor is busy for less than 23% of the time. This
shows that, although the HeapMon helper thread runs on a separate CMP processor, it does not fully
occupy the processor. It can interleave its execution with other tasks, if the system aims to maximize its
throughput.
reasons. First, it takes longer for the HeapMon thread to compute the filter bits for an entire cache line
of 16 words as opposed to servicing bug check requests for reads or writes. Secondly, computing the
filter bits for the entire cache line helps eliminate later read and write bug check requests if they access
the same cache line. Inmcf, however, most of the time is spent on servicing allocation and deallocation
requests, due to very large allocations and deallocations (averaging 9.7MB).
0% 10% 20% 30% 40% 50% 60% 70% 80% 90% 100% a m m p a rt b z ip 2 c ra ft y e o n e q u a k e g c c g z ip m c f m e s a m s t p a rs e r p e rl b m k tw o lf v p r A v e ra g e L 1 /L 2 /V F C F il te r B it s H it R a
te Hit+ON Hit+OFF
Figure 5.3:Percentage of accesses that find their filter bit in the L1/L2/VFC.
Figure 5.3 shows the percentage of accesses that find filter bits in the L1 cache, L2 cache, or the VFC.
We also show whether the filter bit is set (black section of each bar) or clear (grey section of each
bar). We can make several observations from the figure. First, HeapMon’s filtering mechanism is very
effective in reducing the frequency of bug checks. On average, 95% of all accesses find their filter
bit set in the cache (Hit+ON). Consequently, only 5% of the accesses generate bug check requests,
which is the key to HeapMon’s low performance overheads. Two applications that have lower filter
bit hit rates are ammpand art. They are the only applications that have very high L2 miss rates (34%
and 48% respectively), L1 miss rates (19% and 10% respectively), and heap accesses (33% and 27%
respectively), indicating a large and active working set in the heap. However, even for these applications,
the execution time overhead is minor (0.4% and 9% respectively). Finally, we observe that, on average,
confirms that a heap object is accessed many times after it is allocated and initialized, and that caching
the filter bits almost always results in avoiding bug check requests. We expect that a larger VFC can
reduce HeapMon’s performance overheads even more, but our 32KB VFC already offers very good
cost/performance tradeoff.
Benchmark Allocation Deallocation Read Write Filter Bit Requests ammp 266 3,543 20 30 219 art 98 7,266 22 23 169 bzip2 202,503 N/A N/A 35 199 crafty 4,256 4,074 436 21 239 eon 159 155 70 76 532 equake 92 N/A 23 30 198 gcc 740 1,086 28 28 209 gzip 5,546 593 62 21 188 mcf 1,851,478 7,787,730 21 49 253 mesa 58,253 194,255 35 23 187 mst 6,341 N/A 907 36 221 parser 58,117 1,223 20 22 249 perlbmk 3,951 23,332 64 22 202 twolf 135 106 20 25 166 vpr 117 73 36 33 171
Table 5.4:Average service time (in cycles) of the helper thread for each type of heap request.
Table 5.4 shows the average service time (in cycles) of the helper thread for different types of requests.
N/A indicates that the helper thread never encounters the request. For example,bzip2,equake, andmst
do not have deallocation requests because they do not deallocate their heap objects, whereas bzip2’s
read requests are completely filtered because of its filter bit requests. The table shows that serving a
single read or write request always takes less than 1000 cycles because reads and writes are only up to
a double-word in size. However, allocations and deallocations may involve a large memory region, and
their service time varies greatly. mcfhas 10 large allocations averaging 9.7 MBytes (Table 4.1), and has
the longest average service time (1.85M cycles for an allocation, and 7.8M cycles for a deallocation).
One interesting observation that can be made from the table is that the average service time for a
deal-location can be much larger than the average service time for an aldeal-location (such as inammp,art,mcf,
location requests. This seems to suggest that developers skip deallocating smaller objects because there
are more of them, it is harder to reason whether they will no longer be accessed, and the benefit of
re-claiming their memory is smaller. This, again, illustrates the importance of a tool like HeapMon, which
can pinpoint memory leaks caused by small objects.
0% 2% 4% 6% 8% 10% 12% 14% 16% a m m p a rt b z ip 2 c ra ft y e o n e q u a k e g c c g z ip m c f mesa m s t p a rs e r perlbmk tw o lf v p r A v e ra g e % R e qu e s t Qu e u e Full
Figure 5.4: Percentage of time that the Request Queue is full.
Figure 5.4 shows the time during which the Request Queue is full, as a percentage of the application’s
execution time. The figure shows that the queue is full only 2.1% of the time, on average. This indicates
that the queue size of 64 entries is sufficient for most programs. For three applications (mcf,mesa, and
perlbmk), the percentage of the time the queue is full ranges from 4.5% to 14.3%. Not coincidentally,
they are among the applications that have the highest execution time overheads (5.2%, 10.6%, and
10.6%, respectively) as shown in Figure 5.1.
5.5. Sensitivity to L2 Cache Parameters
To test the sensitivity of HeapMon’s performance to changes in the L2 cache parameters, we perform
two experiments for theMopt+VFCcase.
Sensitivity to Cache Size: We vary the L2 cache size from 256KB, 512KB, 1MB, to 2MB, while
0% 5% 10% 15% 20% 25% 30% 35% 40%
ammp art bzip2 crafty eon equake gcc gzip mcf mesa mst parser perlbmk twolf vpr Average
E xe cu tio n Ti m e O ve rh ea d
256KB 512KB 1MB 2MB
Figure 5.5: HeapMon Sensitivity to Cache Size (Cache sizes tested:256KB,512KB, 1MB and 2 MB). 3.5%, and 3.5%, respectively. As expected, smaller caches result in more cache misses, more bug check
requests, and higher overheads. Note that there are fewer filter bits stored on-chip for smaller caches,
because the VFC size is kept constant. The performance overhead with smaller caches would be reduced
if a larger VFC is used. Overall, the result suggests that, in production environment where applications
have larger working sets, we can expect HeapMon’s performance overhead to remain very small as long
as the application has relatively good caching behavior.
0% 2% 4% 6% 8% 10% 12% 14% 16%
ammp art bzip2 crafty eon equake gcc gzip mcf mesa mst parser perlbmk twolf vpr Average
E xe cu tio n Ti m e O ve rh ea
d 4 8 16
Figure 5.6: HeapMon Sensitivity to Associativity (L2 associativity tested:4,8 and 16).
Sensitivity to Associativity: In the second experiment, we keep the L2 cache size constant at 1MB,
but vary the associativity from 4, 8, to 16 (our base configuration is 1MB 8-way associative cache).
We found that average execution time overheads are virtually unchanged (3.8% for 4-way, 3.5% for
8-way, and 3.7% for 16-way), indicating that HeapMon’s overheads are largely insensitive to L2 cache
Chapter 6
Related Work
Detection of memory bugs can be performed statically by the compiler, dynamically by
instrumenta-tion, or by utilizing hardware support. Examples of the static approach include explicit model
check-ing [18, 35] and program analysis [4, 9, 10]. Such static approaches require program annotations by
the programmer and are limited by imperfect pointer disambiguation and other compile-time
limita-tions [43]. Examples of the instrumentation-based dynamic approach include Purify [25], Valgrind [29],
Intel thread checker [14], DIDUCE [11], Eraser [28], CCured [19], and others [2, 7, 16, 21, 22]. They
typically suffer from large instrumentation overheads, where applications may be slowed down by 6-30
times [11, 28, 43].
Some of the techniques that use hardware to support dynamic memory bug detection include using
thread level speculation to hide bug detection overheads [20, 43]. Bug checking latency is partially
hidden by speculatively continuing program execution while the check is being done. SafeMem uses
ECC (error correction) bits to detect memory accesses to watched locations [23]. DISE adds efficient
hardware support for breakpoints and watchpoints by dynamically inserting monitoring code at the
micro-architecture level [6]. DISE gives support for non-automatic but efficient watchpoints and
break-points, which have to be inserted by the programmers. Our HeapMon mechanism differs from prior
monitoring functions using a helper thread, and safe and effective bug check filtering using filter bits in
the caches.
In past studies, helper threads have mainly been used for prefetching purposes [27, 17, 8, 32, 5, 15].
HeapMon utilizes a helper thread for memory bug detection. HeapMon is also related to hardware tags
that store and manage states in the memory [41, 1, 33, 12, 26]. However, hardware tags are finely
in-terleaved with data in memory, and require modifications to the DRAM interface and DRAM modules,
have limited and fixed functionality, and result in memory space overheads even when not in use. In
contrast, we use a helper thread to maintain per-word states in a software data structure, which is not
al-located if it is not needed. Our work is also related to Mondrian Memory Protection (MMP) [40]. While
MMP’s tags provide architecture support for per-word protection domain, HeapMon’s tags provide bug