ISSN(Online): 2319-8753 ISSN (Print): 2347-6710
I
nternational
J
ournal of
I
nnovative
R
esearch in
S
cience,
E
ngineering and
T
echnology
(A High Impact Factor, Monthly, Peer Reviewed Journal)
Visit: www.ijirset.com
Vol. 8, Issue 6, June 2019
Pushover Analysis of a Multi-Storied Building
in Two Different Zones
Abhilash D. K 1, Dr. M. D. Vijayanand2
P.G. Student, Department of Civil Engineering, BIET, Davanagere, Karnataka, India1
Associate Professor, Department of Civil Engineering, BIET, Davanagere, Karnataka, India2
ABSTRACT:Pushover0analysis which is0also stated as Non-linear static analysis is widely used procedures for the seismic0assessment or evaluation of the structures. The advantage of using pushover analysis is its simplicity, efficiency in modeling and low computational time. Since the linear analysis is inadequate in assessing the seismic0demand of the0structure under the severe earthquakes, the pushover analysis is0used to evaluate the seismic demand of the proposed structure or for the existing structures. In this study pushover0analysis is carried to understand the behavior of G+8 multistoried building in two different zones0using ETABS software. From the analysis results it was found that maximum lateral load, story displacement and monitored displacement is increased in zone III compared to that of zone II. But the maximum base force is increased in zone II that of zone III. Here the hinges are formed between IO (Immediate Occupancy) to LS (Life Safety) which indicates the building is safe. Hence the structural model analyzed in this state is safe.
KEYWORDS: Pushover0analysis, seismic coefficient, response spectrum, target1displacement, hinge, monotonic loading.
I. INTRODUCTION
Earthquakes are due to sudden0shaking of the0ground, which is caused by the passage of seismic0waves through earth’s rocks. Earthquake is also known as a quake, tremor0or a temblor. The abrupt release of the energy in the earth’s0crust which causes seismic0waves results is known as earthquake. The energy in the earth’s crust may be released0by gravity,0elastic strain, chemical0reactions and motion of the0massive bodies. Among all of these, the energy released due to the elastic strain is most important cause, since this is the only form of0energy which can be stored in sufficient quantity in the earth that produces major0disturbances.. Most of the structures in India are low rise structures (up to four stories). A0close look0at response0spectrum from IS 1893 will indicate thatshort period structures (structures0with0less height) are subjected to large amount ofearthquake force. In spite of this fact most of the design0engineers0ignore severity of theproblem subjecting the0occupants to a higher-level of risk during the earthquakes.
ISSN(Online): 2319-8753 ISSN (Print): 2347-6710
I
nternational
J
ournal of
I
nnovative
R
esearch in
S
cience,
E
ngineering and
T
echnology
(A High Impact Factor, Monthly, Peer Reviewed Journal)
Visit: www.ijirset.com
Vol. 8, Issue 6, June 2019
II. OBJECTIVES
To carry out the response0spectrum analysis as per IS01893-Part 1 (2002) codal provision for developed structure models.
To0study the0behavior of the building in the form of top deflection by pushing0the building in one horizontal direction.
To perform the pushover analysis by applying lateral loads obtained from response spectrum0analysis as per0 IS-1893 (Part-1): 2002.
To obtain the seismic parameters like lateral loads to stories, story displacement, story drift, story shear, static pushover curve and hinge results.
To compare the performance point in two different zones for the considered building.
III.LITERATURESURVEY
Pushover1Analysis1of RC Building: Comparative2Study on1Seismic Zones of India (April 2017). P. PoluRaju, V. Mani Deep: In this study to understand the behaviour of G+9 multi-storeyed residential building located in different seismic zones (II, III, IV, V) of India having similar geometrical properties the non-linear static analysis (pushover analysis) has been done using SAP 2000 software. The behaviour of a multi-storeyed building has been examined in terms of force-displacement relationships,sequential hinge formations and inelastic behaviour of structure etc.
Effect1of Lateral1Load Patterns in2Pushover Analysis (November 2009).Abhilash R, Biju V, Thiruvananthapuram: A regular0single bay four0storied RCC structure is selected for the pushover analysis by applying0different lateral load0patterns0using ETABS and SAP2000 software’s. Four lateral load patterns selected in this study are uniform0load distribution and equivalent lateral force0distribution as per FEMA-257, lateral load patterns0as per0Upper bond0pushover0analysis (UBPA) method and lateral0loads obtained from response spectrum0analysis as per0IS-1893(2002). Here the structure is modelled first in ETABS and dynamic properties of the structure is calculated,0based on that the0lateral loads are calculated and the structure is again modelled and analysed in0SAP2000 software by applying different0lateral loads.
Pushover1Analysis5of RCC1Building (2013).Neethu K. N, Saji K. Kannur University, Kerala: In this paper the pushover analysis is conducted to determine the seismic0capacities of an existing building which is asymmetric in plan. Here as per IS 456:20000and IS01893:2002 the building frame is designed. The main objective is that to verify the type of performance that a building can give which is designed as per Indian codes. In this study, an educational building is considered which is situated in Kerala and the seismic performance is checked. The pushover analysis was carried out in SAP2000 software. In this analysis the maximum roof displacement of 640 mm was chosen. From the results it was found that the educational building is seismically safe.
IV.PROPOSEDMETHODOLOGYANDMODELLING
ISSN(Online): 2319-8753 ISSN (Print): 2347-6710
I
nternational
J
ournal of
I
nnovative
R
esearch in
S
cience,
E
ngineering and
T
echnology
(A High Impact Factor, Monthly, Peer Reviewed Journal)
Visit: www.ijirset.com
Vol. 8, Issue 6, June 2019
Target1displacement:The target1displacement serves as an estimate of0the global0displacement of the0structure is anticipated0to experience in a0design earthquake. Target displacement is the roof displacement1at0the0center of mass of the0structure. A model directly incorporating0the inelastic material response under the0non-linear static procedure is displaced to a target0displacement, and internal deformations are determined.0The target displacement is intended to represent1the maximum0displacement which is likely to be experienced during0the design earthquake. The lateral loads and roof displacement is given in fig. 1.
Fig. 1 – Lateral loads and roof displacement.
A G+8 building with OMRF (Ordinary Moment Resisting Frame) building is selected for the study. Two zones Zone II and Zone III are considered located on medium soil, as per IS 1893: 2002. The buildings are modeled using ETABS software. The pushover0analysis of a RC structure is carried out. Here the developed RC structure models are subjected to response spectrum0analysis and pushover0analysis is performed as per IS 1893- 2002 (Part 1). The table 1.shows the different0parameters considered for the development of0structure model. Dead loads and live loads are taken as per the codal provision IS 875-1987 (Part 1) and IS 875-1987 (Part 2) respectively. For earthquake IS 1893-2002 (Part 1) is considered for the analysis. Cross sectional dimensions of the slab, beams, columns are chosen by trial and error method in such a way that the RC Structures developed are safe.
Table 1 - Parameters considered for the development of the structure.
SL. NO. PARAMETERS REMARKS
1 Type of structure Commercial
2 Total stories G+8
3 Total height 25.2 m
4 Bay0width in0X-direction 9 m (6 bays)
5 Bay0width in0Y-direction 9 m (4 bays)
6 Size of0beam 250*500 mm
7 Size0of column 400*800 mm
8 Slab thickness 150 mm
9 Story height 3 m
10 Concrete grade for beams M40
11 Concrete grade for columns M40
12 Concrete grade for slabs M30
13 Steel grade (main bars) Fe 500
14 Steel grade (lateral ties) Fe 415
15 Density0of concrete 250KN/m3
16 Density0of brick 200KN/m3
17 Live load on floor
Live load on terrace
3 KN/m3 1.5 KN/m3
ISSN(Online): 2319-8753 ISSN (Print): 2347-6710
I
nternational
J
ournal of
I
nnovative
R
esearch in
S
cience,
E
ngineering and
T
echnology
(A High Impact Factor, Monthly, Peer Reviewed Journal)
Visit: www.ijirset.com
Vol. 8, Issue 6, June 2019
19 Wall0load on other floors (exterior only) 12.28 KN/m
20 Wall load on terrace (exterior only) 4.22 KN/m
21 Damping ratio 5%
22 Soil type Medium (II)
23 Zone factor 0.1 and 0.16
24 Importance factor 1
25 Response reduction factor 3
26 Wind speed 33 m/s (Bangalore)
27 Terrain category 3
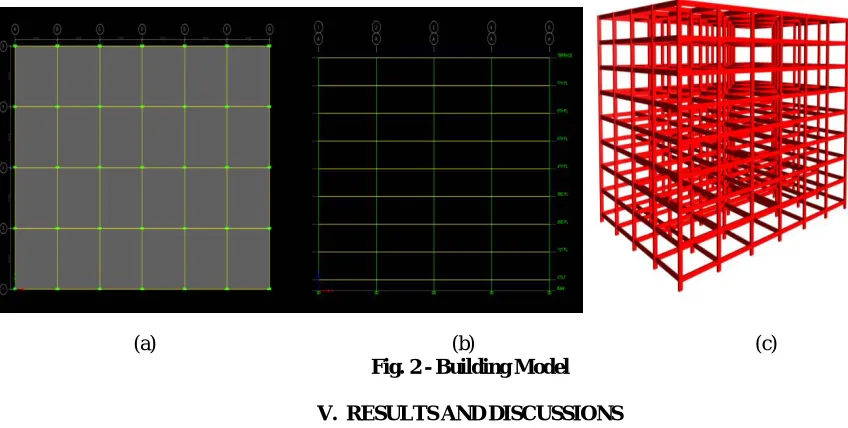
Figure 2 shows the building model in different views where (a) plan, (b) elevation, (c) isometric view.
(a) (b) (c)
Fig. 2 - Building Model
V. RESULTSANDDISCUSSIONS
The results that are obtained from0response spectrum analysis and pushover analysis for the developed structure model as per IS 1893-Part 1 (2002) using ETABS (Version 2016) software. The displacements and hinge formations in PX (push X) and PY (push Y) for two different zones are observed.
ISSN(Online): 2319-8753 ISSN (Print): 2347-6710
I
nternational
J
ournal of
I
nnovative
R
esearch in
S
cience,
E
ngineering and
T
echnology
(A High Impact Factor, Monthly, Peer Reviewed Journal)
Visit: www.ijirset.com
Vol. 8, Issue 6, June 2019
Fig. 3 - Displacements in PX (zone III) Fig. 4 - Displacement in PY (zone III)
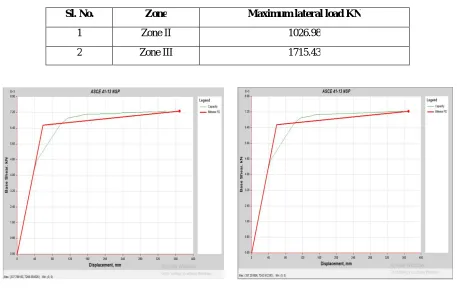
The maximum lateral load to stories obtained by response spectrum analysis for two different zones are shown in table 2.
Table 2 – Maximum lateral load obtained by RSA.
Sl. No. Zone Maximum lateral load KN
1 Zone II 1026.98
2 Zone III 1715.43
Fig. 5 - Base shear v/s monitored displacement (II) Fig. 6 - Base shear v/s monitored displacement (II)
ISSN(Online): 2319-8753 ISSN (Print): 2347-6710
I
nternational
J
ournal of
I
nnovative
R
esearch in
S
cience,
E
ngineering and
T
echnology
(A High Impact Factor, Monthly, Peer Reviewed Journal)
Visit: www.ijirset.com
Vol. 8, Issue 6, June 2019
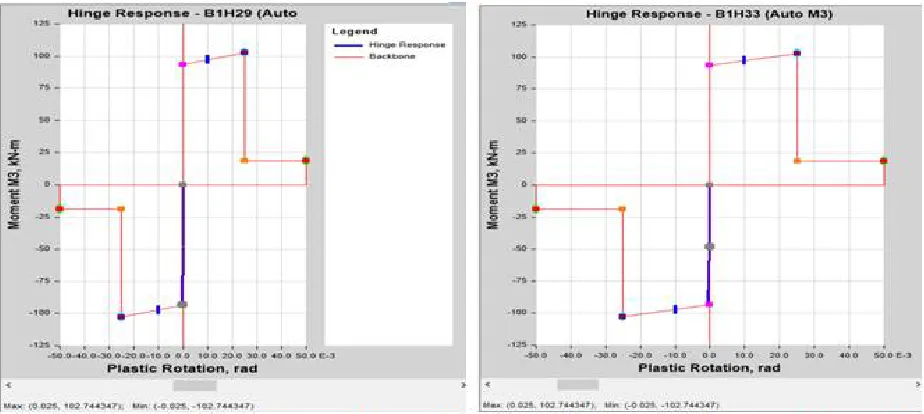
Fig. 7 – Hinge response in column for PX (III) Fig. 8 - Hinge response in column for PX (II)
Hinge results obtained from nonlinear static analysis for beams and columns for zone II and III are shown in figure 7, 8, 9 and 10.
ISSN(Online): 2319-8753 ISSN (Print): 2347-6710
I
nternational
J
ournal of
I
nnovative
R
esearch in
S
cience,
E
ngineering and
T
echnology
(A High Impact Factor, Monthly, Peer Reviewed Journal)
Visit: www.ijirset.com
Vol. 8, Issue 6, June 2019
Fig.11- Maximum story displacement along PX Fig.12- Maximum story displacement along PY
The maximum monitored displacement values obtained using pushover0analysis in X and Y directions for different zones are shown in figure 13 and 14.
Fig.13-Max.monitored displacement along PX. Fig.14- Max.monitored displacement along PY.
The maximum base force values obtained using pushover0analysis in X and Y directions for different zones are shown in figure 15 and 16.
37.25 37.3 37.35 37.4 37.45 37.5
Zone II Zone III
D is p lac e m e n t (m m )
Maximum story displacement in PX direction 36.2 36.25 36.3 36.35 36.4
Zone II Zone III
D is p lac e m e n t (m m )
Maximum story displacement in PY direction 320 330 340 350 360
Zone II Zone III
D is p lac e m e n t (m m )
Maximum monitored displacement in PX direction 0 0.001 0.002 0.003 0.004 0.005 0.006
Zone II Zone III
D is p lac e m e n t (m m )
ISSN(Online): 2319-8753 ISSN (Print): 2347-6710
I
nternational
J
ournal of
I
nnovative
R
esearch in
S
cience,
E
ngineering and
T
echnology
(A High Impact Factor, Monthly, Peer Reviewed Journal)
Visit: www.ijirset.com
Vol. 8, Issue 6, June 2019
Fig.15- Maximum base force in PX direction. Fig.16- Maximum base force in PY direction.
VI.CONCLUSION0ANDSCOPEFOR0FUTUREWORK
Inthe present study, seismic parameters such as story displacement, story drifts, lateral load to stories and static pushover curves for base force v/s monitored displacement plots are obtained.
The target displacement limit has shown no failure when the structure is subjected to analysis.
Hinge formations are seen in the beams when pushover analysis is performed. In this study more hinges are formed in X direction when compared to Y direction.
Also it has seen that the hinges are formed between IO (intermediate occupancy) to LS (life safety) which indicates the building is safe. Hence the structure model analyzed in this state is safe.
The lateral load to stories is more in zone III compared to zone II. But maximum story displacement and story drift results are almost same.
The maximum monitored displacement is within the value of target displacement that is assumed. The behavior of the structure is1significant to resist the2lateral loads.
Future Scope: In this study pushover analysis is performed without infill walls, but this work can be extended with considering infill walls and shear walls. In the present study the frame has been analyzed under the monotonic loading, this can be also analyzed under the cyclic loading so that the load-deflection curves can be monitored. The nonlinear0static procedure is extended for0seismic damage assessment of asymmetrical buildings.
REFERENCES
1. Chopra A. K and Goel R. K.“A modal pushover analysis procedure to estimate seismic demands of buildings” – theory and evaluation.
2. “Computers and Structures Inc. (CSI) ETABS 2016” for response spectrum analysis and pushover analysis.
3. S. I Javedein and R Taghinezhad, Islamic Azad University, Iran “Evaluation of lateral load pattern in pushover analysis” Earthquke Resistance Engineering Structures.
4. Abhilash. R and Biju. V, College of Engineering, Thiruvananthapuram, Kerala“Effect of lateral load patterns in pushover analysis”, Pg. 1-5, November 2009. 5. V. Manideepand P. PoluRaju, Department of Civil Engineering, K. L University, Andrapradesh“Pushover analysis of RC buildings and comparative study on
different seismic zones of India”IJCIET (International Journal of Civil Engineering and Technology), Volume 8 Issue 4, Pg. 567-578, April 2017.
6. Ashwini K. C and Dr. Y. M Manjunath, National Institute of Engineering, Mysore “Comparative study of pushover analysis on reinforced concrete structures”
IJERT (International Journal of Engineering Research and Technology), Volume 6 Issue 06, Pg. 71-79, June 2017.
7. Neetu K. N and Saji K. P Department of Civil Enginnering, Kannur University, Kerala. “Pushover analysis of reinforced concrete building” International Journal of Science and Research (IJSR), Volume 4 Issue 8, Pg. 208-211, August 2015.
8. “IS-1893 (Part 1): 2002” Indian standard code of criteria for seismic design of structures.
9. “IS-875 (Part 3): 1987” Code of practice for design loads (other than earthquake) for buildings and structures (Part 3 Wind Loads).
10. Paz, M“Structural Dynamics” - Theory and Computation.
7230 7240 7250 7260 7270 7280
Zone II Zone III
B as e fo r c e (K N )
Maximum base force in PX direction
4720 4725 4730 4735 4740
Zone II Zone III
B as e fo r c e (K N )